. 2022 Jun;23(6):878-891.
doi: 10.1038/s41590-022-01208-z. Epub 2022 May 26.

Astrocyte-targeted gene delivery of interleukin 2 specifically increases brain-resident regulatory T cell numbers and protects against pathological neuroinflammation

Affiliations

Astrocyte-targeted gene delivery of interleukin 2 specifically increases brain-resident regulatory T cell numbers and protects against pathological neuroinflammation

Lidia Yshii et al. Nat Immunol. 2022 Jun.

Abstract

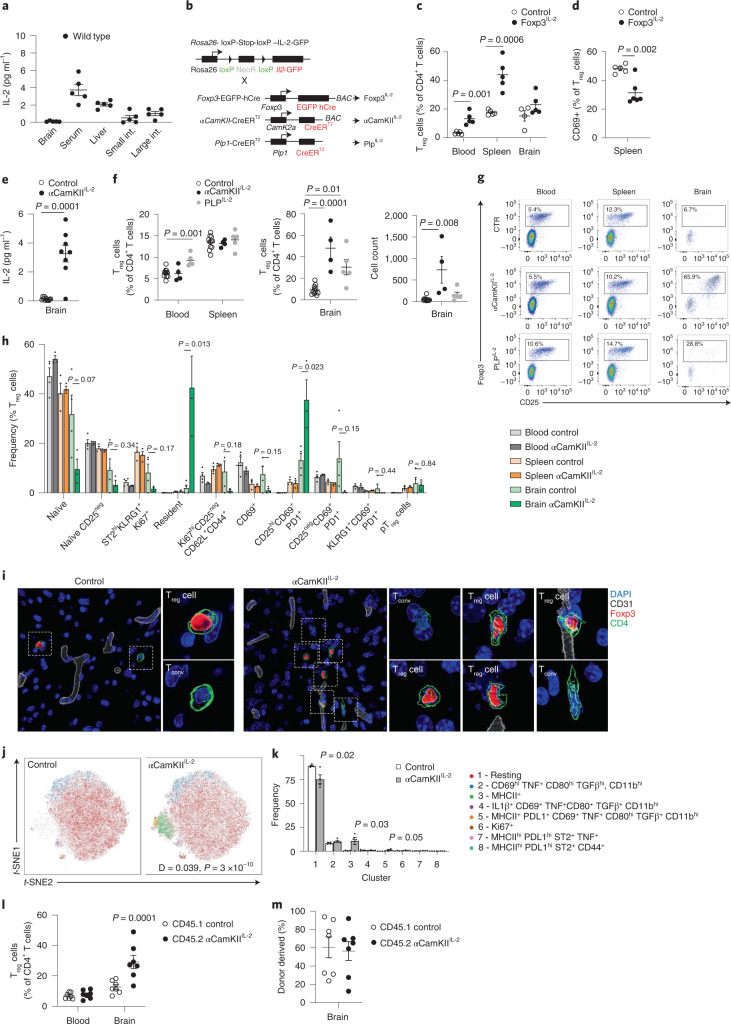
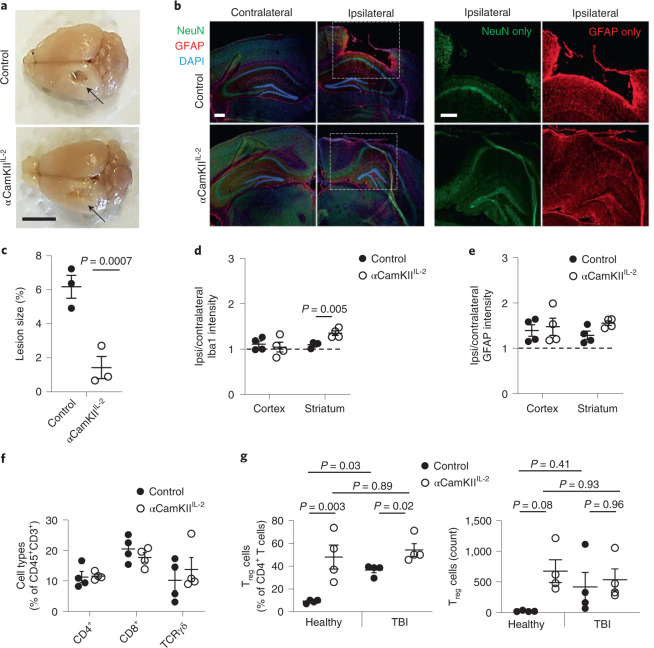
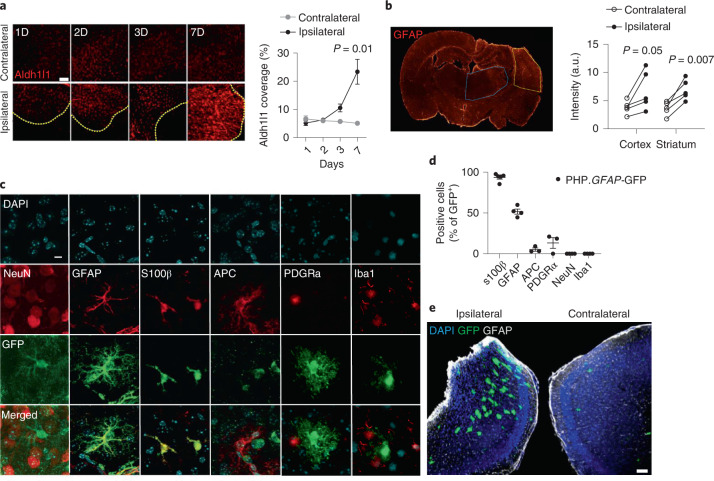
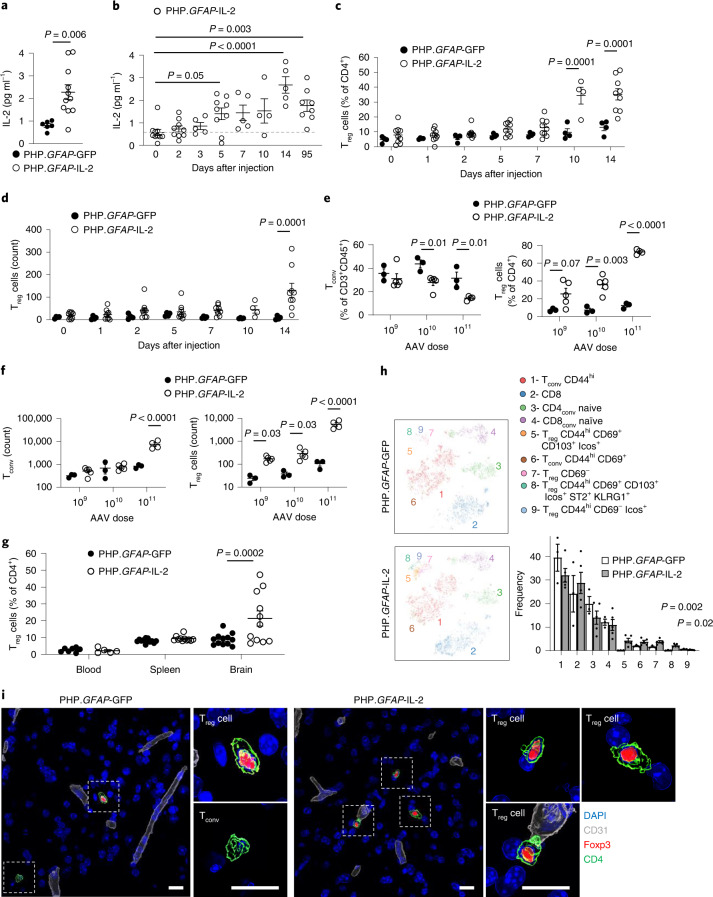
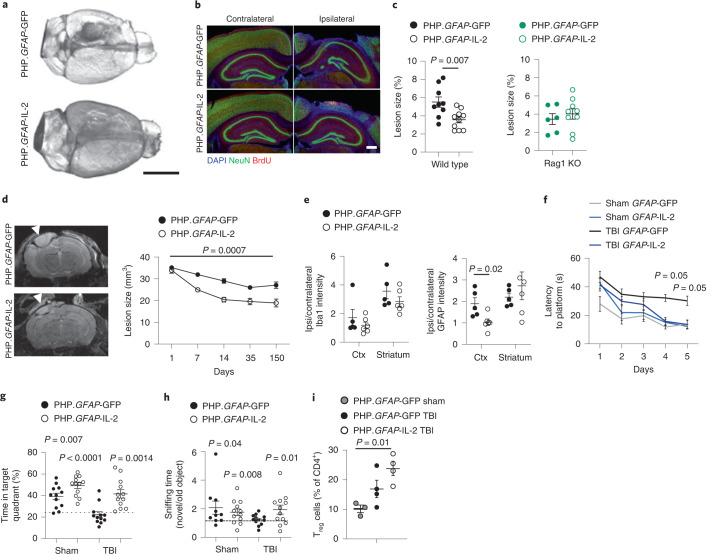
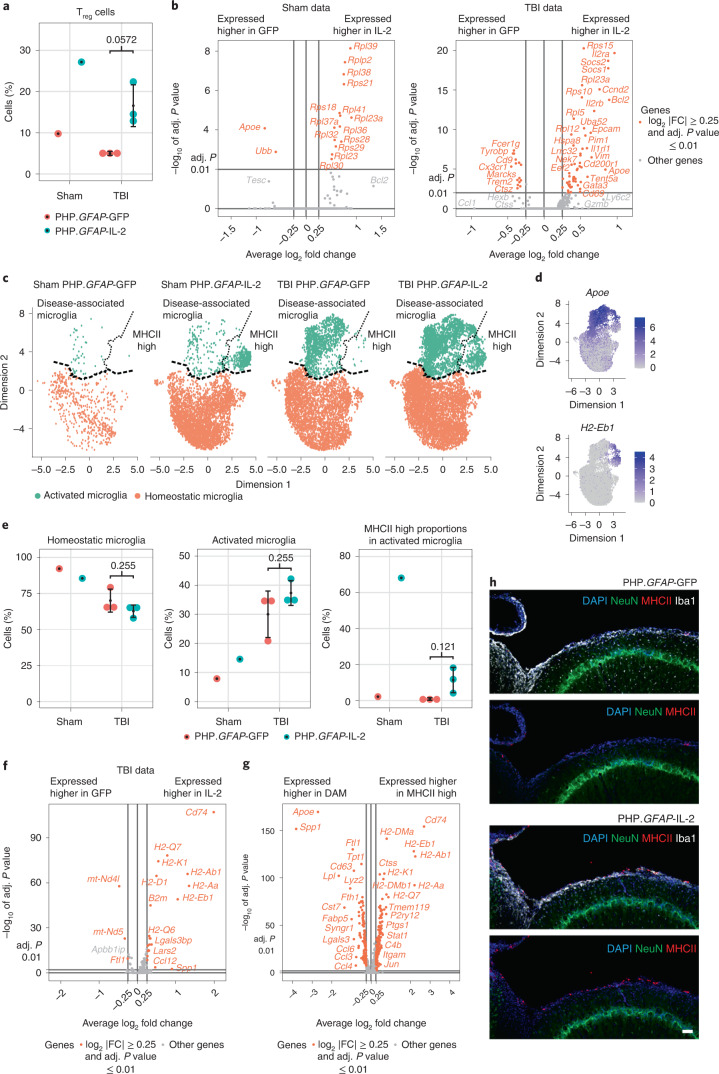
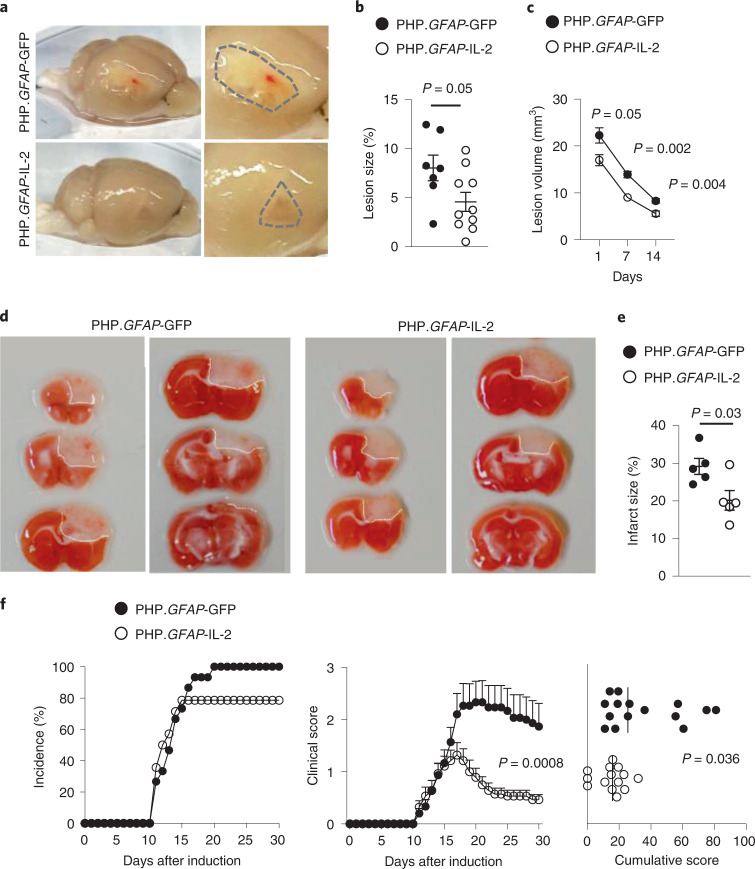
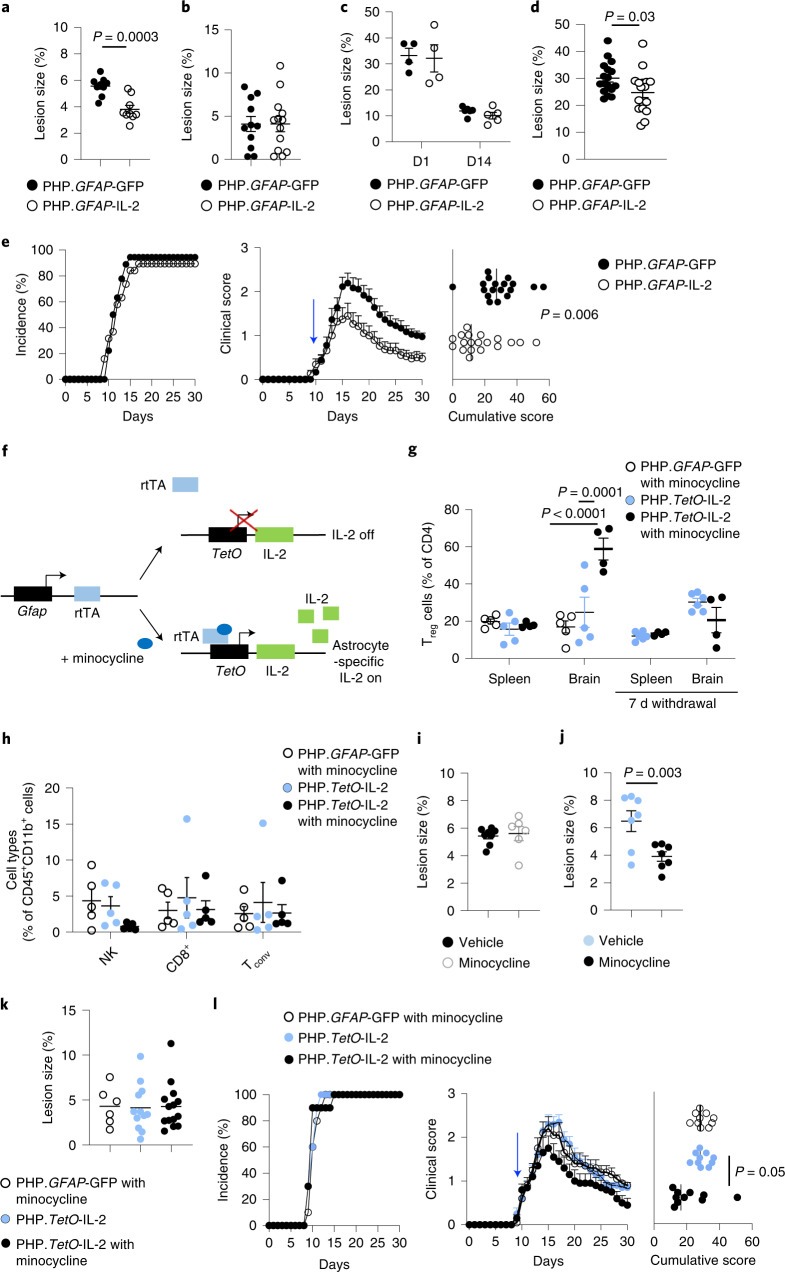
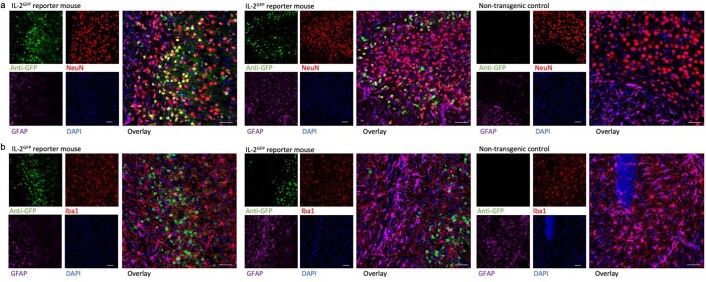
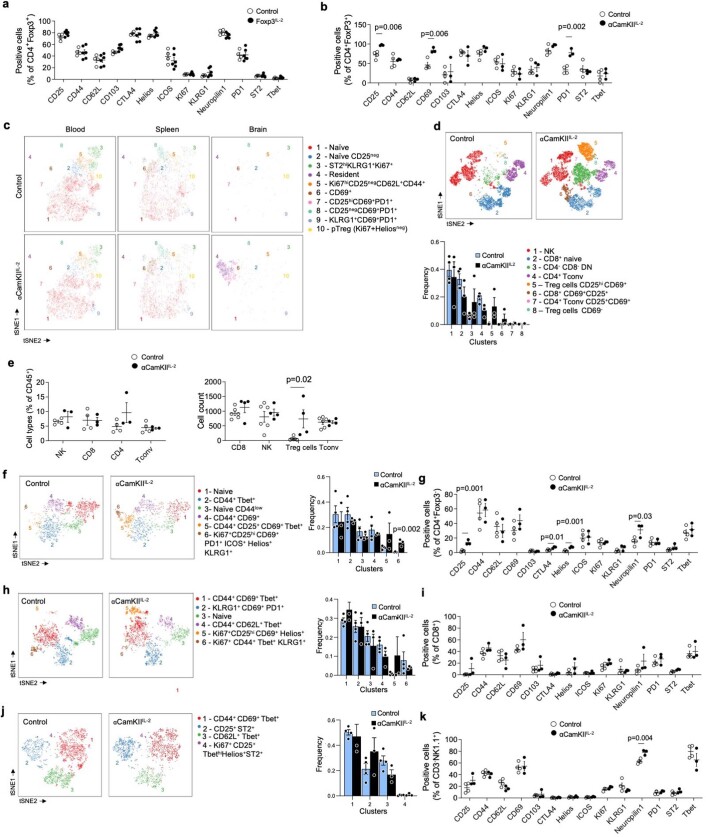
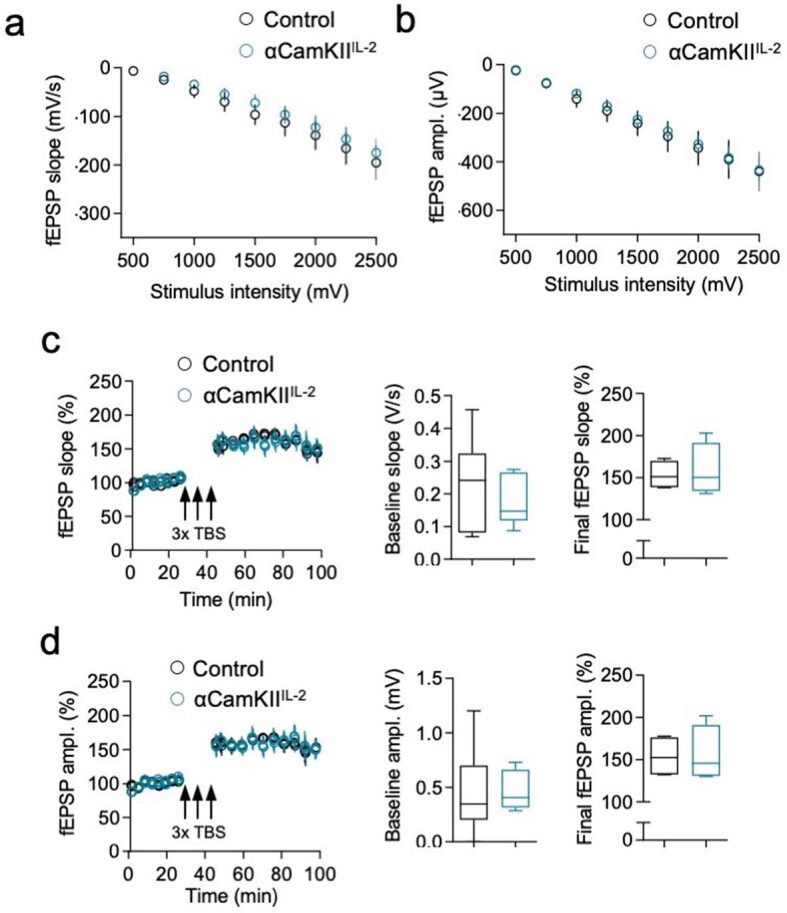
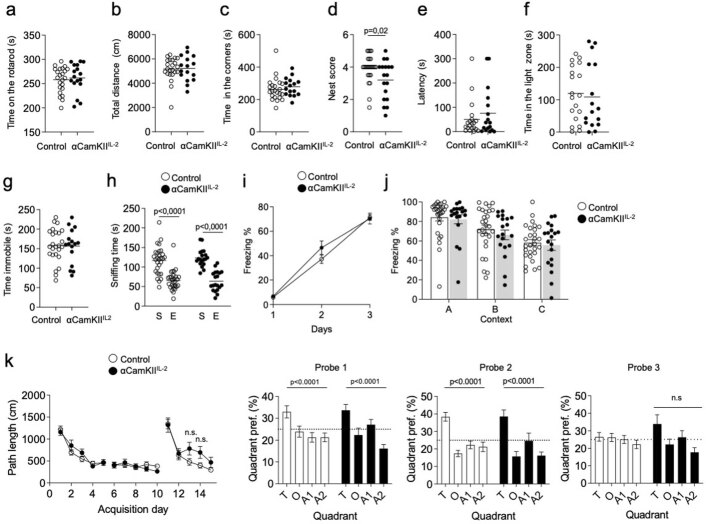
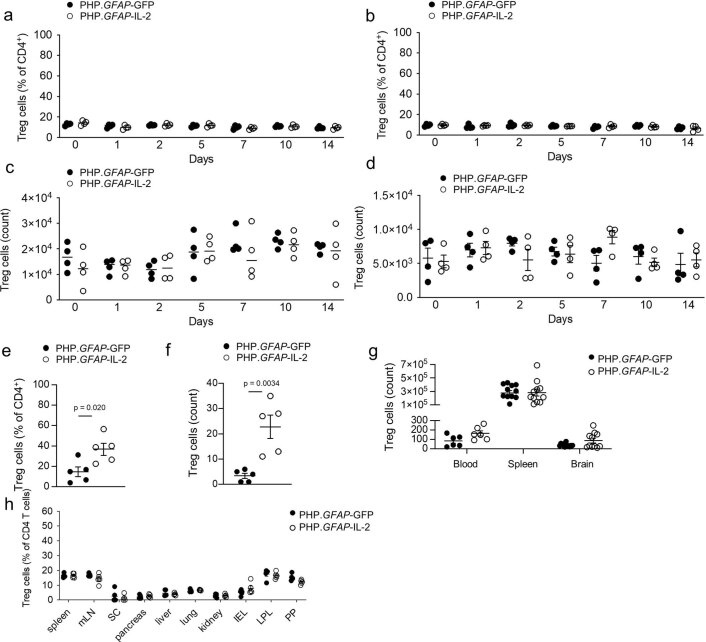
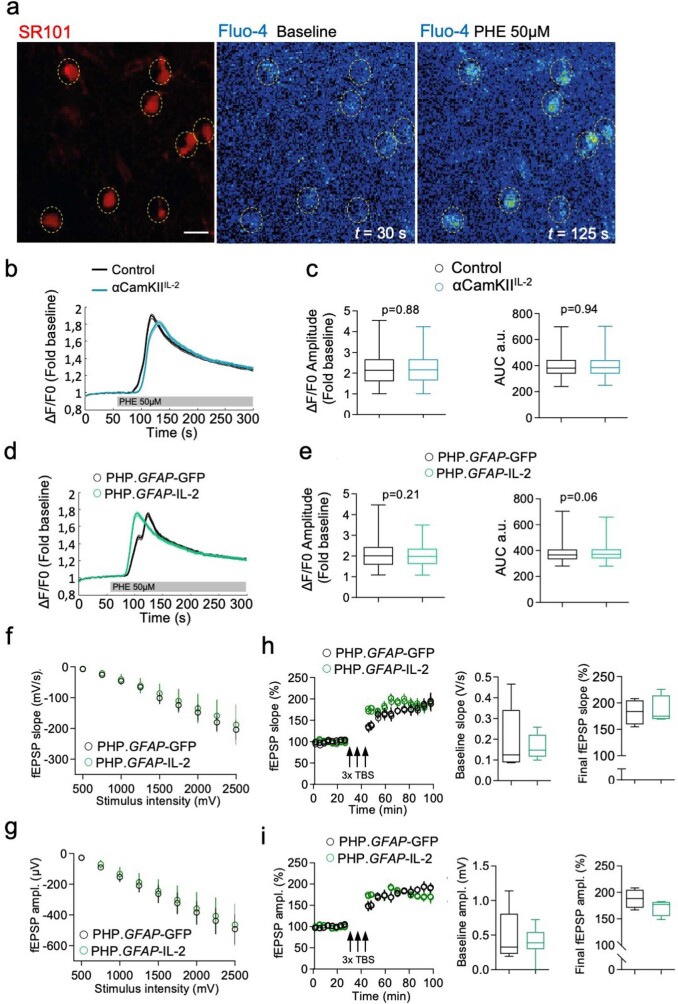
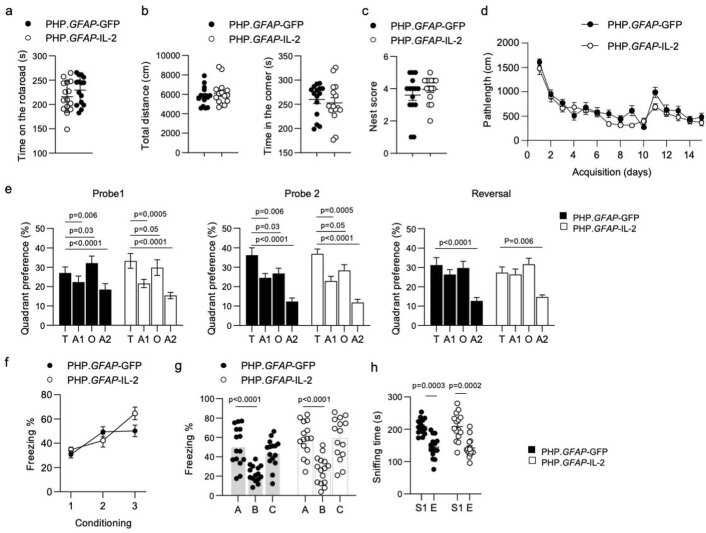
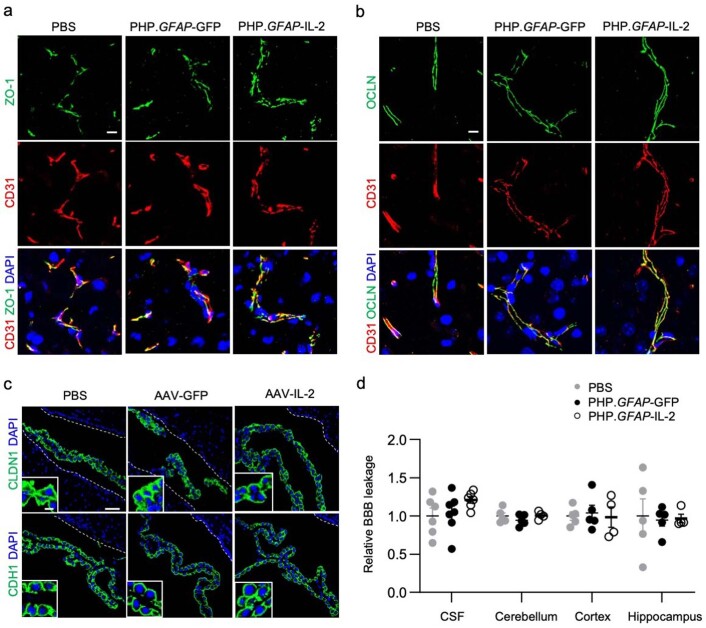
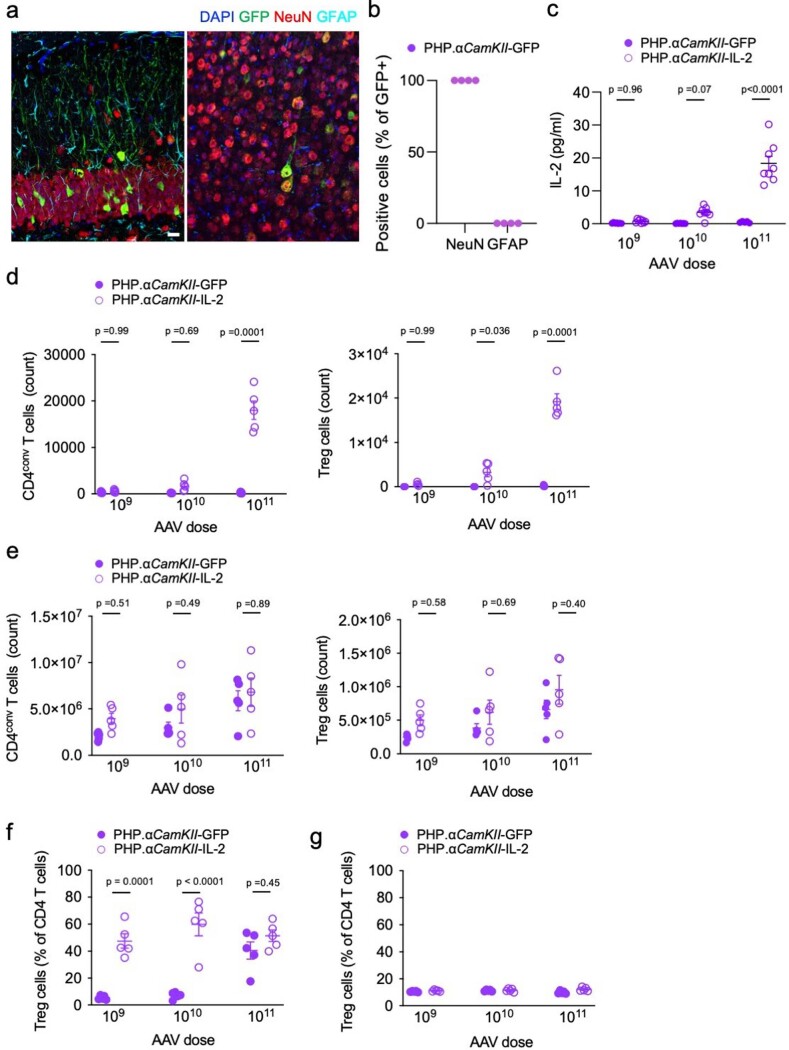
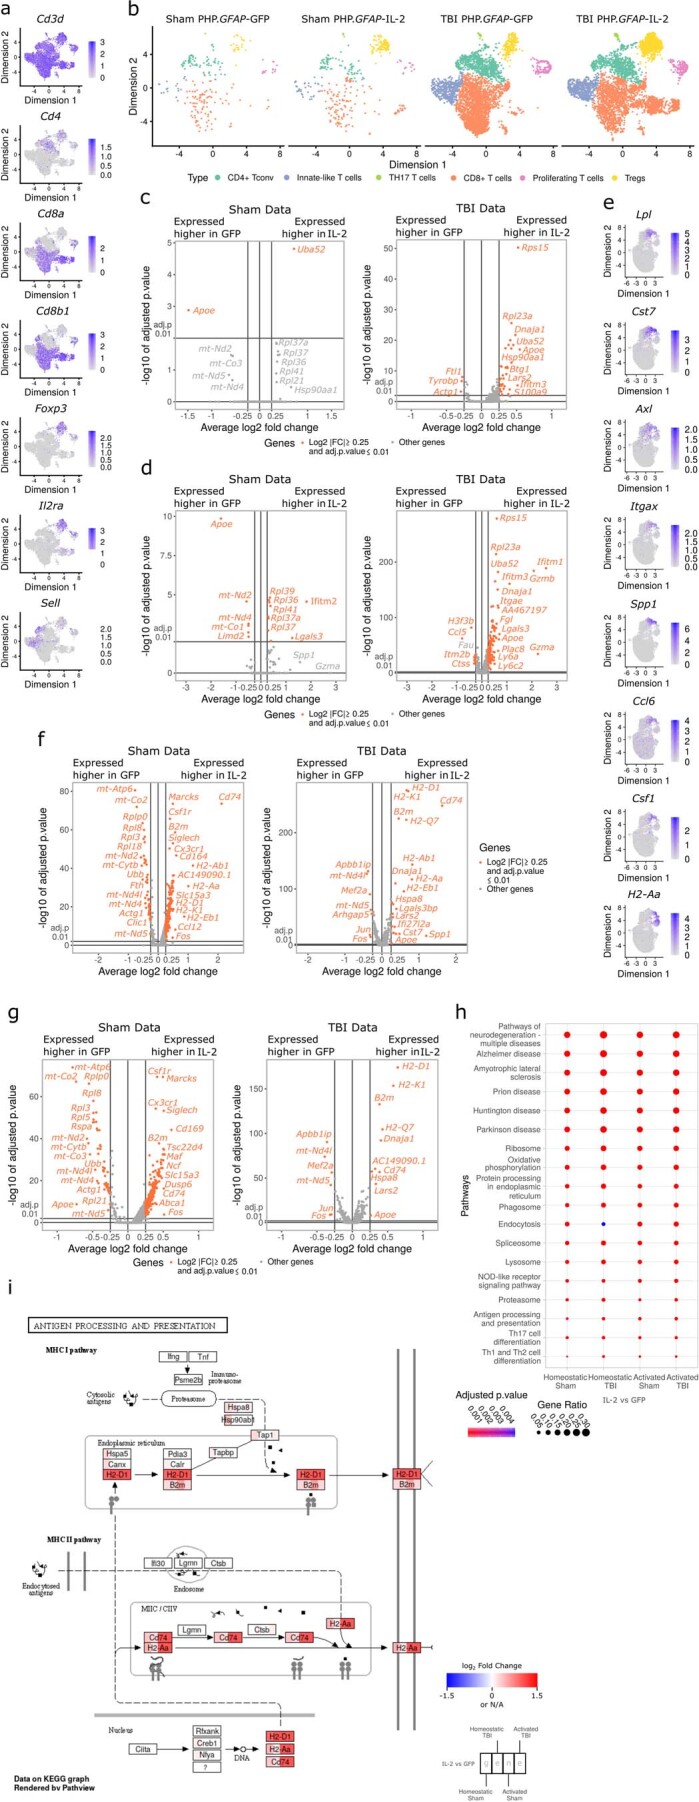
The ability of immune-modulating biologics to prevent and reverse pathology has transformed recent clinical practice. Full utility in the neuroinflammation space, however, requires identification of both effective targets for local immune modulation and a delivery system capable of crossing the blood-brain barrier. The recent identification and characterization of a small population of regulatory T (Treg) cells resident in the brain presents one such potential therapeutic target. Here, we identified brain interleukin 2 (IL-2) levels as a limiting factor for brain-resident Treg cells. We developed a gene-delivery approach for astrocytes, with a small-molecule on-switch to allow temporal control, and enhanced production in reactive astrocytes to spatially direct delivery to inflammatory sites. Mice with brain-specific IL-2 delivery were protected in traumatic brain injury, stroke and multiple sclerosis models, without impacting the peripheral immune system. These results validate brain-specific IL-2 gene delivery as effective protection against neuroinflammation, and provide a versatile platform for delivery of diverse biologics to neuroinflammatory patients.


Conflict of interest statement

The VIB and Babraham Institute are owners of patent PCT/GB2020/052148 based on work included in the manuscript, with L.Y., E.P., J.D., M.G.H. and A.L. potential financial beneficiaries of commercialization. The remaining authors declare no competing interests.

Figures

Fig. 1
Fig. 1. Local expression of IL-2 drives a brain-specific expansion of Treg cells.
a, IL-2 levels detected by ELISA (n = 5 per group). b, Schematic of transgenic systems for IL-2 expression. c,d, Frequency of Foxp3+ cells within CD4+ T cells (n = 5, 5; c), and CD69+ cells within Treg cells (n = 5, 6; d). e, IL-2 levels detected by ELISA (n = 11, 8). f, Frequency of Foxp3+ cells within CD4+ T cells (n = 8, 4, 5). Absolute number of Foxp3+ cells. g, Representative flow cytometry plots for f indicating Foxp3 and CD25 coexpression. h, Brain, spleen and blood from wild-type and αCamKIIIL-2 mice were compared by flow cytometry (n = 4, 3). i, Surface-rendered image of a Treg cell in the midbrain. A representative picture of three individual mouse samples is shown. Scale bar, 10 µm. j, Brains from wild-type and αCamKIIIL-2 mice were compared by flow cytometry (n = 4, 4; 64,927 cells plotted). t-distributed stochastic neighbor embedding (t-SNE) of microglia built on key markers (CD64, MHCII, PD-L1, CD80, CX3CR1 and CD45). k, Cluster quantification. l, CD45.1 mice parabiosed to tamoxifen-treated CD45.2 αCamKIIIL-2 mice. Percentage of Treg cells within the CD4+ T cell population in the blood and brain of parabiotic pairs (n = 7). m, Proportion of Treg cells from the CD45.1 or CD45.2 donor in the brain of parabiotic pairs. Data from a, cf, h and km are shown as the mean ± s.e.m. Statistical analyses were performed using an unpaired two-tailed Student’s t-test (d and e), unpaired two-tailed Student’s t-test with multiple-test correction (c, h and k), two-way analysis of variance (ANOVA; e and m) and one-way ANOVA (f). All experiments except a, j and k were repeated independently (≥ twice). pTreg, peripheral Treg cell. Source data
Fig. 2
Fig. 2. Protection from neuroinflammation following brain-specific expression of IL-2.
a, Control littermates and αCamKIIIL-2 mice were tamoxifen treated at 6 weeks and controlled cortical impacts to induce moderate TBI were given at 12 weeks. Mice were examined 15 d after TBI (n = 3, 3). Representative photos illustrating damage to the surface of the brain at the injury site. Arrow, site of impact. Scale bar, 0.5 cm. b, Representative immunofluorescence staining of the cortical tissue 14 d after cortical impact. GFAP (astrocytes), NeuN (neurons), DAPI (nuclei). Scale bars, 50 µm. c, Lesioned area, shown as the percentage of the entire hemisphere (n = 3, 3). d,e, Relative Iba1 (d) and GFAP (e) expression levels in the cortex and striatum (ratio of expression in ipsilateral versus contralateral hemispheres; n = 4, 4). f, TBI-induced perfused brains from wild-type and CamKIIIL-2 mice were compared at 15 d after TBI by high-dimensional flow cytometry (n = 4, 4). Frequency of CD4+, CD8+ and gamma delta (γδ) T cells within CD45+CD11b cells. g, TBI-induced perfused brains from wild-type and αCamKIIIL-2 mice were compared before TBI, or at 15 d after TBI by high-dimensional flow cytometry (n = 4 per group). Frequency of Treg cells within CD4+ T cells (left) and absolute number of Treg cells (right). Data from cg are shown as the mean ± s.e.m. Data are presented as individual biological replicates, n = 3 or 4 mice per group. Statistical analyses were performed using unpaired two-tailed Student’s t-test or one-way ANOVA (g). Source data
Fig. 3
Fig. 3. Synthetic delivery to the brain via a dual-lock gene-delivery system.
a, Wild-type mice were given controlled cortical impacts to induce moderate TBI and examined at 1, 2, 3 and 7 d after TBI (n = 5). Representative images (left) and quantification (right) of astrocyte coverage in the cortex adjacent to the lesion (delineated in yellow) or corresponding contralateral cortical area, ascertained via Aldh1l1 immunostaining (n = 3). Scale bar, 100 µm. Statistical analysis was performed using a t-test with multiple-test correction. b, Representative staining (left) and quantified expression (right) of GFAP in the cortex (yellow) and striatum (blue), 14 d after TBI (n = 5), with quantification. Scale bar, 50 µm. c, The GFAP promoter restricts gene expression (as assessed using GFP scoring) to astrocytes in adult mouse brain, based on characteristic cell morphology and by immunostaining for the astrocyte-specific markers, GFAP and S100β. Off-target expression was not detected when slices were counterstained for NeuN (neurons), APC (oligodendrocytes), PDGFRα (NG2+ cells) and Iba1 (microglia). Scale bar, 20 µm. Data are representative of three slices from at least three mice receiving a PHP.GFAP-GFP (control) vector. d, Quantification of GFP colocalization with cell lineage markers in PHP.GFAP-GFP-treated mice. e, Wild-type mice were given controlled cortical impacts to induce moderate TBI, treated with PHP.GFAP-GFP and examined at 14 d after treatment. Representative image of GFP production in the ipsilateral region surrounding the impact site or the corresponding contralateral cortical area. Scale bar, 100 µm. Data from a, b and d are shown as the mean ± s.e.m. Statistical analyses were performed using unpaired two-tailed Student’s t-test with multiple-comparisons test. a.u., arbitrary units. Source data
Fig. 4
Fig. 4. Dual-lock delivery of IL-2 to the brain expands local Treg cells.
a, IL-2 levels detected by ELISA in the brains of wild-type mice, 14 d after treatment with PHP.GFAP-GFP or PHP.GFAP-IL-2 (n = 6, 11). b, Time course of IL-2 levels in the brains of mice treated with PHP.GFAP-IL-2 (n = 10, 9, 5, 9, 5, 4, 5 and 8). c,d, Time course of Treg cell expansion, as a proportion (c) or absolute number (d) of CD4+ T cells in the brains of mice treated with PHP.GFAP-GFP or PHP.GFAP-IL-2 (n = 4, 9). e, Wild-type mice were administered 1 × 109 (n = 3, 5), 1 × 1010 (n = 3, 5) or 1 × 1011 (n = 3, 4) vector genomes (total dose) of PHP.GFAP-GFP or PHP.GFAP-IL-2 by intravenous injection and assessed for the frequency (e) or absolute number (f) of conventional T cells (left) and Treg cells (right) in the perfused brain 14 d after treatment (n = 3, 5 for the 1 × 109 and 1 × 1010 groups; n = 3, 4 for the 1 × 1011 group). g, Blood, spleens and perfused mouse brains from PHP.GFAP-GFP- and PHP.GFAP-IL-2-treated mice were compared by high-dimensional flow cytometry for Treg cell numbers (n = 7, 5 blood; n = 12, 11 spleen and brain). h, t-SNE of CD45+CD11bCD19CD3+ T cells built on key markers (CD4, CD8, Foxp3, CD62L, CD44, CD103, CD69, CD25, PD-1, Nrp1, ICOS, KLRG1, ST2, Ki67, Helios and CTLA4) from perfused brains. Colors indicate annotated FlowSOM clusters; results are quantified in the bar graph (n = 3, 5). Mean ± s.e.m. i, Representative images (surface-rendered confocal sections) of Treg cells in the midbrain of PHP.GFAP-GFP and PHP.GFAP-IL-2-treated mice. A representative picture of three individual mouse samples is shown. Scale bar, 10 µm. Data from ah are shown as the mean ± s.e.m. All experiments were repeated independently (≥ twice). Statistical analyses were performed using an unpaired two-tailed Student’s t-test (a and h), one-way ANOVA with Dunnett’s multiple-comparisons test (b) or two-way ANOVA with Bonferroni correction (cg). Source data
Fig. 5
Fig. 5. Gene delivery of IL-2 to the brain effectively prevents neurological damage during traumatic brain injury.
a, Wild-type mice treated with PHP.GFAP-IL-2 (day -14) or PHP.GFAP-GFP control were given controlled cortical impacts to induce moderate TBI and examined at 14 d after TBI (n = 5, 6). Representative tomography of the surface of the brain. Scale bar, 0.5 cm. b, Representative immunofluorescence staining of the cortical tissue 14 d after TBI (n = 5, 6). NeuN (neurons), BrdU (proliferation), DAPI (nuclei). Scale bar, 50 µm. c, Quantification of lost cortical area 14 d after TBI in wild-type mice (left), treated with PHP.GFAP-IL-2 or control vector on day -14 (n = 9, 10), or Rag1-knockout (KO) mice (right), treated with PHP.GFAP-IL-2 or control vector (n = 6, 9). d, Representative MRI and MRI-based quantification of lesion size in PHP.GFAP-GFP or PHP.GFAP-IL-2-treated mice on days 1, 7, 14, 35 and 150 after TBI (control n = 16, 16, 12, 11, 10; IL-2 n = 16, 16, 16, 12, 9). Arrowhead indicates the impact site. e, Relative Iba1 and GFAP expression levels in the cortex and striatum (ratio of expression in ipsilateral versus contralateral hemispheres; n = 5, 6). f, Latency to find a hidden platform in the Morris water maze test during acquisition learning, for PHP.GFAP-GFP and PHP.GFAP-IL-2-treated mice, with and without (sham) TBI. P values are for TBI PHP.GFAP-GFP against TBI PHP.GFAP-IL-2 (n = 12, 12). g, Percentage of total time spent in the target quadrant during the probe trial (n = 12, 12). h, Ratio of time spent exploring a novel object over an old object during day 2 of the novel object recognition paradigm (n = 10, 12, 12, 12). i, Mice treated with PHP.GFAP-GFP control or PHP.GFAP-IL-2 (day -14) were given controlled cortical impacts and examined at 15 d after TBI (n = 3, 4, 4); a sham TBI was included in the PHP.GFAP-GFP group. Brains from sham, TBI and PHP.GFAP-IL-2-treated TBI mice were compared by flow cytometry for the frequency of Treg cells as a proportion of CD4+ T cells. Data from ci are shown as the mean ± s.e.m. All experiments were repeated independently (≥ twice). Statistical analyses were performed using non-parametric Mann–Whitney U test (c and e), one-way ANOVA (i) against chance level (g and h) or two-way ANOVA (c, f and d). Source data
Fig. 6
Fig. 6. Brain-specific delivery of IL-2 drives microglial transcriptional divergence during TBI.
ah, Wild-type mice, treated with PHP.GFAP-IL-2 (or PHP.GFAP-GFP control vector) on day -14 were subjected to controlled cortical impacts to induce moderate TBI or sham surgery. At 14 d after TBI, T cells and microglia were sorted from the ipsilateral hemisphere of the perfused brains for 10x single-cell transcriptomics. a, T cells were clustered and annotated, based on markers defined in Extended Data Fig. 10a,b. Quantification of the Treg cell cluster based on group. b, Volcano plot showing differential gene expression in the Treg cell cluster between PHP.GFAP-GFP-treated mice and PHP.GFAP-IL-2-treated mice, for sham and TBI groups. c, Microglia uniform manifold approximation and projection (UMAP) representation, showing the location of cells per cluster for each treatment group. d, Cluster annotation based on expression of Apoe and H2-Eb1; expression of additional inflammatory markers is shown in Extended Data Fig. 10e. e, Quantification of the homeostatic and activated microglial clusters, and, within the activated microglial cluster, the relative contribution of the DAM and MHCIIhi subclusters. f, Volcano plot showing differential gene expression in the activated microglial cluster between PHP.GFAP-GFP-treated mice and PHP.GFAP-IL-2-treated mice, for TBI. g, Volcano plot showing differential gene expression, independent of treatment group, for the DAM versus MHCIIhi subclusters. h, Representative immunofluorescence staining of the cortical tissue at 14 d after TBI (n = 5, 6). NeuN, MHCII, DAPI and Iba1. Scale bar, 50 µm. Data from a and e are shown as the mean ± s.d.; n = 3 per group for TBI and n = 1 per group for sham. Statistical analyses were performed using unpaired two-tailed Student’s t-test (a and e) and volcano plots used the negative binomial test for differential expression (b, f and g). Source data
Fig. 7
Fig. 7. Neuroprotective utility for dual-lock IL-2 gene delivery across multiple neuroinflammatory pathologies.
a, Wild-type mice, treated with control PHP.GFAP-GFP or PHP.GFAP-IL-2 on day -14, were given a dMCAO stroke and examined 15 d after stroke for macroscopic damage (outlined by dashed lines) with 2,3,5-triphenyl tetrazolium chloride (TTC)-aided quantification of stroke damage (n = 7, 10; b) and longitudinal MRI-based quantification of lesion size (n = 11, 17; c). d,e, Wild-type mice, treated with control PHP.GFAP-GFP or PHP.GFAP-IL-2 on day -14 (n = 5, 5), were given a photothrombotic stroke and examined 1 d after stroke for macroscopic damage (representative images, with lesion outlined; d) and TTC-aided quantification of stroke damage (e). f, EAE was induced in wild-type mice, following treatment with control vector (PHP.GFAP-GFP) or PHP.GFAP-IL-2 on day -14 (n = 15, 14). Incidence, daily clinical score (mean ± s.e.m.) and cumulative mean clinical score. All experiments were repeated independently (≥ twice). Statistical analyses were performed using unpaired two-tailed Student’s t-test (b and e), unpaired, non-parametric Mann–Whitney U test (f), or two-way ANOVA (f and c). Source data
Fig. 8
Fig. 8. Neuroprotective utility for dual-lock IL-2 gene delivery across multiple neuroinflammatory pathologies.
a, Mice were given TBI, followed by treatment with PHP.GFAP-IL-2 or PHP.GFAP-GFP, examined 14 d after TBI (n = 9, 9). Quantification of lost cortical area. b, Mice were given dMCAO stroke and treated with PHP.GFAP-GFP or PHP.GFAP-IL-2, and examined at 15 d after stroke for TTC-aided quantification (n = 11, 13). c, Mice were given photothrombotic stroke and treated with PHP.GFAP-GFP or PHP.GFAP-IL-2, and examined 1 d (n = 4, 4) or 14 d (n = 6,5) after stroke for TTC-aided quantification. d, TTC-aided quantification of post-secondary stroke (n = 17, 17). e, EAE was induced in wild-type mice and, 10 d after induction, mice were treated with PHP.GFAP-GFP or PHP.GFAP-IL-2 (n = 18, 19; blue arrow): incidence, daily clinical score, cumulative mean clinical score (n = 15, 14). f, Design of PHP.TetO-IL-2.GFAP-rtTA. g, Wild-type mice were administered control vector or PHP.TetO-IL-2.GFAP-rtTA and gavaged with PBS or minocycline. The number of brain Treg cells was assessed 11 d after treatment (n = 5, 5, 4). Additional groups were assessed 1 week after minocycline withdrawal (n = 6, 4). h, Frequency of CD8+ T cells, natural killer (NK) cells and CD4+ Tconv cells in the brain (n = 5 per group). i, Wild-type mice were given TBI, followed by control vector. Quantification of cortical area lost on day 14 (n = 8, 6). j, Wild-type mice were given TBI, followed by treatment with PHP.TetO-IL-2.GFAP-rtTA, with or without minocycline. Quantification of lost cortical area on day 14 (n = 7, 7). k, Mice were given dMCAO stroke and treated with control vector plus minocycline, or PHP.TetO-IL-2.GFAP-rtTA, without or with minocycline. Mice were examined at 15 d after stroke for TTC-aided quantification (n = 6, 12, 14). l, EAE was induced in wild-type mice, following treatment with PHP.TetO-GFP.GFAP-rtTA or PHP.TetO-IL-2.GFAP-rtTA, with or without minocycline on day 10 (n = 10 per group) after induction. Incidence, daily clinical score and cumulative mean clinical score are shown. Data are the mean ± s.e.m. All experiments were repeated independently (≥ twice). Statistical analyses were performed using unpaired two-tailed Student’s t-test (a, d and j), unpaired, non-parametric Mann–Whitney U test (e and i) or two-way ANOVA with Tukey’s test (g). Source data
Extended Data Fig. 1
Extended Data Fig. 1. IL-2 reporter expression in neurons.
Healthy perfused mouse brains from IL-2GFP mice and non-transgenic controls assessed for GFP reporter expression by immunohistochemistry. a, anti-GFP IL-2 reporter (green), NeuN (red), GFAP (purple) and DAPI (blue). Single and combined channel confocal images of GFP-expressing NeuN+ cells in the mid-brain, compared to non-transgenic control. b, anti-GFP IL-2 reporter (green), Iba1 (red), GFAP (purple) and DAPI (blue). Single and combined channel confocal images of GFP-expressing cells in the mid-brain, compared to non-transgenic control. All images are of representative sections from three mice (n = 3/group). Scale bar, 50 µm.
Extended Data Fig. 2
Extended Data Fig. 2. Brain regulatory T cell-specific effects of neuronal IL-2 production.
a, Spleen from wildtype and Foxp3IL-2 mice were compared by flow cytometry (n = 4, 6). Frequency of key markers (CD25, CD44, CD62L, CD103, CTLA4, Helios, ICOS, Ki67, KLRG1, Neuropilin1, PD1, ST2, Tbet) on Treg cells in spleen. b, Brain from wildtype and αCamKIIIL-2 mice were compared by high-dimensional flow cytometry (n = 4, 3). Frequency quantification of key markers on Treg cells. c, tSNE of blood, spleen and brain Treg cells built on key markers. Colors indicate annotated FlowSOM clusters, with quantification in Supplementary Fig. 5 f. tSNE run on samples pooled post-acquisition, with quantification performed on individual samples (n = 4, 3). The residential cluster is characterized as CD25hiCD69 + PD1 + CD103 + . d, tSNE of total leukocytes from brain of wildtype and αCamKIIIL-2 mice, built on lineage markers with quantification. tSNE run on samples pooled post-acquisition, with quantification performed on individual samples (n = 4, 3). e, NK, CD4 and CD8 T cells, (left) as a proportion of CD45 + CD11b cells in the brain (n = 4, 3)., and (right) in absolute numbers, together with Treg cells (n = 6, 4). f, tSNE of brain CD4 conventional T cells built on key markers (CD62L, CD44, CD103, CD69, CD25, PD-1, Nrp1, ICOS, KLRG1, ST2, Ki67, Helios, T-bet, CTLA4). tSNE run on samples pooled post-acquisition, with quantification performed on individual samples (n = 4, 3). Colors indicate annotated FlowSOM clusters, with quantification and g, frequency of marker expression. h, tSNE of brain CD8 T cells built on key markers. tSNE run on samples pooled post-acquisition, with quantification performed on individual samples (n = 4, 3). Colors indicate annotated FlowSOM clusters, with quantification and i, frequency of marker expression. j, tSNE of brain NK cells built on key markers (t-SNE run on samples pooled post-acquisition, with quantification performed on individual samples (n = 4, 3). Colors indicate annotated FlowSOM clusters, with quantification and k, frequency of marker expression. Data are displayed as mean ± s.e.m. (a,b,d-k). Statistical analyses were performed using multiple unpaired two-tailed Student’s t-test. Source data
Extended Data Fig. 3
Extended Data Fig. 3. Normal long-term potentiation in αCamKIIIL-2 mice.
Field excitatory post-synaptic potentials (fEPSPs) were recorded from Schaffer collateral-CA1 neuronal synapses in brain slices from wildtype and αCamKIIIL-2 littermates. Input-output curves were recorded for each slice by applying single-stimuli ranging from 500 to 2750 mV with 250 mV increments. a Slope and b amplitude were analyzed (n = 4,4). Long-term potentiation (LTP) was induced by applying three high frequency trains (theta-burst stimulation (TBS): 100 stimuli; 100 Hz) with 5 minutes intervals between trains. After baseline determination, fEPSPs were measured for 55 minutes. Changes in the c slope and d amplitude have been analyzed across time. Boxplots represent quantification of the baseline (left) (Amplitude: Minimum (0, 02845), 25% Percentile, (0.2020, 0.3137), Median (0.3471, 0.4084), 75% Percentile (0.6997, 0.6627), Maximum (1.203, 0.7302); Slope: Minimum (0.06911, 0.08740), 25% Percentile (0.08134, 0.1182), Median (0.2409, 0.1463), 75% Percentile (0.3236, 0.2653), Maximum (0.4574, 0.2747) and final LTP (right) (Amplitude: Minimum (132.1, 130), 25% Percentile (132.4, 130.8), Median (152.7, 145.7), 75% Percentile (176.5, 191.1), Maximum (177.9, 202); Slope: Minimum (138.2, 131.3), 25% Percentile (138.7, 134.4), Median (151.3, 150.3), 75% Percentile (170.3, 191.6), Maximum (173.0, 203.2)). Mean ± s.e.m. (n = 4,4). Statistical analyses were performed using unpaired, nonparametric Mann–Whitney U-test. Source data
Extended Data Fig. 4
Extended Data Fig. 4. Normal behavior in mice with expanded brain regulatory T cells.
Behavioral assessment of αCamKIIIL-2 and littermate control mice. a, Time spent on the rod, average of 4 repeated tests of 300 seconds (n = 23, 17). b, Open field, total distance moved and c time spent in the corners (n = 23, 16). d, Nest building scoring (n = 24, 18). e, Light-dark test latency to enter light zones and f time spent in the light zone (n = 20, 17). g, Time immobile during forced swim test (n = 24, 16). h, Sociability test trials to monitor the interaction with a stranger mouse (S) compared to an empty chamber (E) (n = 28, 18). i, Freezing behavior over time during context acquisition conditioning (n = 28, 18). j, Contextual discrimination during generalization test (n = 28, 18). k, Spatial learning in the Morris water maze. Path length to finding the hidden platform (n = 28, 18), probe tests after 5 days and 10 days and after reversal learning (n = 28, 18). All data are displayed as mean ± s.e.m. All experiments were repeated two times independently. Statistical analyses were performed using Two-way ANOVA with multiple comparison correction (h, i, j) or Two-way Repeated Measures (RM) ANOVA (k). Source data
Extended Data Fig. 5
Extended Data Fig. 5. PHP.GFAP-IL-2 expands regulatory T cells in the brain without impacting draining lymph nodes.
Mice were treated with PHP.GFAP-GFP or PHP.GFAP-IL-2 and assessed for Treg numbers by flow cytometry of perfused mice (n = 4-5, 4-9). a, Frequency of Treg cells, as a proportion of CD4 T cells in the superficial cervical lymph nodes (n = 4, 4), and b deep cervical lymph nodes (n = 4, 4). c, Absolute number of Treg cells in superficial cervical lymph nodes (n = 4, 4), and d deep cervical lymph nodes (n = 4, 4). e, Frequency and f absolute number of Treg cells in the pia mater, 14 days after PHP.GFAP-GFP or PHP.GFAP-IL-2 treatment (n = 5,5). g, Blood, spleen and perfused mouse brain from PHP.GFAP-GFP and PHP.GFAP-IL-2-treated mice were compared by high-dimensional flow cytometry for Treg numbers (n = 6, 6 blood; 12, 11 spleen and brain). h, Perfused organs from PHP.GFAP-GFP and PHP.GFAP-IL-2-treated mice were compared by flow cytometry for Treg frequency (n = 5/group). mLN, mesenteric lymph nodes; SC, spinal cord; IEL, intraepithelial leukocytes; LPL, lamina propria leukocytes; PP, Peyer’s Patch. Statistical analyses were performed using unpaired, non-parametric Mann–Whitney U-tests. Source data
Extended Data Fig. 6
Extended Data Fig. 6. Elevated IL-2 did not produce detectable effects on astrocyte or neuron function.
Astrocyte Ca2+ imaging in acute brain slices. a, Left, SR101+ astrocytes (dotted circles). Right, Fluo4 signal at baseline and following Phenylephrine (PHE) application. b, Averaged ΔF/F0 traces ± s.e.m. c, Boxplots of ΔF/F0 amplitude (left) and Area Under the Curve (AUC) (right). n = 3 mice/group and nastrocytes = 710, 774 for control and αCamKIIIL-2. Whiskers represent maximal and minimal values. For AUC, Minimum (240.1, 249.1), 25% Percentile (338.1, 338.7), Median (381.8, 385.1), 75% Percentile (443.8, 442), Maximum (699.3, 702.3). For ΔF/F0 amplitude, Minimum (1.006, 1.007), 25% Percentile (1.604, 1.648), Median (2.139, 2.161), 75% Percentile (2.664, 2.665), Maximum (4.542, 4.239) d, Averaged ΔF/F0 traces ± s.e.m. e, Boxplots of the ΔF/F0 amplitude (left) and AUC (right). n = 3 mice/group, and nastrocytes = 609, 646 for PHP.GFAP-GFP and PHP.GFAP-IL-2, respectively. Whiskers represent maximal and minimal values. For ΔF/F0 amplitude: Minimum (1.086, 1.075), 25% Percentile (1.578, 1.617), Median (2.007, 1.980), 75% Percentile (2.431, 2.348), Maximum (4.463, 3.489). For AUC: Minimum (280.6, 279.3), 25% Percentile (332.3, 339.7), Median (366.4, 371), 75% Percentile (408.7, 409.2), Maximum (704.4, 659.5). Neuronal function was measured using fEPSPs in PHP.GFAP-GFP and PHP.GFAP-IL-2 treated mice (n = 4,4). Input-output curves were recorded by applying single-stimuli. Slope f, and g, amplitude were analyzed. LTP was induced by applying three high frequency stimulus trains (100 stimuli; 100 Hz; arrows theta burst stimulation - TBS). After baseline, fEPSPs were measured. Changes in h, slope and i, amplitude were analyzed across time. Boxplots of the baseline (left) and final LTP (right). Mean ± s.e.m. Whiskers represent the maximal and minimal values. For slope at baseline: Minimum (0,08681, 0,09894), 25% Percentile (0.08875, 0.1164), Median (0.1248, 0.1473), 75% Percentile (0.3407, 0.2212), Maximum (0.4659, 0.2584); for slope of final LTP: Minimum (154.8, 169.4), 25% Percentile (159.4, 169.7), Median (184, 174.9), 75% Percentile (204.8, 214.1), Maximum (208.3, 225.8). For amplitude at baseline, Minimum (0.1941, 0), 25% Percentile (0.2298, 0.2979), Median (0.3279, 0.3897), 75% Percentile (0.8083, 0.5444), Maximum (1.139, 0.7234). For amplitude of final LTP: Minimum (166.9, 148.7), 25% Percentile (171, 155.3), Median (188.7,177.2), 75% Percentile (204.8, 181.9), Maximum (208.4, 1828). Unpaired, non-parametric Mann–Whitney U-test. Source data
Extended Data Fig. 7
Extended Data Fig. 7. Normal behavior in PHP.GFAP-IL-2-treated mice.
Behavioral assessment of wildtype mice treated with PHP.GFAP-GFP or PHP.GFAP-IL-2. a, Time spent on the rod, average of 4 repeated tests of 300 seconds (n = 15,15). b, Open field, total distance moved and time spent in the corners (n = 15,15). c, Nesting behavior (n = 15,15). d, Spatial learning in the Morris water maze. Path length to finding the hidden platform (n = 15,15). e, Probe tests after 5 days and 10 days and after reversal learning (n = 15,15). f, Freezing behavior over time during context acquisition conditioning (n = 15,15). g, Contextual discrimination during generalization test (n = 15,15). h, Sociability test trials to monitor the interaction with a stranger mouse (S1) compared to an empty chamber (E) (n = 15,15). Mean ± s.e.m. All experiments were repeated twice independently. Statistical analyses were performed using an unpaired two-tailed Student’s t-test. Source data
Extended Data Fig. 8
Extended Data Fig. 8. Intact blood-brain barrier integrity following PHP treatment.
Wildtype mice treated with PBS, PHP.GFAP-GFP or PHP.GFAP-IL-2 were assessed at post-injection day 14 for blood-brain barrier (BBB) integrity. a, Histological assessment for CD31, Zonula occludens-1 (ZO-1) and DAPI or b CD31, Occludin (OCLN) and DAPI. Scale bar, 10 µm. c, Histological assessment for CLDN1 and DAPI or E-cadherin/CDH1 and DAPI. Scale bar, 50 µm. Insert scale bar, 10 µm. d, Mice were injected i.v. with 4 kDa FITC-dextran, followed by quantification in the cerebral spinal fluid (CSF), cerebellum, cortex and hippocampus (n = 6, 7, 6 CSF; 5, 5, 4 Cerebellum, Cortex, Hippocampus). Mean ± s.e.m. Source data
Extended Data Fig. 9
Extended Data Fig. 9. Brain-specific Treg expansion following PHP.CamKII-IL-2 treatment.
The CamKII promoter restricts gene expression (as assessed using GFP scoring) to neurons (NeuN positive) in adult mouse brain. Off-target expression was not detected when slices were counter-stained for GFAP (astrocytes). Left panel, hippocampus; right panel, cortex. Scale bar, 20 µm. Data are representative images seen in 1 slice from each of 4 independent mice receiving a PHP. CamKII-GFP (control) vector. b, Quantification of GFP colocalization with NeuN and GFAP in PHP.CamKII-GFP-treated mice. c, Levels of IL-2 were measured from tissue samples obtained from wildtype mice administered with 1×10⁹, 1×10¹⁰ or 1×10¹¹ total vector genomes of PHP.CamKII-GFP (control) or PHP. CamKII-IL-2 (n = 7,7,5,8,8,8). d, Wildtype mice were administered, intravenously, 1×10⁹, 1×10¹⁰ or 1×10¹¹ vector genomes (total dose) of PHP.CamKII-GFP or PHP.CamKII-IL-2 and assessed for the number of conventional T cells (left) and Treg cells (right), 14 days after treatment (n = 5 group) in the perfused brain or e spleen. f, Treg cells as a percentage of CD4 T cells in the brain and g spleen. Statistical analysis was performed using two-way ANOVA with Sidak correction. Source data
Extended Data Fig. 10
Extended Data Fig. 10. Transcriptional analysis following brain-specific delivery of IL-2 during TBI.
Wildtype mice, treated with PHP.GFAP-IL-2 (or PHP.GFAP-GFP control vector) on day -14 were given controlled cortical impacts to induce moderate TBI or sham surgery. 14 days post-TBI, T cells and microglia were sorted from the perfused brains for 10x single-cell transcriptomics. a, UMAP expression plot of T cell data, with expression patterns of CD3d, CD4, CD8, Foxp3, IL-2RA and Sel1 superimposed to identify various T cell populations. b, T cell UMAP representation, showing the relative numbers of various T cell types across treatment groups. c, Volcano plot showing differential gene expression in the CD4 Tconv cluster between PHP.GFAP-GFP and PHP.GFAP-IL-2-treated mice, for sham (left) and TBI (right). d, Volcano plot showing differential gene expression in the CD8 T cell cluster between PHP.GFAP-GFP and PHP.GFAP-IL-2-treated mice, for sham (left) and TBI (right). e, UMAP expression plot of microglia data, with differential expression patterns of Lpl, Cst7, Axl, Itgax, Spp1, Ccl6, Csf1 and H2-Aa shown. f, Volcano plot showing differential gene expression for total microglia between PHP.GFAP-GFP and PHP.GFAP-IL-2-treated mice, for sham (left) and TBI (right). g, Volcano plot showing differential gene expression for homeostatic microglia between PHP.GFAP-GFP and PHP.GFAP-IL-2-treated mice, for sham (left) and TBI (right). h, Filtered overview of KEGG pathways based on differential gene enrichment in microglia from PHP.GFAP-GFP and PHP.GFAP-IL-2-treated mice, for sham and TBI conditions. i, Pathview plot for ‘Antigen processing and presentation’ (KEGG mmu04612), using the average log-fold changes between the four differential gene expression comparisons indicated. n = 3/group for TBI and n = 1/group for sham. Statistical analyses were performed using negative binomial test for differential expression, using the standard analysis pipeline in Seurat (f, g).

Comment in

References

    1. Girgis F, Pace J, Sweet J, Miller JP. Hippocampal neurophysiologic changes after mild traumatic brain injury and potential neuromodulation treatment approaches. Front Syst. Neurosci. 2016;10:8. - PMC - PubMed
    1. Barres BA. The mystery and magic of glia: a perspective on their roles in health and disease. Neuron. 2008;60:430–440. - PubMed
    1. Dokalis N, Prinz M. Resolution of neuroinflammation: mechanisms and potential therapeutic option. Semin Immunopathol. 2019;41:699–709. - PubMed
    1. Gilhus NE, Deuschl G. Neuroinflammation—a common thread in neurological disorders. Nat. Rev. Neurol. 2019;15:429–430. - PubMed
    1. Pasciuto E, et al. Microglia require CD4 T cells to complete the fetal-to-adult transition. Cell. 2020;182:625–640 e624. - PMC - PubMed

Publication types