. 2022 Jul;28(7):1398-1405.
doi: 10.1038/s41591-022-01822-2. Epub 2022 May 26.

Performance of plasma phosphorylated tau 181 and 217 in the community

Affiliations

Performance of plasma phosphorylated tau 181 and 217 in the community

Michelle M Mielke et al. Nat Med. 2022 Jul.

Erratum in

Abstract

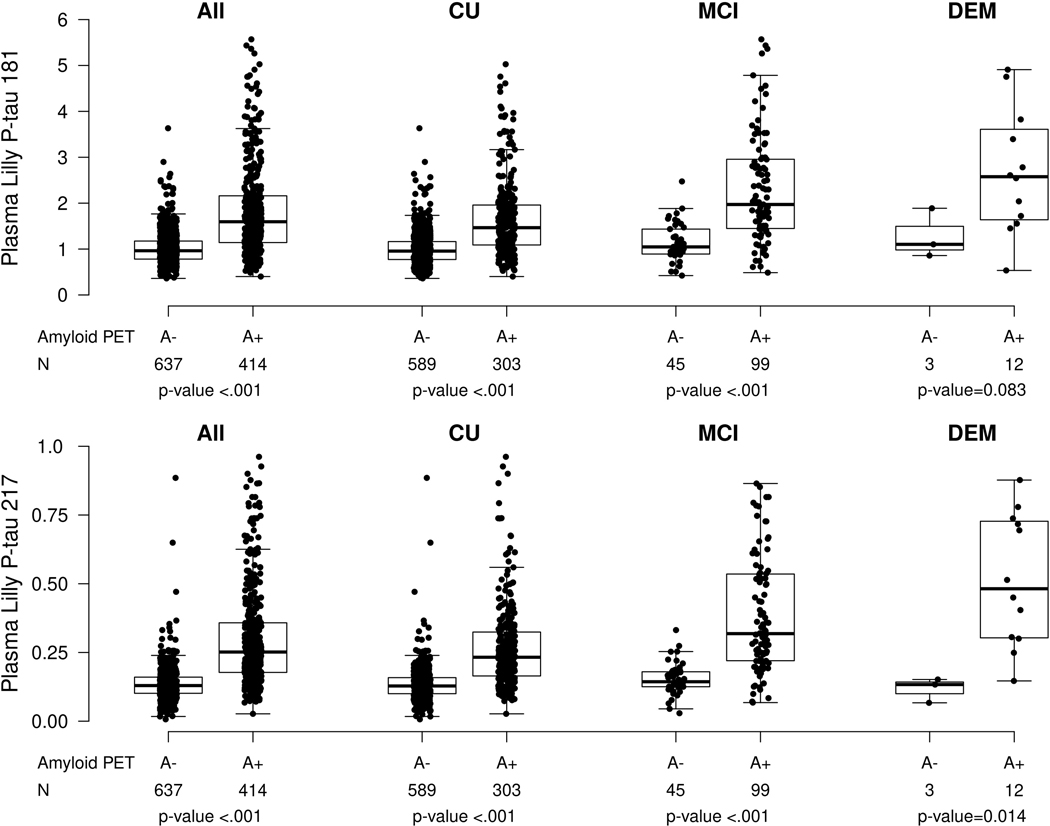
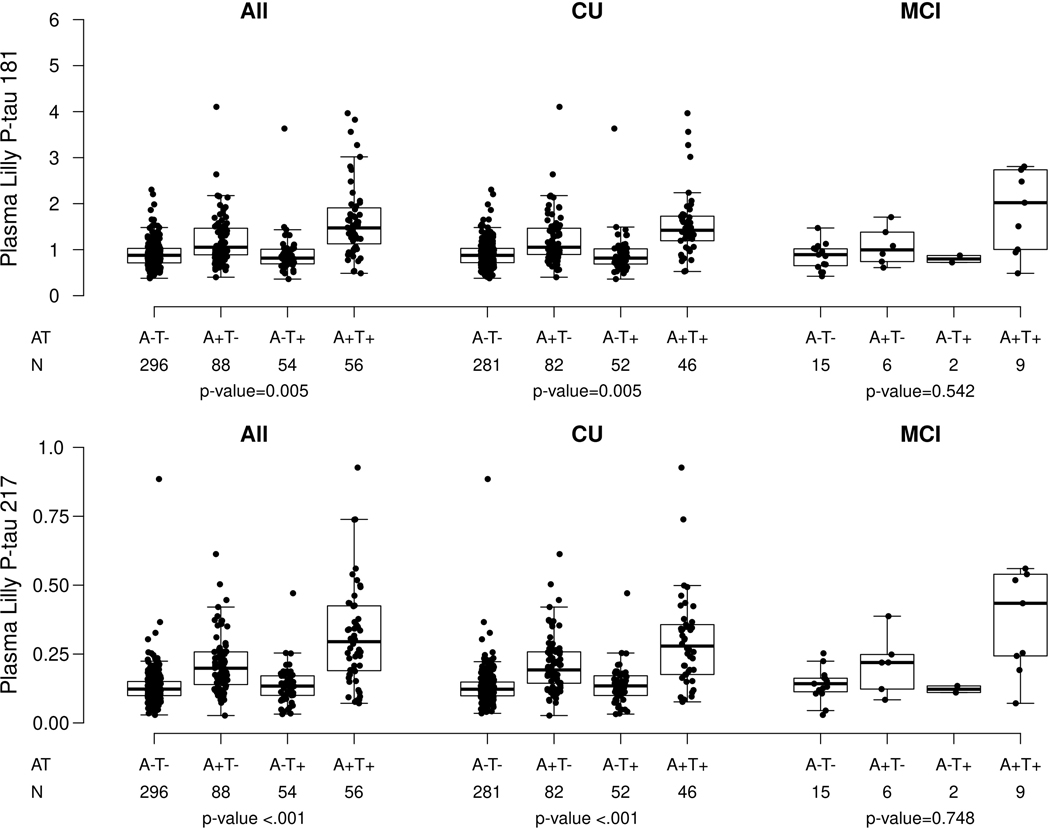
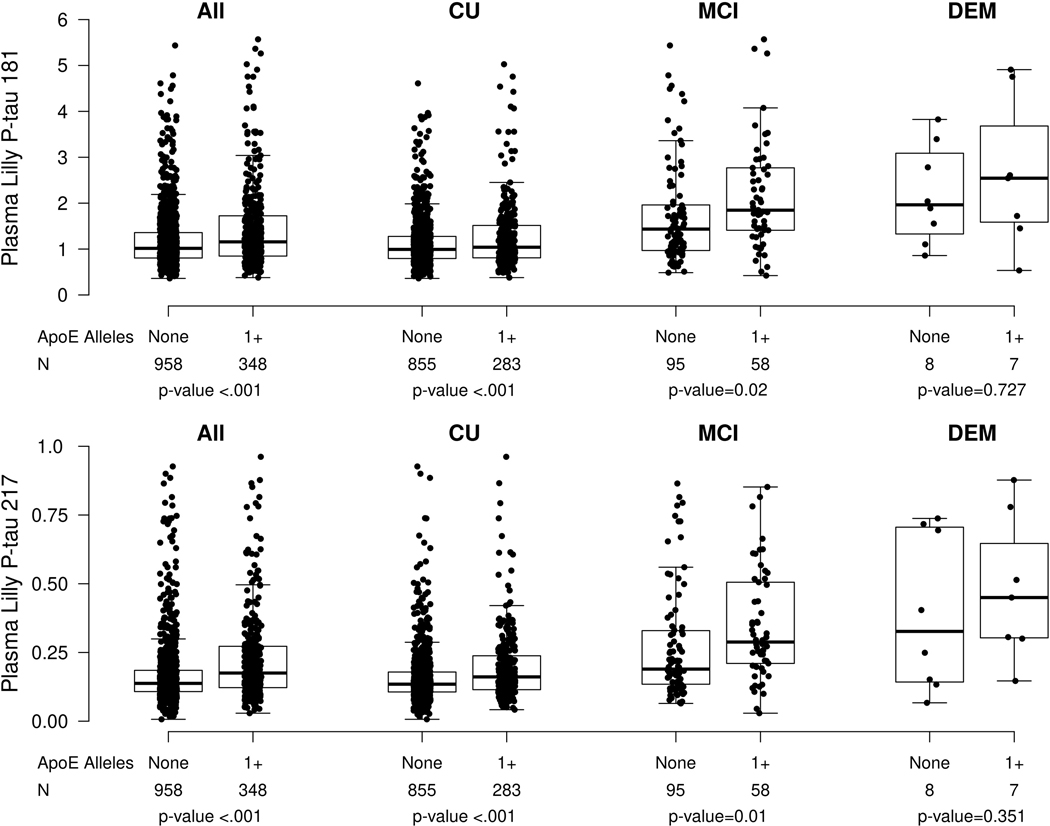
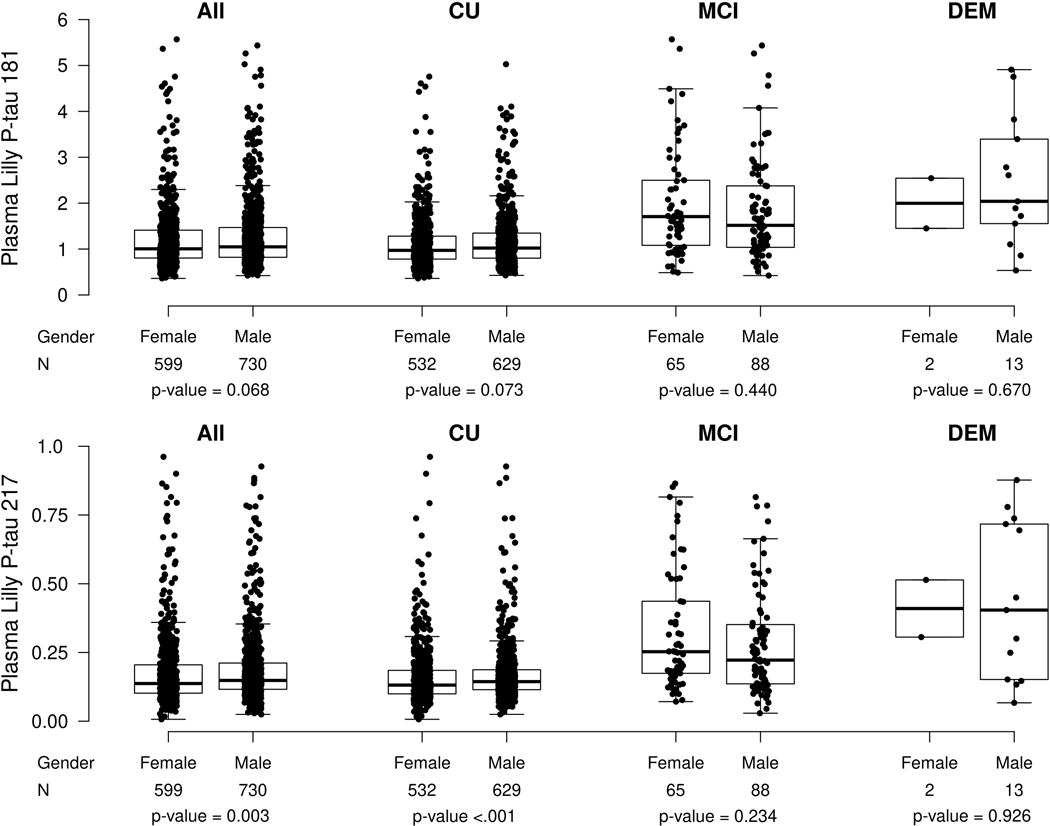
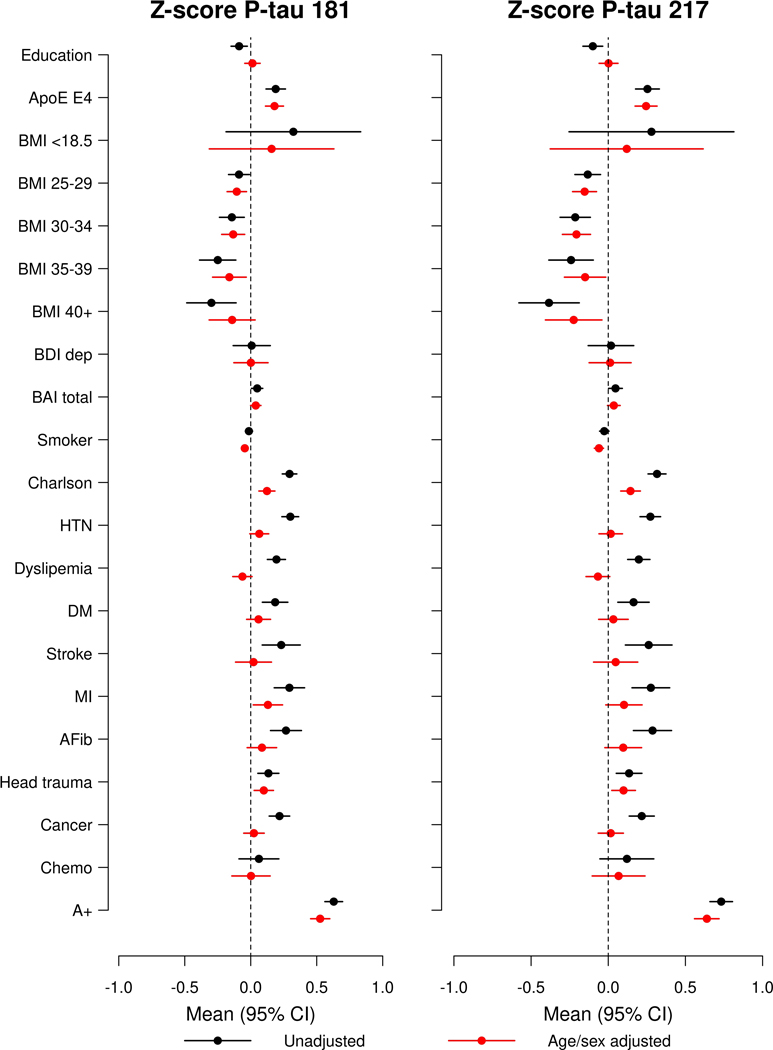
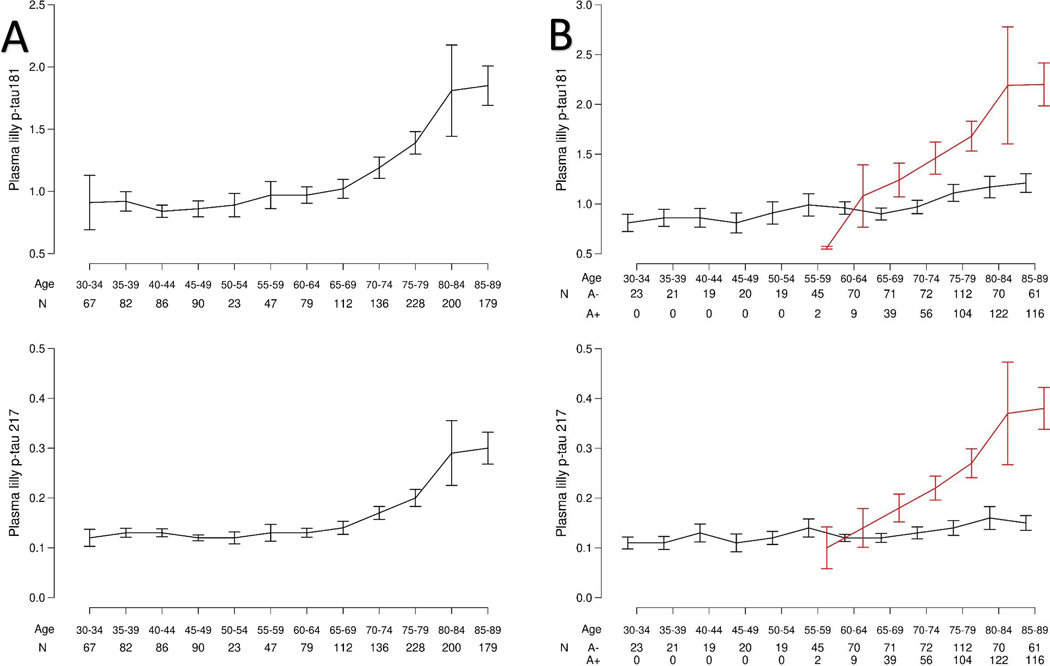
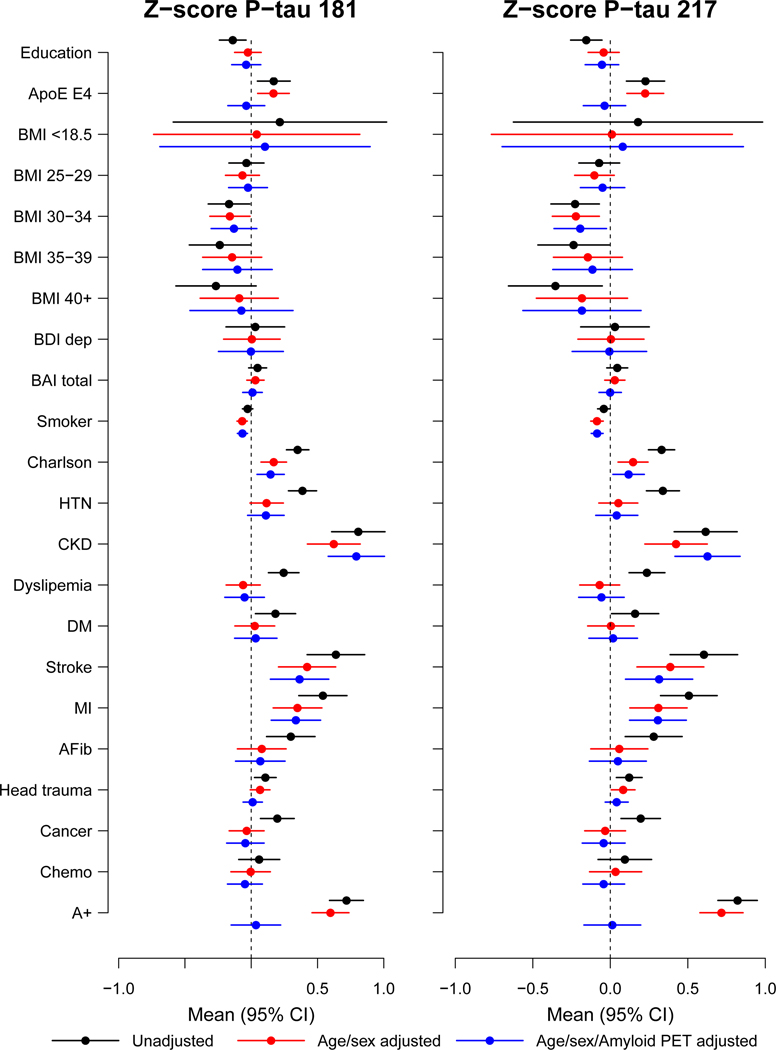
Plasma phosphorylated tau 181 (P-tau181) and 217 (P-tau217) are indicators of both amyloid and tau pathology in clinical settings, but their performance in heterogeneous community-based populations is unclear. We examined P-tau181 and P-tau217 (n = 1,329, aged 30-98 years), in the population-based Mayo Clinic Study of Aging. Continuous, unadjusted plasma P-tau181 and P-tau217 predicted abnormal amyloid positron-emission tomography (PET) (area under the receiver operating characteristic curve (AUROC) = 0.81-0.86) and tau PET entorhinal cortex (AUROC > 0.80), but was less predictive of a tau PET temporal region of interest (AUROC < 0.70). Multiple comorbidities were associated with higher plasma P-tau181 and P-tau217 levels; the difference between participants with and without chronic kidney disease (CKD) was similar to the difference between participants with and without elevated brain amyloid. The exclusion of participants with CKD and other comorbidities affected the establishment of a normal reference range and cutpoints. Understanding the effect of comorbidities on P-tau181 and P-tau217 levels is important for their future interpretation in the context of clinical screening, diagnosis or prognosis at the population level.


Figures

Extended Data Fig. 1
Extended Data Fig. 1. Plasma P-tau181 and P-tau217 levels by clinical diagnosis and amyloid PET status.
Abnormal amyloid PET (A+) was defined as standard uptake value ratio (SUVR)>1.48 using PiB-PET. P-values are from two-sided Wilcoxon rank-sum tests without adjustment for multiple comparisons. Box plots display the median, 25th percentile, 75th percentile (middle, bottom, and top bars of the box), and the whiskers go out to 1.5 times the interquartile range (75th percentile – 25th percentile) from the 25th and 75th percentile. CU, cognitively unimpaired; MCI, mild cognitive impairment; DEM, dementia.
Extended Data Fig. 2
Extended Data Fig. 2. Plasma P-tau181 and P-tau217 levels by clinical diagnosis and amyloid and tau PET status.
Abnormal amyloid PET (A+) was defined as standard uptake value ratio (SUVR)>1.48 using PiB-PET. Abnormal tau PET (T+) meta region of interest (ROI) was defined as standard uptake value ratio (SUVR)≥1.29 using AV1451, and included the amygdala, entorhinal cortex, fusiform, parahippocampal, and inferior temporal and middle temporal gyri. P-values are from two-sided Kruskal-Wallis tests. Box plots display the median, 25th percentile, 75th percentile (middle, bottom, and top bars of the box), and the whiskers go out to 1.5 times the interquartile range (75th percentile – 25th percentile) from the 25th and 75th percentile. CU, cognitively unimpaired; MCI, mild cognitive impairment.
Extended Data Fig. 3
Extended Data Fig. 3. Plasma P-tau181 and P-tau217 levels by presence of an APOE ε4 allele.
P-values are from two-sided Wilcoxon rank-sum tests without adjustment for multiple comparisons. Box plots display the median, 25th percentile, 75th percentile (middle, bottom, and top bars of the box), and the whiskers go out to 1.5 times the interquartile range (75th percentile – 25th percentile) from the 25th and 75th percentile. CU, cognitively unimpaired; MCI, mild cognitive impairment; DEM, dementia.
Extended Data Fig. 4
Extended Data Fig. 4. Plasma P-tau181 and P-tau217 levels by sex.
P-values are from two-sided Wilcoxon rank-sum tests without adjustment for multiple comparisons. Box plots display the median, 25th percentile, 75th percentile (middle, bottom, and top bars of the box), and the whiskers go out to 1.5 times the interquartile range (75th percentile – 25th percentile) from the 25th and 75th percentile. CU, cognitively unimpaired; MCI, mild cognitive impairment; DEM, dementia.
Extended Data Fig. 5
Extended Data Fig. 5. Forest plots of associations between multiple factors and plasma P-tau181 and P-tau217 levels using linear regression after excluding all participants with chronic kidney disease (N=1231).
Black lines indicate univariable associations and red lines indicate associations after adjustment for age and sex. Means and 95% confidence intervals are provided. A+, Elevated amyloid PET; AFib, atrial fibrillation; BAI total, Beck Anxiety Inventory; BDI dep, Beck Depression Inventory; BMI, body mass index; Chemo, chemotherapy for those with a cancer diagnosis; CKD, chronic kidney disease; DM, diabetes mellitus; HTN, hypertension; MI, myocardial infarction.
Fig. 1.
Fig. 1.. Plasma P-tau181 and P-tau217 levels by age.
Fig. 1A shows the plasma P-tau181 and −217 levels by age alone. Fig. 1B shows the plasma P-tau181 and −217 levels by age and elevated brain amyloid based on PiB-PET>1.48 standard uptake value ratio. Black indicates A− and red indicates A+. Data are presented as mean values +/− Standard error of the mean (SEM).
Fig. 2.
Fig. 2.. Forest plots of associations between multiple factors and plasma P-tau181 and P- tau217 using linear regression among all participants (N=1329 unique biological participants).
Black lines indicate univariable associations, red lines indicate associations after adjustment for age and sex, and blue lines indicate associations after adjustment for age, sex, and amyloid PET. Means and 95% confidence intervals are provided. A+, Elevated amyloid PET; AFib, atrial fibrillation; BAI total, Beck Anxiety Inventory; BDI dep, Beck Depression Inventory; BMI, body mass index; Chemo, chemotherapy for those with a cancer diagnosis; CKD, chronic kidney disease; DM, diabetes mellitus; HTN, hypertension; MI, myocardial infarction.

Comment in

References

    1. Mielke MM et al. Plasma phospho-tau181 increases with Alzheimer’s disease clinical severity and is associated with tau- and amyloid-positron emission tomography. Alzheimers Dement. 14, 989–997 (2018). - PMC - PubMed
    1. Janelidze S. et al. Plasma P-tau181 in Alzheimer’s disease: relationship to other biomarkers, differential diagnosis, neuropathology and longitudinal progression to Alzheimer’s dementia. Nat. Med 26, 379–386 (2020). - PubMed
    1. Karikari TK et al. Blood phosphorylated tau 181 as a biomarker for Alzheimer’s disease: a diagnostic performance and prediction modelling study using data from four prospective cohorts. Lancet Neurol 19, 422–433 (2020). - PubMed
    1. Thijssen EH et al. Diagnostic value of plasma phosphorylated tau181 in Alzheimer’s disease and frontotemporal lobar degeneration. Nat. Med 26, 387–397 (2020). - PMC - PubMed
    1. Palmqvist S. et al. Discriminative accuracy of plasma phospho-tau217 for Alzheimer disease vs other neurodegenerative disorders. JAMA 324, 772–781 (2020). - PMC - PubMed

Publication types