. 2022 Jun;54(6):817-826.
doi: 10.1038/s41588-022-01066-3. Epub 2022 May 26.

Immune disease risk variants regulate gene expression dynamics during CD4+ T cell activation

Affiliations

Immune disease risk variants regulate gene expression dynamics during CD4+ T cell activation

Blagoje Soskic et al. Nat Genet. 2022 Jun.

Abstract

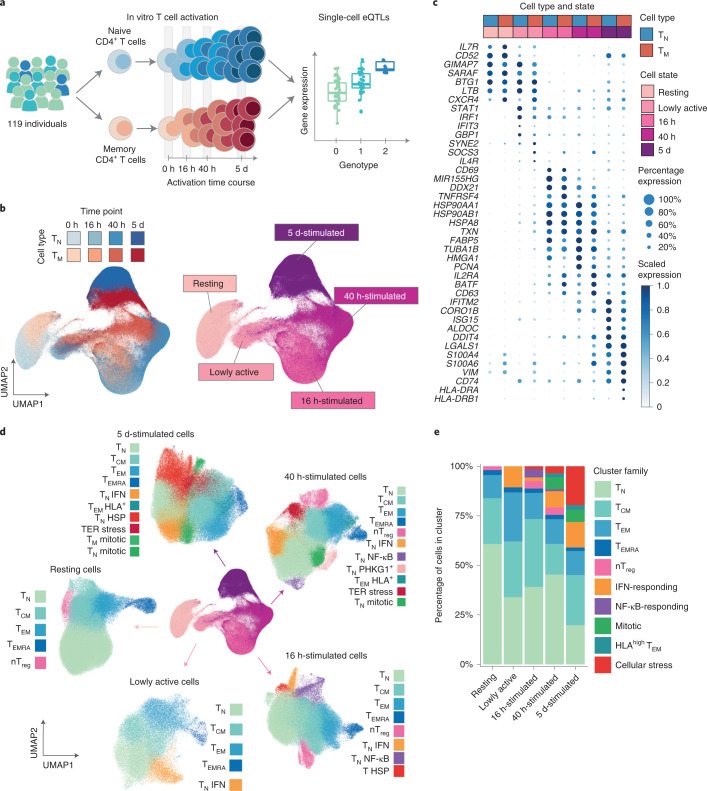
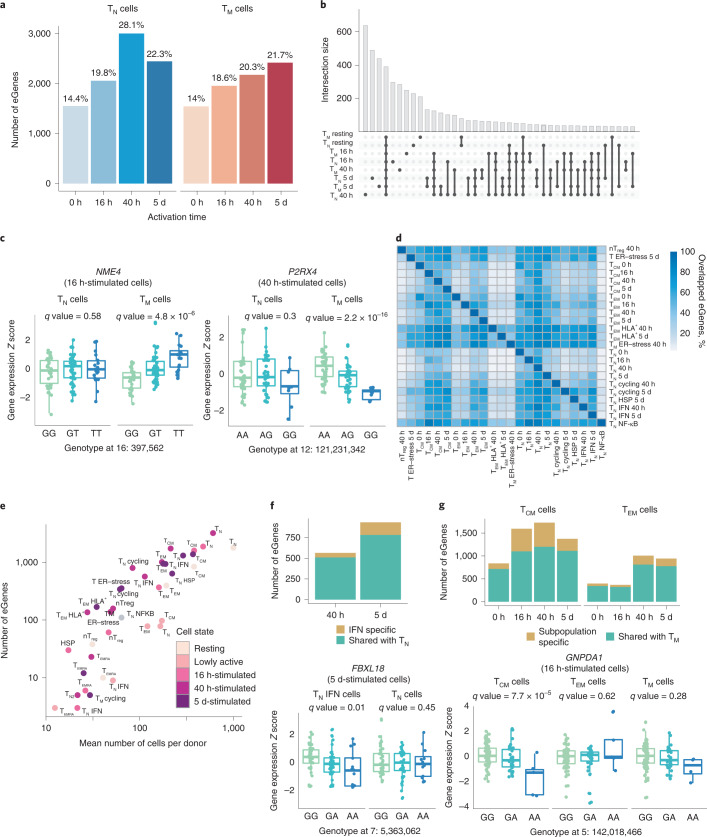
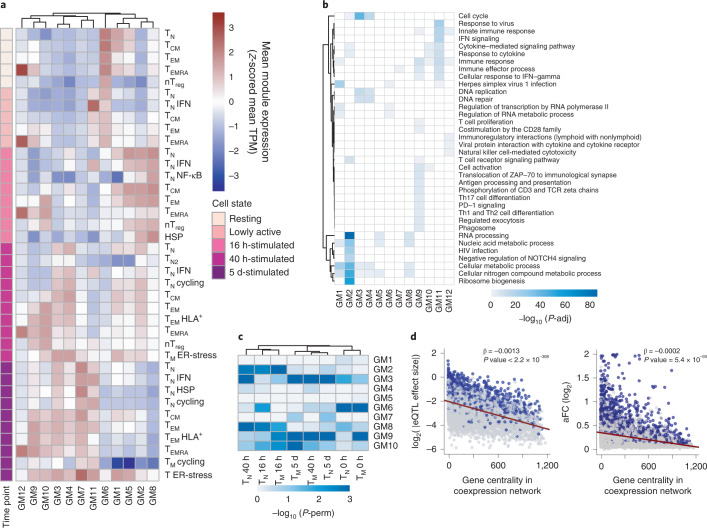
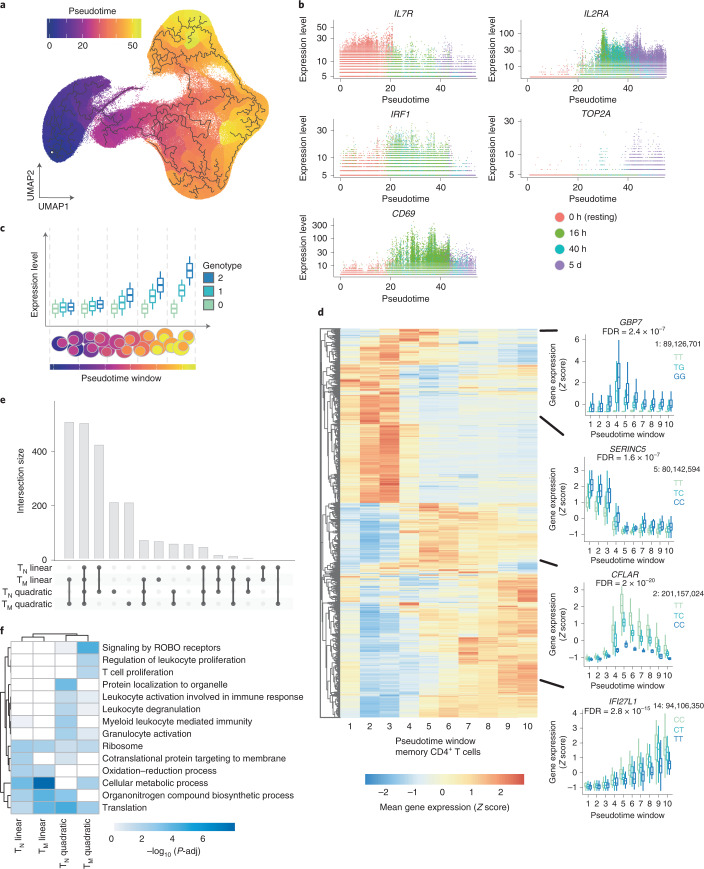
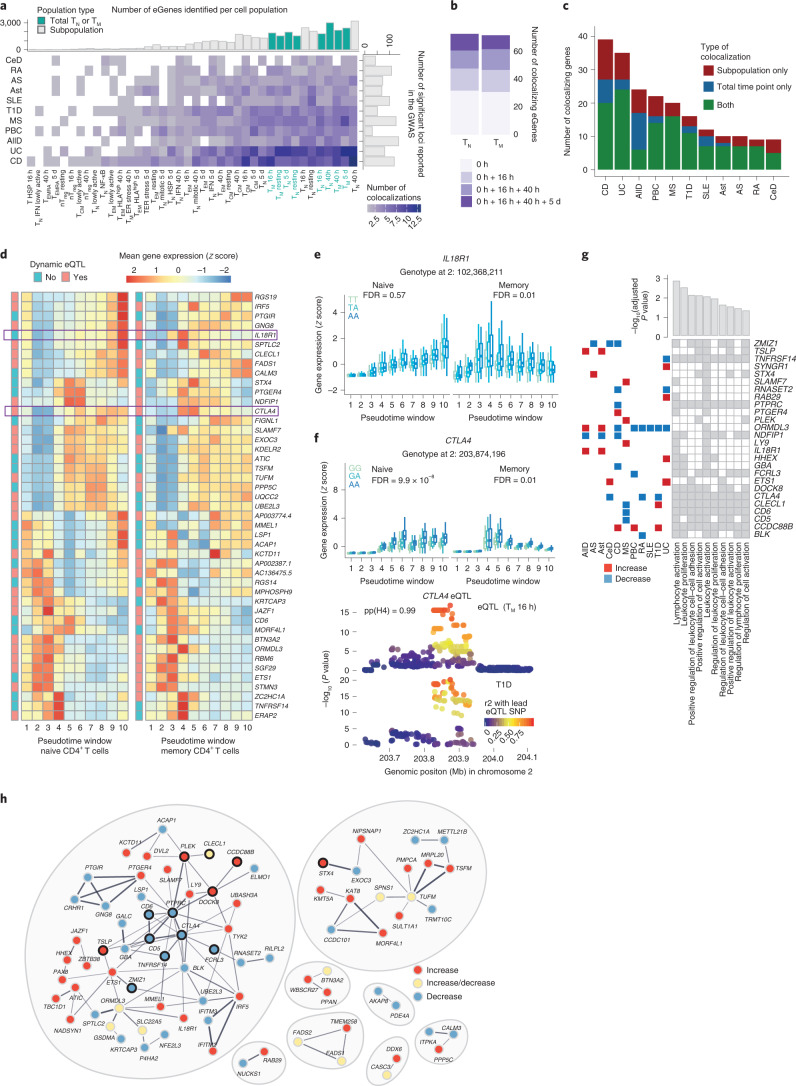
During activation, T cells undergo extensive gene expression changes that shape the properties of cells to exert their effector function. Understanding the regulation of this process could help explain how genetic variants predispose to immune diseases. Here, we mapped genetic effects on gene expression (expression quantitative trait loci (eQTLs)) using single-cell transcriptomics. We profiled 655,349 CD4+ T cells, capturing transcriptional states of unstimulated cells and three time points of cell activation in 119 healthy individuals. This identified 38 cell clusters, including transient clusters that were only present at individual time points of activation. We found 6,407 genes whose expression was correlated with genetic variation, of which 2,265 (35%) were dynamically regulated during activation. Furthermore, 127 genes were regulated by variants associated with immune-mediated diseases, with significant enrichment for dynamic effects. Our results emphasize the importance of studying context-specific gene expression regulation and provide insights into the mechanisms underlying genetic susceptibility to immune-mediated diseases.


Conflict of interest statement

All authors declare no competing interests.

Figures

Fig. 1
Fig. 1. A single-cell transcriptional map of CD4+ T cell activation.
a, Schematic of the study design. b, UMAP embedding of scRNA-seq data for unstimulated CD4+ T cells and at three time points after activation. Colors represent cell types (blue, naive T cell (TN); red, memory T cell (TM)), and shades of colors indicate time points (lighter shades for early time points and darker shades for late time points). Right panel represents the five broad cell states. c, Dot plot of highly variable gene expression throughout T cell activation. Shades of blue represent average expression in each cell population, and dot sizes represent the proportion of cells expressing the gene. d, Separate UMAP embeddings for the five broad cell states. Colors represent cell populations derived from unsupervised clustering. e, Proportion of different cluster groups present at each time point. Cell populations defined from clustering were classified into one of ten families, represented in different colors. ER, endoplasmic reticulum; HLA, human leukocyte antigen; HSP, heat shock protein; NF-κB, nuclear factor κB; nTreg, natural (i.e. thymus-derived) regulatory T cells.
Fig. 2
Fig. 2. eQTL mapping in resting and activated CD4+ T cells.
a, Number of significant eGenes detected at each activation time point. Colors represent cell types (blue, TN; red, TM). b, Number of significant eGenes shared between cells sampled at each time point. c, Example of T memory cell-specific eQTLs detected at 16 h and 40 h. Box plots show mean expression value of the gene in each sample (Z-scored), stratified by genotype at the genomic position of the lead eQTL variant (X axis). Each dot represents a measurement from a separate individual. Central lines indicate the median, with boxes extending from the 25th to the 75th percentiles. Whiskers further extend by ±1.5 times the interquartile range from the limits of each box. N of biologically independent samples: TN NME4: 99, TM NME4: 96, TN P2RX4: 89, TM P2RX4: 89. P values were derived using tensorQTL and corrected as described in Methods. d, Pairwise comparison of eGenes shared between cell subpopulation. Only subpopulations with >100 eGenes were analyzed. e, Scatter plot showing the correlation between number of cells per donor and number of detected eGenes in each cluster. f, Subpopulation-specific eQTLs detected in IFN-responsive clusters. Bar plot (top) indicates the number of eGenes detected in the IFN-responsive subpopulation that are shared with naive T cells as a whole. Boxplots (bottom) show an example eQTL specific to this subpopulation. Each dot represents a measurement from a separate individual. Central lines indicate the median, with boxes extending from the 25th to the 75th percentiles. Whiskers further extend by ±1.5 times the interquartile range from the limits of each box. N of biologically independent samples: TN IFN FBXL18: 96, TN FBXL18: 87, P values were derived using tensorQTL and corrected as described in Methods. g, Number of subpopulation-specific eQTLs detected in TCM and TEM cells. Bar plots (top) indicate numbers of eGenes detected in TCM and TEM subpopulations that are shared with memory T cells as a whole. Boxplots (bottom) show an example eQTL specific to the TCM subpopulation. Each dot represents a measurement obtained from a separate individual. Central lines indicate the median, with boxes extending from the 25th to the 75th percentiles. Whiskers further extend by ±1.5 times the interquartile range from the limits of each box. N of biologically independent samples: TCM GNPDA1: 100, TEM GNPDA1: 103, TM GNPDA1: 97. P values were derived using tensorQTL and corrected as described in Methods. ER, endoplasmic reticulum; nTreg, natural regulatory T cells.
Fig. 3
Fig. 3. eQTLs are enriched in proliferation and immune response gene modules.
a, Heatmap showing the expression pattern of the 12 identified gene modules. Rows correspond to cell subpopulations. Colors represent the scaled (Z-scored) average expression of all genes belonging to a module in a given subpopulation. Gene coexpression network was built using weighted gene coexpression network analysis to identify gene modules. TPM, transcripts per million. b, Pathways enriched in each gene module (GM). Shades of blue represent the log10-transformed enrichment P values. c, Enrichment of eGenes in gene modules. Shades of blue represent log10-transformed P values. P values were estimated by repeatedly permuting group labels and quantifying the proportion of times an enrichment equal to or larger than the observed one was obtained. P-perm, permutation P value. d, Relationship between a gene’s connectivity and the effect size of its lead eQTL variant (left) or allelic fold change (right). All eQTL effect sizes were log2 transformed. Blue dots represent significant eGenes, whereas gray dots represent genes that do not pass the multiple testing correction. Lines represent the best linear fits obtained from linear regression. P values were estimated by testing the null hypothesis of zero intercepts using an F test. P-adj, adjusted P value.
Fig. 4
Fig. 4. eQTLs with dynamic effects during CD4+ T cell activation.
a, Cells were ordered into a branched pseudotime trajectory using monocle3. The UMAP embedding shows all cells, colored by their estimated pseudotime values. Black lines indicate the inferred branched trajectory. b, Example genes that significantly change as a function of activation pseudotime. Each dot corresponds to a cell, and colors represent experimental time points. c, Schematic of the analysis approach. Cells were split into ten windows of equal cell numbers according to their estimated pseudotime values. Linear and quadratic mixed models were applied to each previously identified eGene to test for an interaction between genotypes and T cell activation pseudotime. d, Heatmap showing the expression pattern of each dynamic eGene in memory T cells. Boxplots show examples of nonlinear and linear dynamic eQTLs. The average expression of the gene within each pseudotime window was stratified by genotype. Central lines indicate the median, with boxes extending from the 25th to the 75th percentiles. Whiskers further extend by ±1.5 times the interquartile range from the limits of each box. N of biologically independent samples: 106. P values were derived and corrected as described in Methods. e, Number of eGenes with evidence of a significant genotype–pseudotime interaction (i.e., dynamic eQTLs) in a linear or quadratic mixed model. f, Pathways enriched in linear and quadratic eGenes. Shades of blue represent log10-transformed enrichment P values. Enrichment P values were estimated using a hypergeometric test, and multiple testing correction was performed using the set counts and sizes (SCS) method, as implemented in gprofiler2 version 0.2.0. FDR, false discovery rate. ROBO, roundabout receptors.
Fig. 5
Fig. 5. Colocalization of CD4+ T cell eQTLs with GWAS associations for immune diseases.
a, Number of significant colocalizations between an eQTL and a GWAS signal identified for each cell type–trait combination. Marginal bar plots represent the number of independent associations reported in the GWAS (x axis) and the number of eGenes detected per subpopulation (y axis). Light and dark bars indicate whole-cell populations (TN or TM cells at a specific time point) and subpopulations, respectively. b, Number of additional colocalizing genes detected in stimulated cells. c, Number of colocalizing genes observed in whole-cell populations, subpopulations or both. d, Heatmap showing the expression pattern of colocalizing eGenes in naive and memory T cells. The color of annotation boxes shows genes that are dynamic and static eQTLs. e, Boxplot shows IL18R1 dynamic eQTLs. The average expression of the gene within each pseudotime window was stratified by genotype. Central lines indicate the median, with boxes extending from the 25th to the 75th percentiles. Whiskers further extend by ±1.5 times the interquartile range from the limits of each box. N of biologically independent samples: 106. P values were derived and corrected as described in Methods. f, Boxplot shows CTLA4 dynamic eQTLs. The average expression of the gene within each pseudotime window was stratified by genotype. Locus plot for a colocalization between a CTLA4 dynamic eQTL and a GWAS association for type 1 diabetes. Each dot represents a variant, with colors indicating their linkage disequilibrium with the lead eQTL variant. Central lines indicate the median, with boxes extending from the 25th to the 75th percentiles. Whiskers further extend by ±1.5 times the interquartile range from the limits of each box. N of biologically independent samples: 106. P values were derived and corrected as described in Methods. g, Tile plot shows enriched pathways within colocalizing genes as well as genes driving the enrichment. Bar plots show adjusted P values from the enrichment test. Squares on left show the colocalizing disease. Red, disease variant increases gene expression; blue, variant decreases gene expression. h, STRING network of colocalizing genes. Red, disease variant increases gene expression; blue, decreases; yellow, effect on gene expression is disease dependent. Black outline highlights genes belonging to the top enriched pathway (GO.0050867: positive regulation of cell activation). GWAS abbreviations: AllD, allergic disease; AS, ankylosing spondylitis; Ast, asthma; CeD, celiac disease; CD, Crohn’s disease; MS, multiple sclerosis; PBC, primary biliary cirrhosis; RA, rheumatoid arthritis; SLE, systemic lupus erythematosus; T1D, type 1 diabetes; UC, ulcerative colitis.

References

    1. Dendrou CA, et al. Resolving TYK2 locus genotype-to-phenotype differences in autoimmunity. Sci. Transl. Med. 2016;8:363ra149. doi: 10.1126/scitranslmed.aag1974. - DOI - PMC - PubMed
    1. Trynka G, et al. Chromatin marks identify critical cell types for fine mapping complex trait variants. Nat. Genet. 2013;45:124–130. doi: 10.1038/ng.2504. - DOI - PMC - PubMed
    1. Nasser J, et al. Genome-wide enhancer maps link risk variants to disease genes. Nature. 2021;593:238–243. doi: 10.1038/s41586-021-03446-x. - DOI - PMC - PubMed
    1. Giambartolomei C, et al. Bayesian test for colocalisation between pairs of genetic association studies using summary statistics. PLoS Genet. 2014;10:e1004383. doi: 10.1371/journal.pgen.1004383. - DOI - PMC - PubMed
    1. Cuomo ASE, et al. Single-cell RNA-sequencing of differentiating iPS cells reveals dynamic genetic effects on gene expression. Nat. Commun. 2020;11:810. doi: 10.1038/s41467-020-14457-z. - DOI - PMC - PubMed

Publication types

MeSH terms

LinkOut - more resources