. 2022 Jun;54(6):874-884.
doi: 10.1038/s41588-022-01076-1. Epub 2022 May 26.

Dual function NFI factors control fetal hemoglobin silencing in adult erythroid cells

Affiliations

Dual function NFI factors control fetal hemoglobin silencing in adult erythroid cells

Kunhua Qin et al. Nat Genet. 2022 Jun.

Erratum in

Abstract

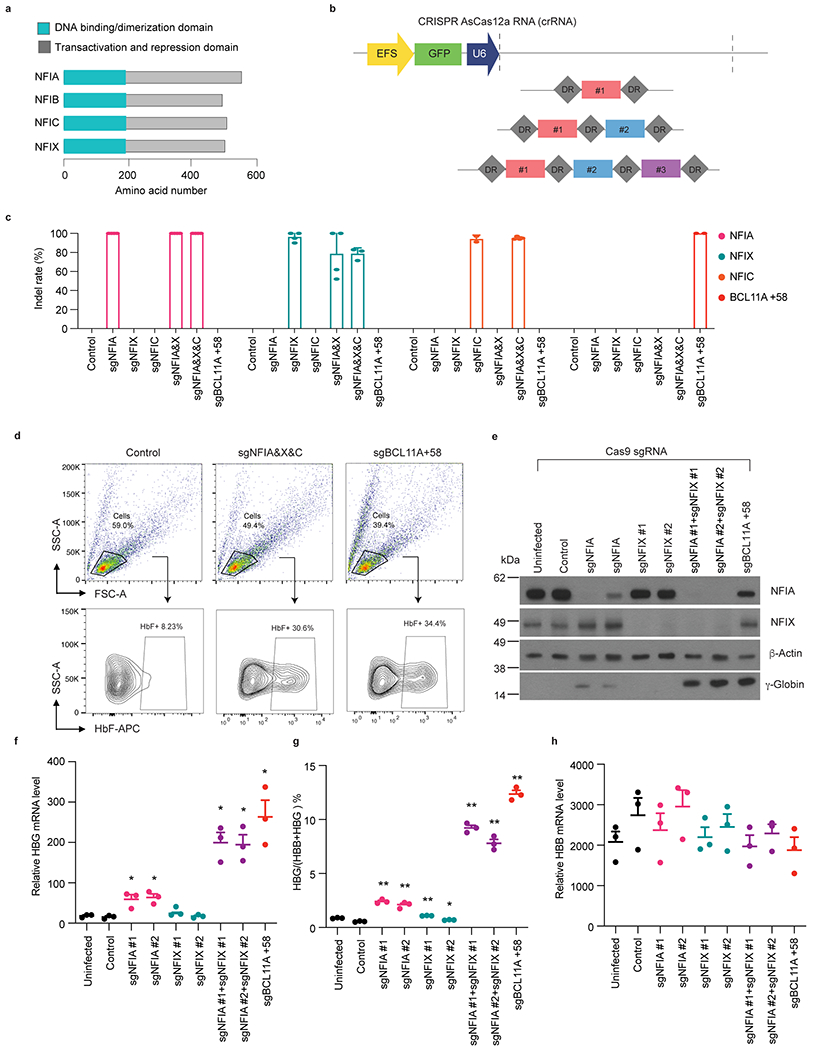
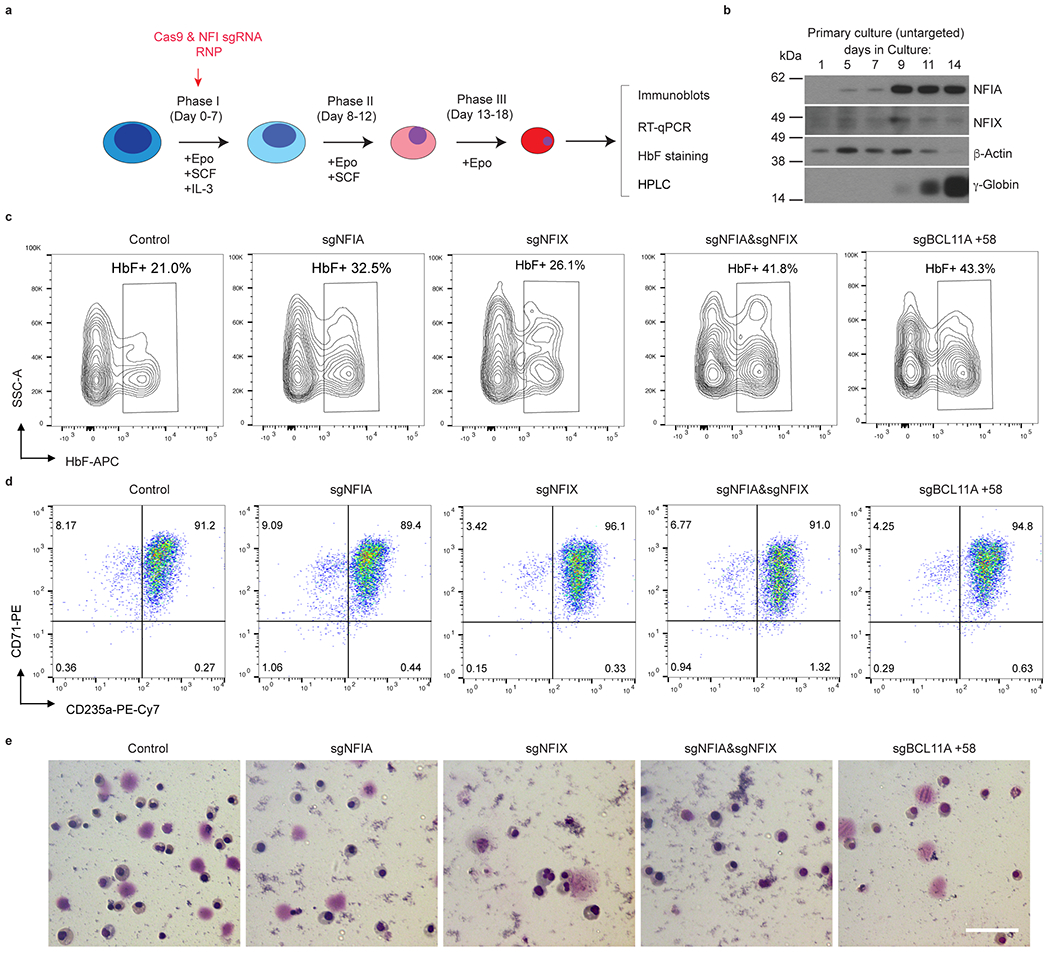
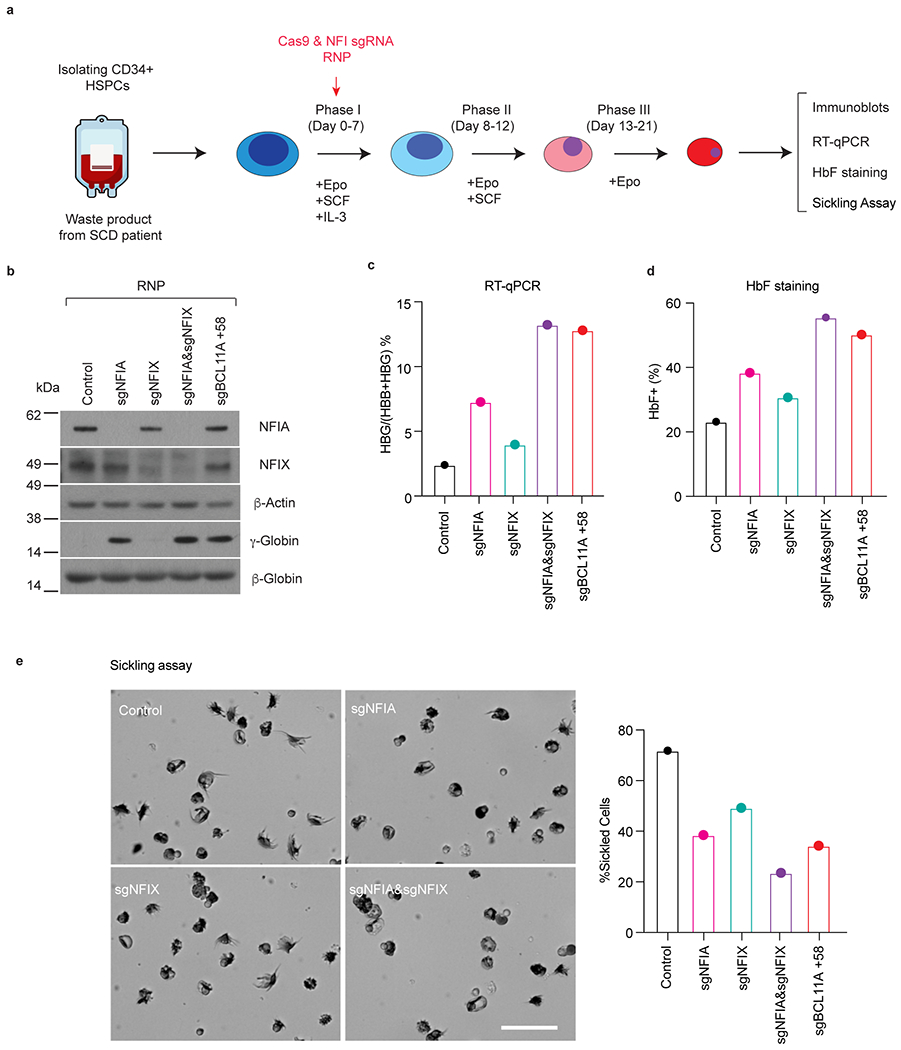
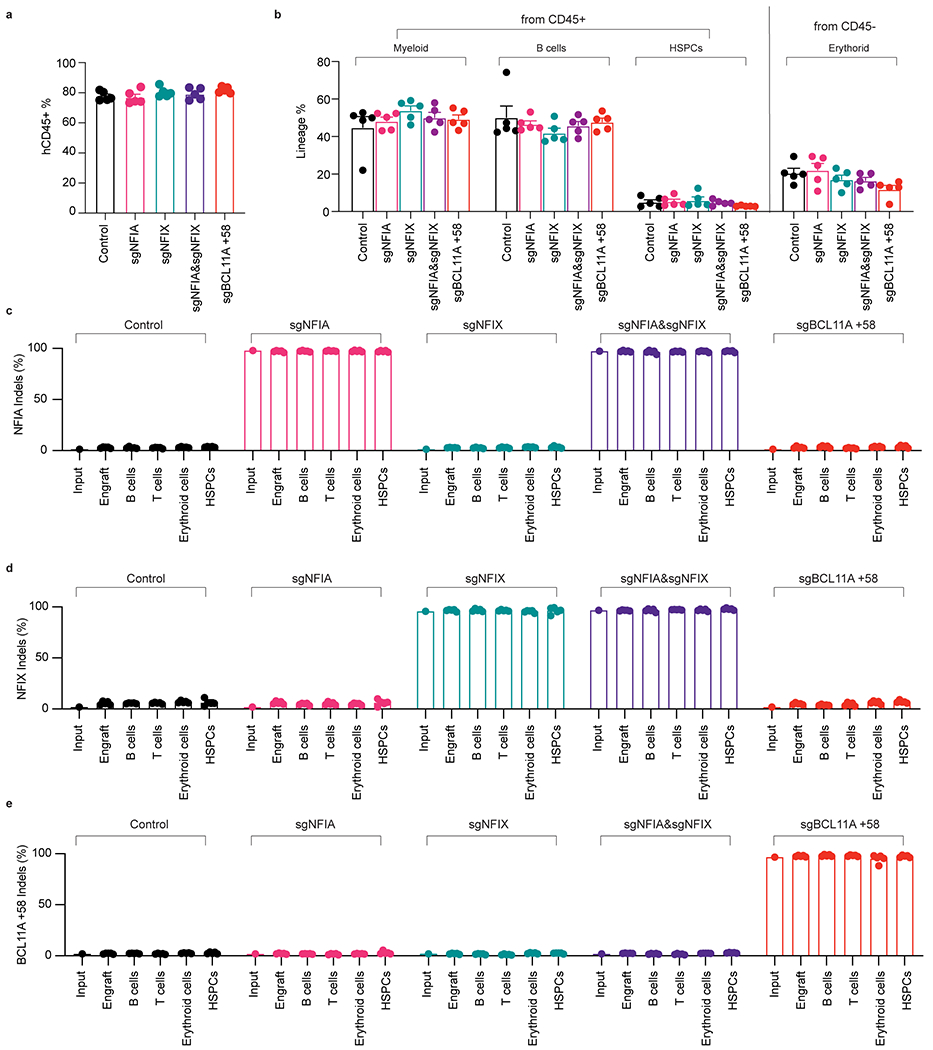
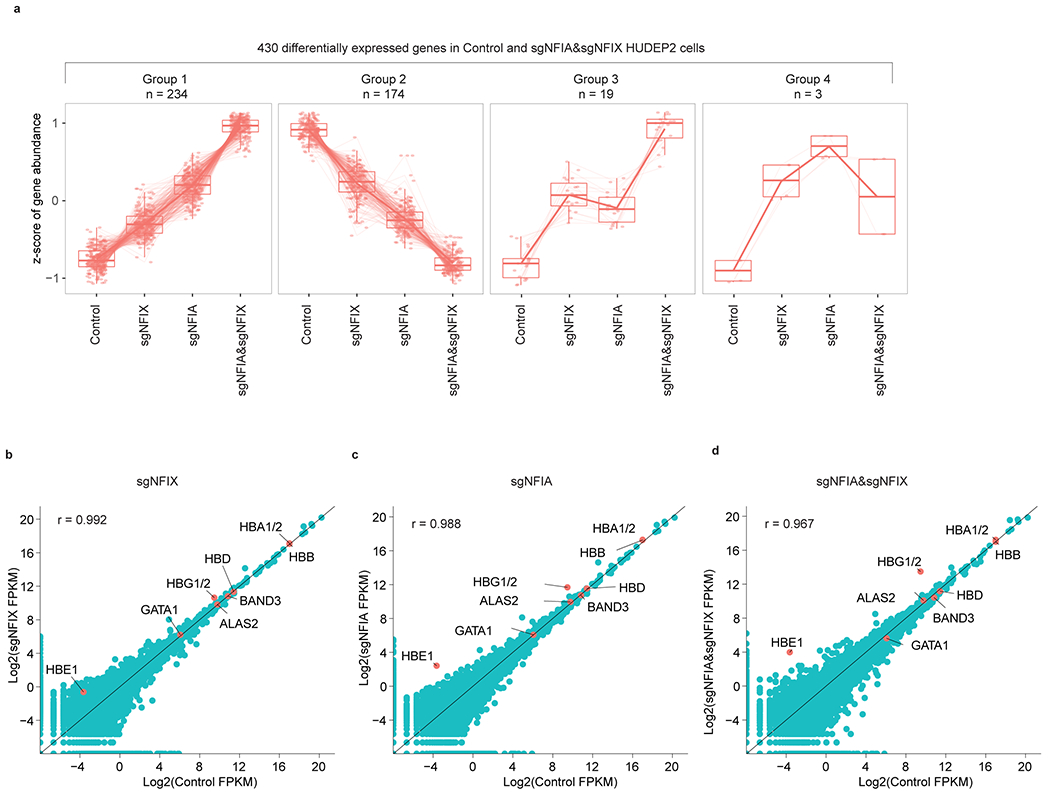
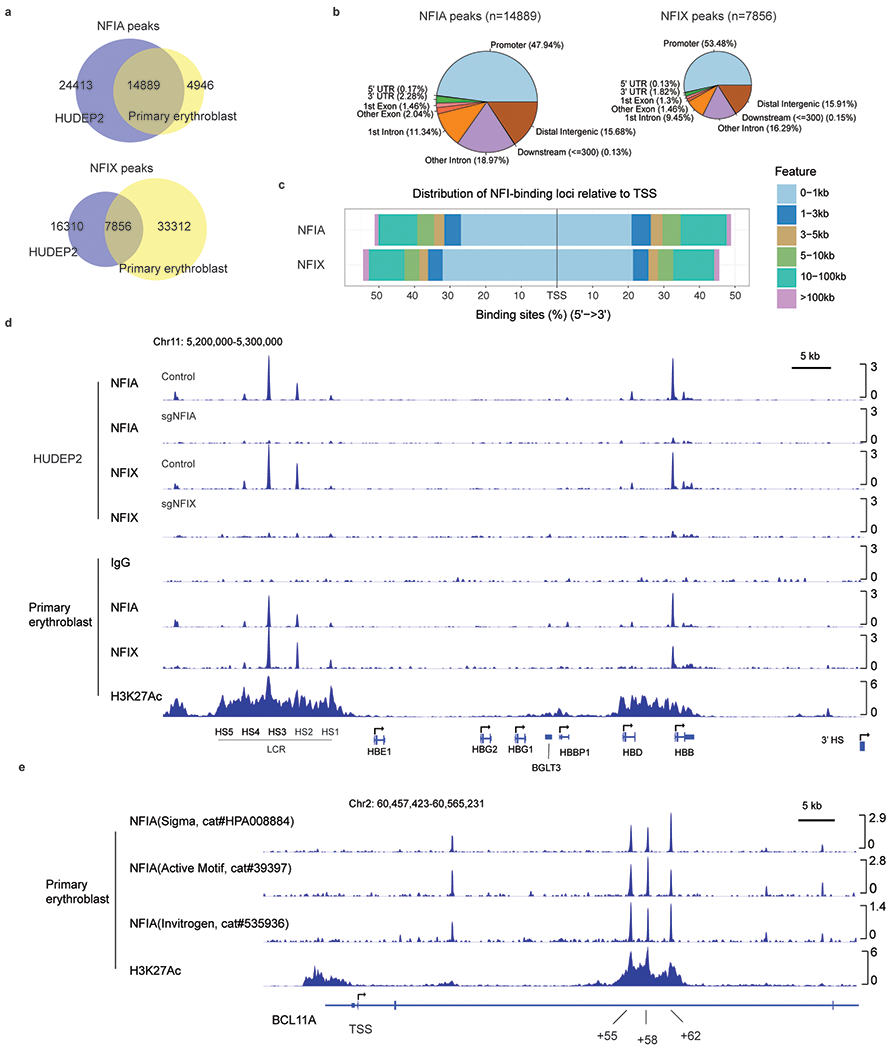
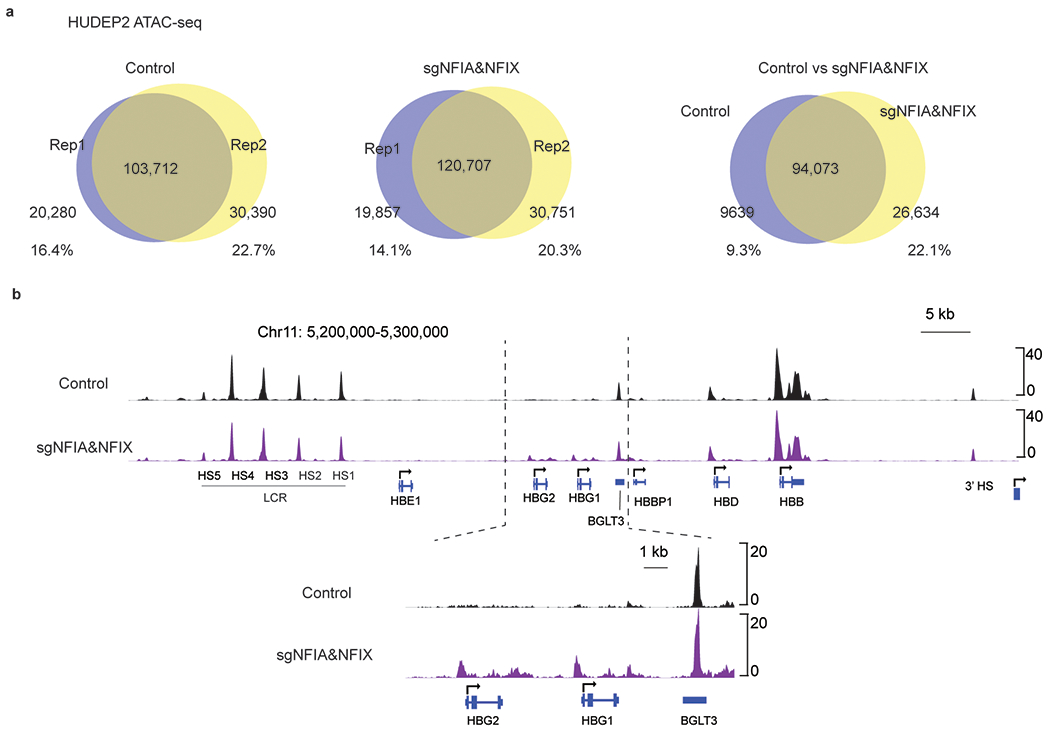
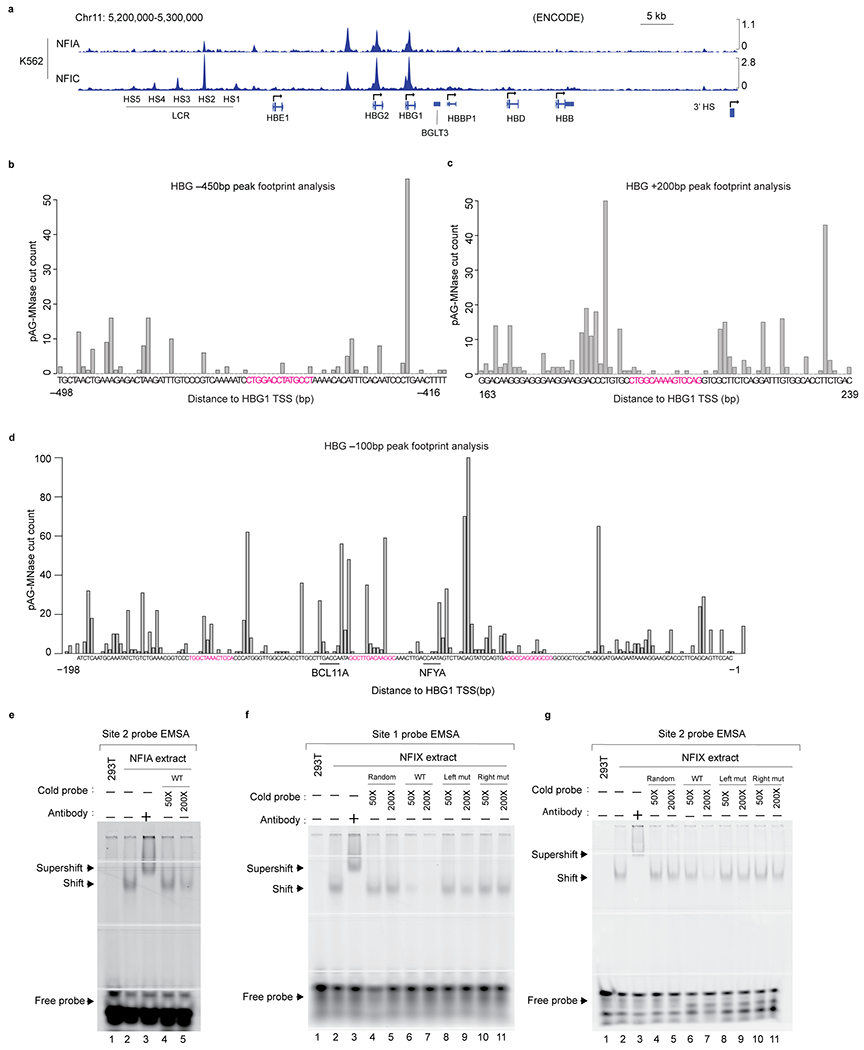
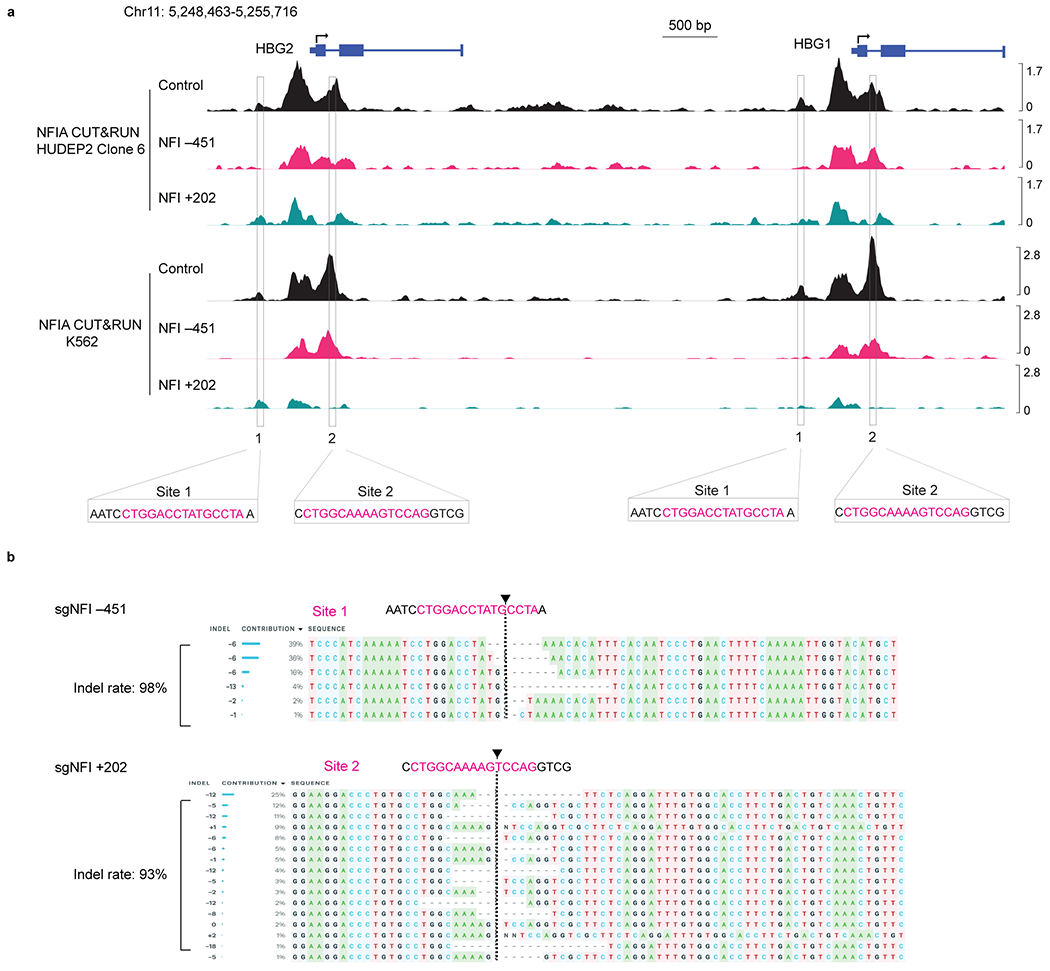
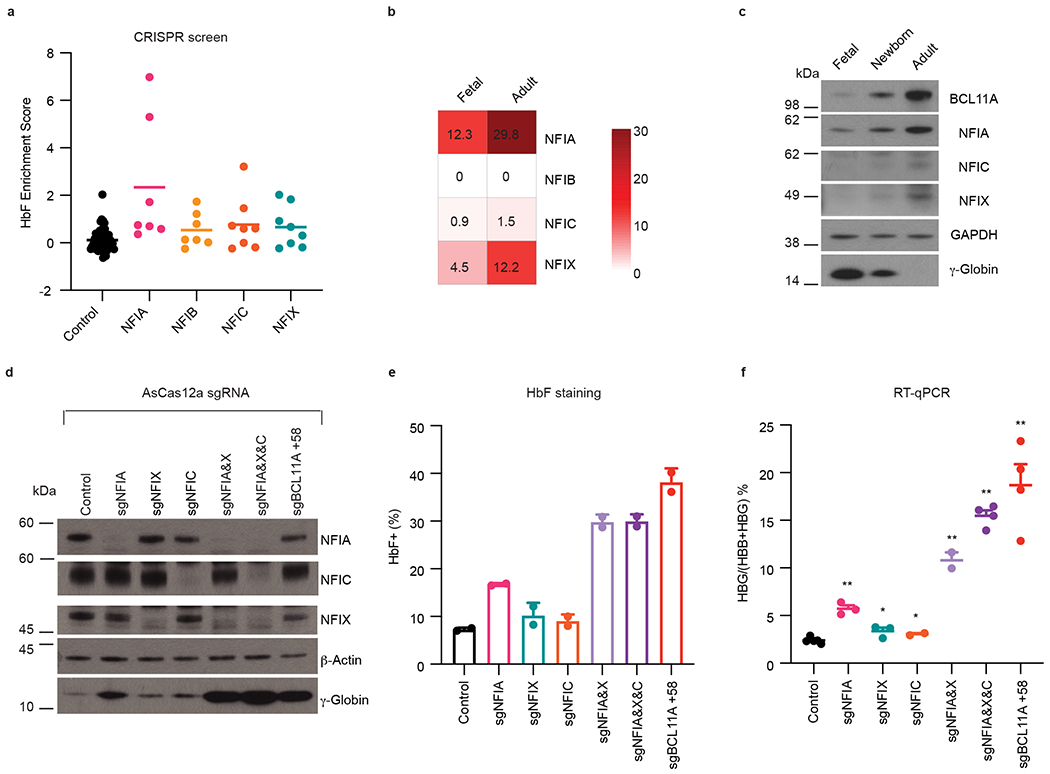
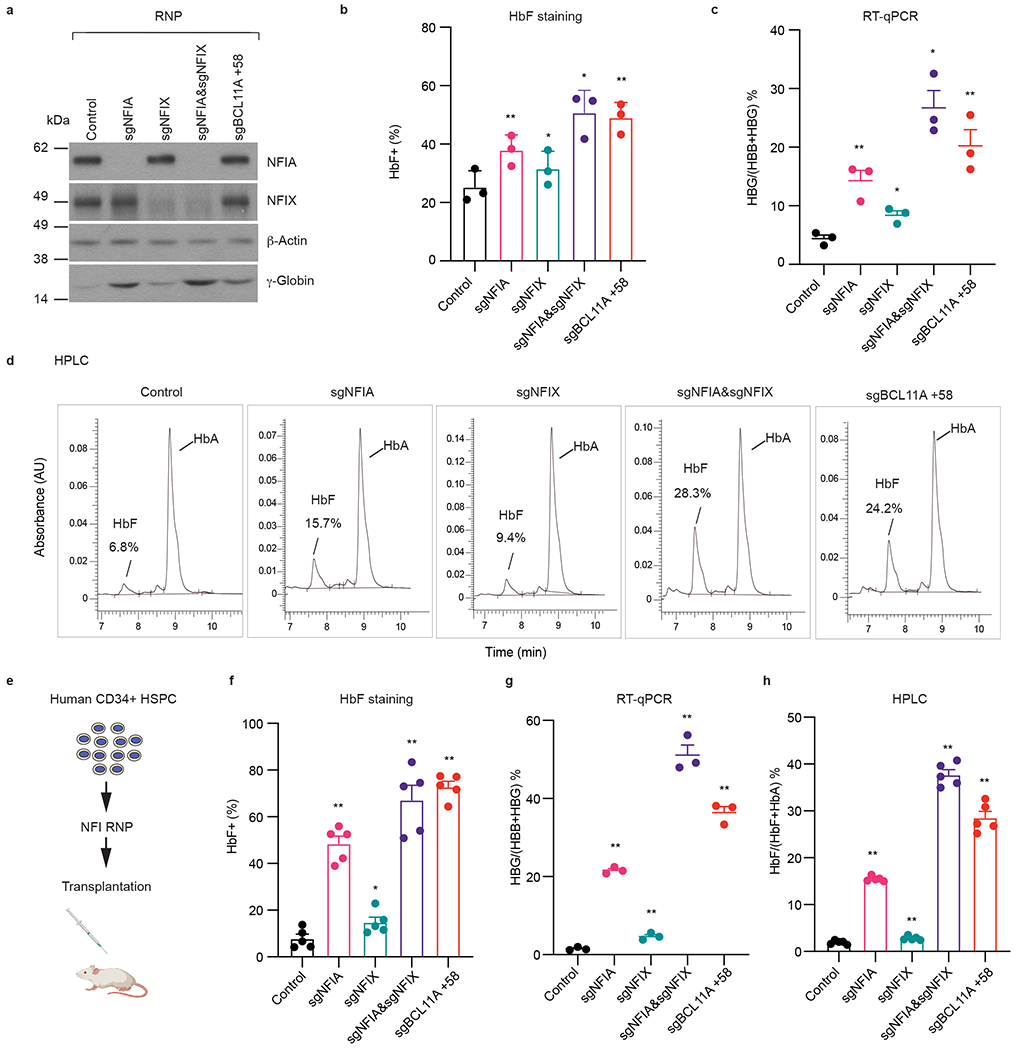
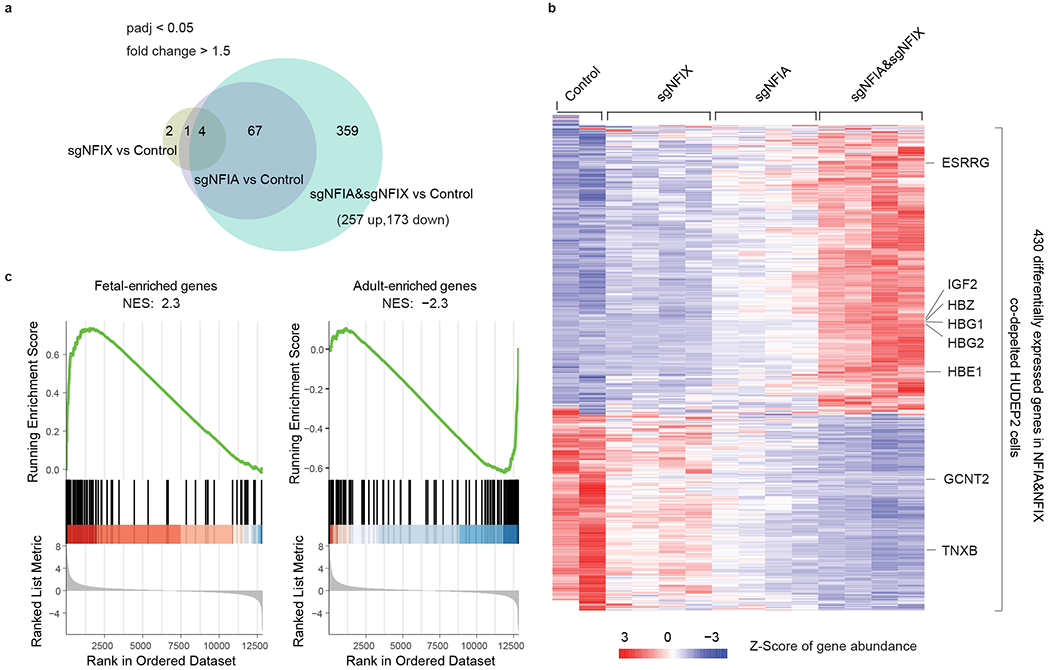
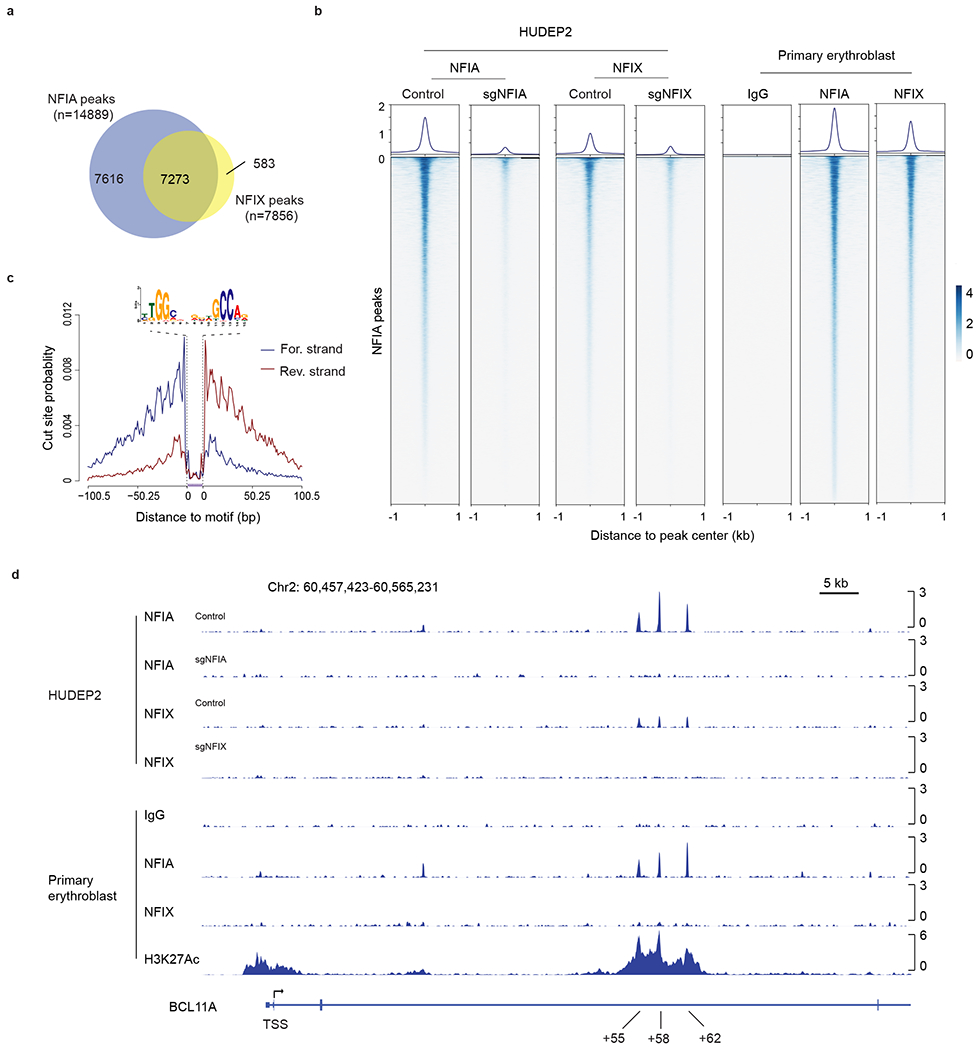
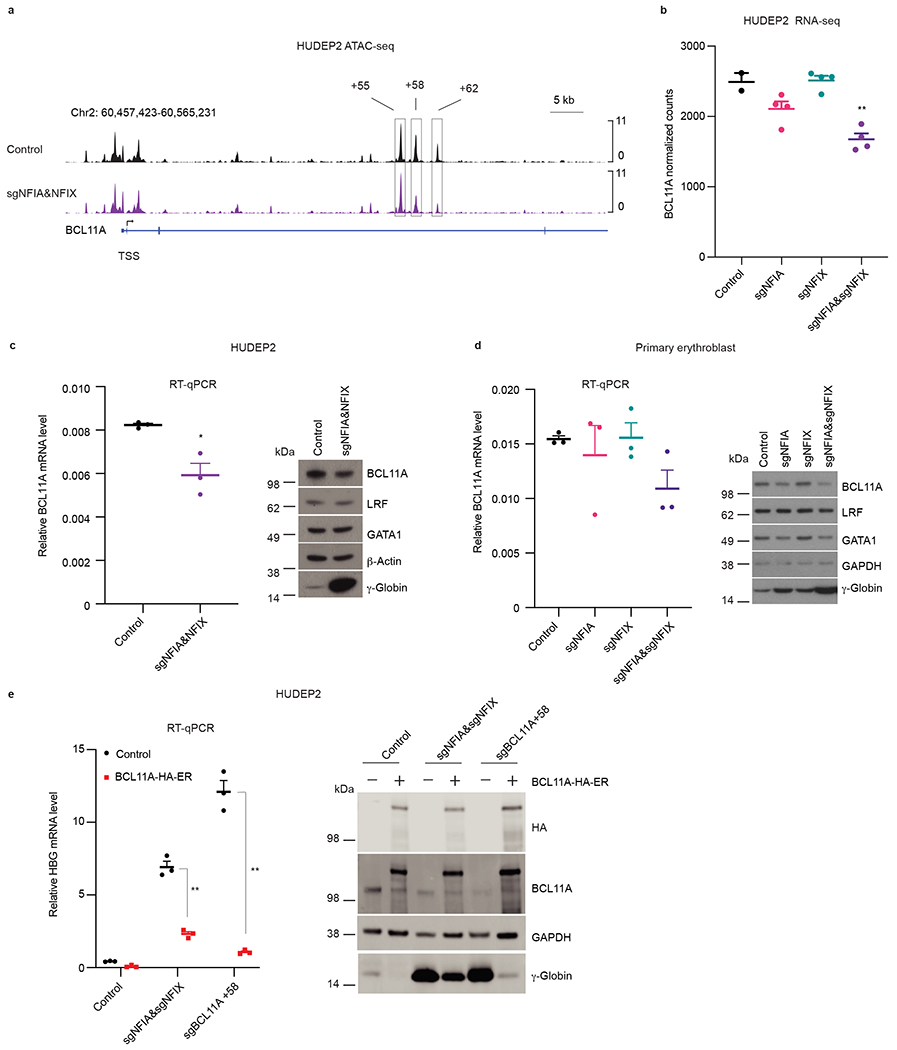
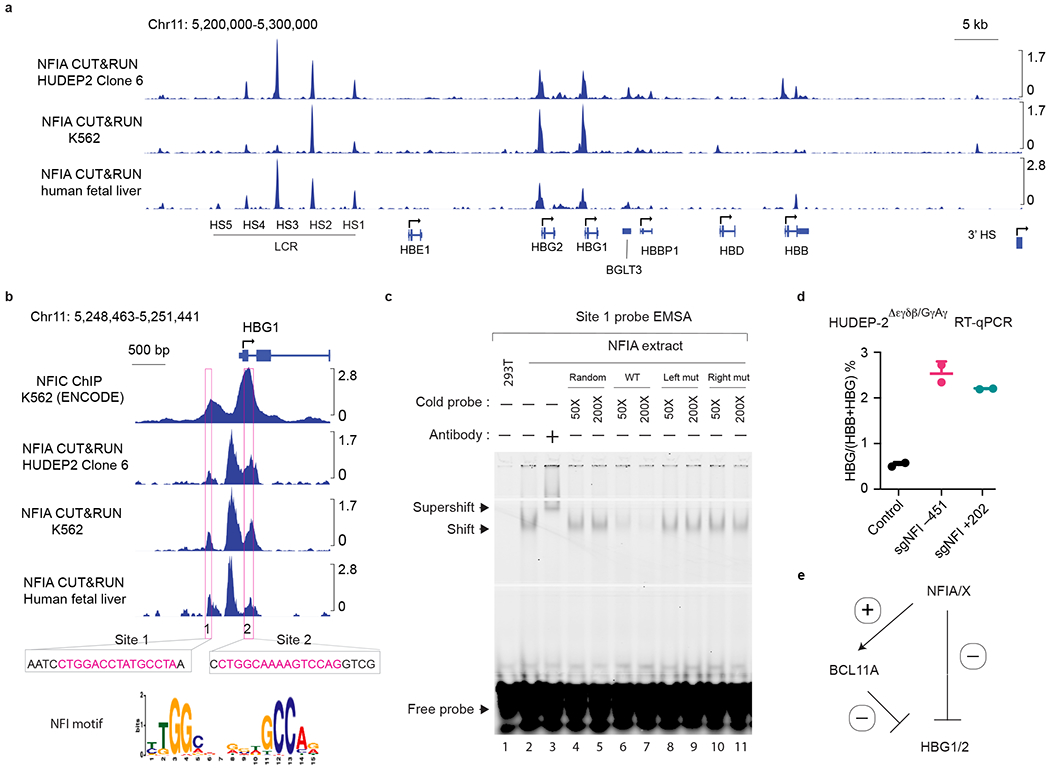
The mechanisms by which the fetal-type β-globin-like genes HBG1 and HBG2 are silenced in adult erythroid precursor cells remain a fundamental question in human biology and have therapeutic relevance to sickle cell disease and β-thalassemia. Here, we identify via a CRISPR-Cas9 genetic screen two members of the NFI transcription factor family-NFIA and NFIX-as HBG1/2 repressors. NFIA and NFIX are expressed at elevated levels in adult erythroid cells compared with fetal cells, and function cooperatively to repress HBG1/2 in cultured cells and in human-to-mouse xenotransplants. Genomic profiling, genome editing and DNA binding assays demonstrate that the potent concerted activity of NFIA and NFIX is explained in part by their ability to stimulate the expression of BCL11A, a known silencer of the HBG1/2 genes, and in part by directly repressing the HBG1/2 genes. Thus, NFI factors emerge as versatile regulators of the fetal-to-adult switch in β-globin production.


Conflict of interest statement

Competing interests

The authors declare that there is no duality of interest associated with this manuscript.

Figures

Extended Data Fig. 1
Extended Data Fig. 1. Co-depletion of NFIA and NFIX reactivates γ-globin in HUDEP2 cells.
a, Diagram depicting the structure of NFI gene products. b, Schematic of multiplex AsCas12a sgRNAs. c, Editing efficiency of NFIA, NFIX, NFIC, and BCL11A +58 intronic enhancer in indicated sgRNA infected HUDEP2 cells by AsCas12a (control, n = 4; sgNFIA, n = 4; sgNFIX, n = 4, sgNFIC, n = 2; sgNFIA&X, n = 3; sgNFIA&X&C, n = 4; sgBCL11A +58, n = 2). n represent biological replicates generated from different experiments. Genomic DNAs were obtained from indicated 5 days post-infected HUDEP2 cells. d, Representative gating strategy and HbF staining results in control and indicated Cas12a sgRNA-infected HUDEP2 cells. The first gate selects the live cells in the population. The second gate distinguishes the HbF+ and HbF− population. Experiments were performed twice with similar results. e-h, HUDEP2 cells expressing CRISPR-Cas9 were infected with pLRG2.1 or pLRCherry2.1 lentivirus carrying control sgRNA or sgRNAs targeting indicated NFI genes or the BCL11A +58 enhancer and analyzed at the end of 5 days differentiation. e, Representative immunoblots of NFIA, NFIX, and γ-globin. β-Actin was used as loading control. Experiments were performed three times with similar results. f-h, RT-qPCR quantification of HBG1/2, HBB, and the ratio of HBG/(HBG+HBB) mRNA. Data were normalized to GAPDH (n = 3) and expressed as means ± SEM. *p < 0.05, **p < 0.01. p values were calculated by comparing indicated samples to control with parametric paired two-tailed Student’s t test. f, sgNFIA #1, p = 0.0422; sgNFIA #2, p = 0.0161; sgNFIX #1, p = 0.0644; sgNFIX #2, p = 0.4230; sgNFIA&NFIX#1, p = 0.0154; sgNFIA&NFIX#2, p = 0.0150; sgBCL11A +58, p = 0.0288. g, sgNFIA #1, p = 0.0033; sgNFIA #2, p = 0.0052; sgNFIX #1, p = 0.0005; sgNFIX #2, p = 0.0265; sgNFIA&NFIX#1, p = 0.0007; sgNFIA&NFIX#2, p = 0.0024; sgBCL11A +58, p = 0.0009.
Extended Data Fig. 2
Extended Data Fig. 2. Co-depletion of NFIA and NFIX reactivates γ-globin in primary erythroblasts derived from healthy donors.
a, Three-phase in vitro culture system for human CD34+ HSPCs to differentiate into mature red cells. Cas9 and indicated NFI sgRNA RNPs were transfected into CD34+ HSPCs on day 4 of culture by electroporation. Erythroblasts were harvested and analyzed by RT-qPCR, immunoblot, HbF staining, and HPLC on day 13 or 15 of culture. b, Representative immunoblots of NFIA, NFIX, and γ-globin from untargeted primary cells at indicated days of differentiation. Experiments were performed on two donors with similar results. c, Representative HbF staining result from indicated gene edited primary erythroblasts at day 15 of differentiation. d, Representative CD71 and CD235a flow cytometry of primary erythroblasts at day 15 of differentiation. e, Representative Wright-Giemsa stains of primary erythroblasts at day 15 of differentiation. Experiments in c-e were performed on three donors/biological replicates with similar results. Scale bar, 25 μm.
Extended Data Fig. 3
Extended Data Fig. 3. Co-depletion of NFIA and NFIX reactivates γ-globin in primary erythroblasts derived from SCD patients.
a, Procedure for depleting NFIA and/or NFIX in SCD CD34+ HSPCs in primary culture (n = 1). Isolated CD34+ HSPCs were transfected by indicated RNPs on day 4 of culture. On day 13, a subset of cells was harvested for RT-qPCR analysis. On day 15, a subset of cells was harvested for immunoblots and HbF flow cytometry analysis. On day 21, the remaining cells were collected for low O2 sickling assay. b, Immunoblots of NFIA, NFIX, γ-globin, and β-globin (n = 1 donor). c, The ratio of HBG/HBG+HBB as determined by RT-qPCR (n = 1 donor). d, HbF+ fraction (%) as determined by HbF flow cytometry (n = 1 donor). e, Representative micrographs of sickle cells, and quantification of the percentage of sickle cells (n = 1 donor). Scale bar, 25 μm.
Extended Data Fig. 4
Extended Data Fig. 4. Co-depletion of NFIA and NFIX strongly reactivates γ-globin in human-to-mouse xenotransplants
a, Percentage of human CD45+ cells in the bone marrow of the transplanted NBSGW mice (n = 5 mice/biological replicates). b, Composition of myeloid, B cells, and HSPCs from CD45+ sorted population and percentage of erythroid cells from hCD45- cells (n = 5 mice/biological replicates). c-e, Indel analysis of NFIA, NFIX, and BCL11A in input HSPCs, total engrafted cells, B cells, T cells, and HSPCs isolated from indicated recipient animals 16 weeks post-transplantation (n = 5 mice/biological replicates). Data are expressed as means ± SEM.
Extended Data Fig. 5
Extended Data Fig. 5. NFIA and NFIX support an adult-type erythroblast transcription program.
a, Clustering analysis of 430 NFIA and NFIX co-depletion affected genes in HUDEP2 cells. A total of four distinct expression patterns are identified. Boxplot showing expression levels of genes in Group1 (n = 234) and Group2 (n = 174) display a correlation with the dosage of total NFI proteins. Y-axes represent z-scores of gene abundance. Lower whisker, smallest observation greater than or equal to lower hinge - 1.5 x Interquartile range (IQR); lower hinge, 25% quantile; median, 50% quantile; upper hinge, 75% quantile; upper whisker, largest observation less than or equal to upper hinge + 1.5 x IQR. b-d, Scatter plot showing the comparison of adult globin genes (HBA1/2, HBB, and HBD) and red cell differentiation-related genes (GATA1, ALAS2, and BAND3) in representative control, NFIA and NFIX single or co-depleted (sgNFIA&NFIX) HUDEP2 cells.
Extended Data Fig. 6
Extended Data Fig. 6. Characterization of NFIA and NFIX genomic occupancy profiles by CUT&RUN.
a, The statistics of NFIA and NFIX peaks identified from HUDEP2 and primary erythroblast CUT&RUN experiments. b, Genomic features of NFIA and NFIX CUT&RUN peaks. c, Distribution of NFIA and NFIX-binding loci relative to gene transcription start site. d, Genomic occupancies of NFIA and NFIX at β-globin locus in HUDEP2 and primary erythroblasts. NFIA KO (sgNFIA), NFIX KO (sgNFIX), and IgG were used as controls. e, CUT&RUN signals at the BCL11A locus with three indicated NFIA antibodies in primary cells at day 10 of differentiation.
Extended Data Fig. 7
Extended Data Fig. 7. NFI factors support BCL11A gene expression in adult erythroid cells.
a, Venn diagrams showing statistics of ATAC-seq peaks (chromatin open regions) in control and NFIA and NFIX co-depleted (sgNFIA&NFIX) replicate samples. b, ATAC-seq tracks at the β-globin locus in control and NFIA and NFIX co-depleted (sgNFIA&NFIX) HUDEP2 cells.
Extended Data Fig. 8
Extended Data Fig. 8. NFI factors directly silence HBG1/2 genes.
a, NFIA and NFIC ChIP-seq signals at the β-globin locus in K562 cells. NFIA ChIP-seq data were downloaded from GEO (GSM2574788) and NFIC ChIP-seq data were downloaded from ENCODE (ENCSR796ITY). b-c, Footprint analysis of NFIA CUT&RUN data at NFI binding sites that were protected from pAG-MNase cut in CUT&RUN assays. The location of site 1 is approximately 450 bp upstream of HBG1/2 TSS (transcription start site), whereas site 2 is in HBG1/2 first intron, 200 bp downstream of HBG1/2 TSS. Data were aggregates from three replicates of NFIA CUT&RUN-sequencing results in HUDEP2 clone 6 cells. d, Footprint analysis of NFIA CUT&RUN data at the HBG1/2 TSS-proximal region. Boxes denote three putative NFI binding sites that were not protected from the pAG-MNase cut in CUT&RUN assays. The BCL11A and NFYA binding sites are underlined. Data were aggregates from three replicates of NFIA HUDEP2 clone 6 CUT&RUN. e-g, Electrophoretic mobility shift assay (EMSA) examining the binding of NFIA (e) and NFIX (f-g) with probes containing identified NFI binding sites sequence. In all experiments, the interaction of NFIA/NFIX and IRDye 700 labeled probes produced a gel shift which was competed with unlabeled cold probes in 50 (50x) or 200 (200x) times excess molar concentration, including a random sequence (random), wild type (WT), or two mutant sequences (Left mut or Right mut) containing either left or right half of the NFI full motif (TGGA or GCCT for site 1 and TGGC or TCCA for site 2). The identity of the NFIA/X-DNA complex was verified with an anti-AM tag antibody that recognized the recombinant NFIA or NFIX protein and generated a “supershift”. Left mut: probes contain four mutated sequences at the left half of the NFI motif sequences; Right mut: probes contain right mutated sequences at the left half of the NFI motif sequences.
Extended Data Fig. 9
Extended Data Fig. 9. Two putative NFI motifs are required for NFI binding in HBG1/2 genes.
a, HUDEP2 clone 6 and K562 cells expressing CRISPR-Cas9 were infected with sgRNAs targeting NFI binding site 1 (NFI −451) and site 2 (NFI +202). NFIA CUT&RUN tracks at the HBG1/2 gene locus in control and NFI binding site 1 (NFI −451) and site 2 (NFI +202) edited HUDEP2 clone 6 and K562 cells. b, HUDEP2 Δεγδβ/GγAγ cells expressing CRISPR-Cas9 were infected with sgRNAs targeting NFI binding site 1 (NFI −451) and site 2 (NFI +202). Genomic DNA of control and edited cells were isolated and subject to PCR and sanger sequencing analysis (n = 2 biological replicates generated from independent experiments). The arrows denote the sgRNAs target sites.
Fig. 1.
Fig. 1.. NFIA and NFIX cooperatively silence HBG1/2 genes in HUDEP2 cells.
a, Enrichment scores of negative control sgRNAs (n = 12) and sgRNAs targeting NFI factors (NFIA, n = 7; NFIB, n = 7; NFIC, n = 8; NFIX, n = 8) in DNA binding domain-focused CRISPR-Cas9 screen. Data were obtained from Huang et al. n represents different sgRNAs. b, Heatmap of NFI gene expression levels in primary erythroblasts from fetal liver (fetal, expressing HBG, n = 12) or bone marrow (adult, expressing HBB, n = 12). Fragments per kilobase of transcript per million mapped reads (FPKM) of indicated genes were obtained from Lessard et al.. n represents different donors/biological replicates. c, Representative immunoblots of NFI proteins in erythroblasts derived from fetal liver (fetal, expressing HBG), cord blood (newborn, expressing both HBG and HBB), and peripheral blood (adult, expressing HBB). BCL11A and γ-globin served as positive controls and GAPDH as loading control. Experiments were performed twice with similar results. d-f, HUDEP2 cells expressing CRISPR-AsCas12a were transduced by a lentiviral vector carrying control sgRNA or sgRNAs targeting indicated NFI genes or the BCL11A +58 enhancer. Indicated HUDEP2 cells were analyzed at the end of differentiation (day 5). d, Representative immunoblots of NFI proteins and γ-globin in indicated HUDEP2 cells. β-Actin served as loading control. Experiments were performed three times with similar results. e, HbF+ fraction (%) of control (n = 2) and indicated gene edited HUDEP2 cells (n = 2) as determined by intracellular HbF staining. n represents two biological replicates. Data are expressed as mean ± SEM. f, The ratio of HBG/(HBG+HBB) of indicated HUDEP2 cells as determined by RT-qPCR (control, n = 5; sgNFIA, n = 3; sgNFIX, n = 3; sgNFIC, n = 2; sgNFIA&X, n = 2; sgNFIA&X&C, n = 4; sgBCL11A +58, n = 4). Data are expressed as means ± SEM. n represents biological replicates. * P < 0.05, ** P < 0.01. P values were calculated by comparing indicated samples to control with parametric unpaired two-tailed Student’s t-test. sgNFIA, P < 0.0001; sgNFIX, P = 0.0248; sgNFIC, P = 0.0426; sgNFIA&X, P < 0.0001; sgNFIA&X&C, P < 0.0001; sgBCL11A +58, P < 0.0001.
Fig. 2.
Fig. 2.. Co-depletion of NFIA and NFIX reactivates γ-globin in primary adult erythroblasts and xenotransplants.
Frozen G-CSF mobilized human peripheral blood CD34+ hematopoietic stem and progenitor cells (HSPCs) were expanded for three days and transfected with indicated Cas9 and sgRNA RNPs by electroporation. On day 13 of differentiation, a subset of cells was harvested for RNA analysis. On day 15 of differentiation, the remaining cells were subjected to HbF staining, immunoblots, and HPLC analysis. a, Representative immunoblots of NFIA, NFIX, and γ-globin from indicated primary erythroblasts. Experiments were performed with three independent donors with similar results. b, HbF+ fraction (%) of indicated primary erythroblasts as determined by HbF intracellular staining (n = 3 independent donors/biological replicates). Data are expressed as mean ± SEM. * P < 0.05, ** P < 0.01. P values were calculated by comparing indicated samples to control with parametric paired two-tailed Student’s t-test. sgNFIA, P = 0.0099; sgNFIX, P = 0.0119; sgNFIA&NFIX, P = 0.0184; sgBCL11A +58, P = 0.0046. c, The ratio of HBG/(HBG+HBB) of indicated primary erythroblasts as determined by RT-qPCR (n = 3 independent donors/biological replicates). Data are expressed as mean ± SEM. * P < 0.05, ** P < 0.01. P values were calculated by comparing indicated samples to control with parametric paired two-tailed Student’s t-test. sgNFIA, P = 0.0140; sgNFIX, P = 0.0155; sgNFIA&NFIX, P = 0.0119; sgBCL11A +58, P = 0.0049. d, Representative HPLC analysis of fetal hemoglobin (HbF) and adult hemoglobin level (HbA) in indicated primary erythroblast cells. Experiment was performed with one donor. e-h, Human CD34+ HSPCs were electroporated with RNPs targeting negative control sequence, indicated NFI genes, or the BCL11A +58 enhancer. Control and NFI RNP edited cells were transplanted into NBSGW (NOD, B6. SCID Il2rg−/−KitW41/W41) mice via tail-vein injection as illustrated in e. After 16 weeks, erythroblasts (CD49d+, CD235a+) from bone marrows of the transplanted mice were analyzed for HbF+ fraction (%, f, n = 5 mice/biological replicates), RT-qPCR (g, n = 3 mice/biological replicates), and HPLC (h, n = 5 mice/biological replicates). Data are expressed as means ± SEM. * P < 0.05, ** P < 0.01. P values were calculated by comparing indicated samples to control with parametric unpaired two-tailed Student’s t-test. f. sgNFIA, P <0.0001; sgNFIX, P = 0.0424; sgNFIA&NFIX, P < 0.0001; sgBCL11A +58, P < 0.0001. g. sgNFIA, P < 0.0001; sgNFIX, P = 0.0051; sgNFIA&NFIX, P < 0.0001; sgBCL11A +58, P < 0.0001. h. sgNFIA, P < 0.0001; sgNFIX, P = 0.0107; sgNFIA&NFIX, P < 0.0001; sgBCL11A +58, P < 0.0001.
Fig. 3.
Fig. 3.. NFIA and NFIX support an adult-type erythroblast transcription program.
a-c, RNA-seq analysis of global gene expression changes upon NFIA and NFIX single or combined depletion in HUDEP2 cells, based on two biological replicates. a, Intersection analysis of genes whose expression level changes upon depletion of NFIA (sgNFIA), NFIX (sgNFIX), or NFIA and NFIX co-depletion (sgNFIA&sgNFIX) in HUDEP2 cells. Fold change > 1.5 and adjusted P value < 0.05 (adjusted for multiple comparisons) were used as cutoffs for identifying differentially expressed genes. b, Heatmap showing expression level changes of 430 NFIA and NFIX co-depletion affected genes in response to single or combined NFIA and NFIX depletion. c, Gene set enrichment analysis (GSEA) of NFIA and NFIX co-depletion affected genes. Fetal-enriched gene and adult-enriched gene sets were obtained from Lessard et al. NES, normalized enrichment score.
Fig. 4.
Fig. 4.. NFIA and NFIX genomic occupancy profiles by CUT&RUN.
a, Venn diagram of NFIA and NFIX binding sites identified from CUT&RUN experiments. b, Visualization of NFIA and NFIX CUT&RUN peaks in HUDEP2 and primary erythroblasts by profile and heatmap plots. 14,889 NFIA peaks identified from HUDEP2 and primary cell CUT&RUN were used for generating this graph. Peaks are ranked by CUT&RUN tag counts. c, Representative footprint analysis result of de novo binding motif identified from the NFIA or NFIX CUT&RUN experiments. d, NFIA and NFIX occupancy profiles at the BCL11A locus in HUDEP2 and primary erythroblasts. NFIA KO (sgNFIA), NFIX KO (sgNFIX), and IgG served as controls.
Fig. 5.
Fig. 5.. NFI factors support BCL11A expression in adult erythroblast.
a, Enrichment of ATAC-seq signals at the BCL11A locus in control (n = 2) or NFIA and NFIX co-depleted (sgNFIA&NFIX, n = 2) HUDEP2 cells. The boxed regions are BCL11A +55, +58, and +62 enhancers. n represents biological replicates. b, Normalized counts of BCL11A mRNA in RNA-seq (n = 2 for control sgRNAs and n = 4 for NFIA depletion (sgNFIA), NFIX depletion (sgNFIX), and NFIA and NFIX co-depletion (sgNFIA&sgNFIX)). Data are expressed as mean ± SEM. ** P < 0.01. P values were calculated by comparing indicated samples to control with parametric unpaired two-tailed Student’s t-test. sgNFIA, P = 0.0952; sgNFIX, P = 0.8781; sgNFIA&NFIX, P = 0. 0049. c, BCL11A mRNA and protein levels in control and NFIA and NFIX co-depleted (sgNFIA&NFIX) HUDEP2 cells. RT-qPCR quantification of BCL11A mRNA in control and NFIA and NFIX co-depleted (sgNFIA&NFIX) HUDEP2 cells. Data were normalized to AHSP (n = 3 biological replicates). Data are expressed as mean ± SEM. * P < 0.05. P values were calculated by comparing indicated samples to control with parametric unpaired two-tailed Student’s t-test. P = 0.0141. Representative immunoblots of BCL11A, LRF, GATA1, and γ-globin in control and NFIA and NFIX co-depleted (sgNFIA&NFIX) HUDEP2 cells. β-Actin served as loading control. Experiments were performed more than three times with similar results. d, BCL11A mRNA and protein levels in indicated RNP modified primary cells. RT-qPCR quantification of BCL11A mRNA in control and indicated NFI factor depleted primary cells. Data were normalized to AHSP (n = 3 independent donors). Data are expressed as mean ± SEM. * P < 0.05, ** P < 0.01. p values were calculated by comparing indicated samples to control with parametric unpaired two-tailed Student’s t-test. sgNFIA, P = 0.6207; sgNFIX, P = 0.9306; sgNFIA&NFIX, P = 0. 0586. Representative immunoblots of BCL11A, LRF, GATA1, and γ-globin in control and NFIA/NFIX single or combined depleted primary cells. Similar results were obtained using samples from three additional donors. GAPDH served as loading control. e, HBG1/2 mRNA and γ-globin levels in control, NFIA and NFIX co-depleted (sgNFIA&sgNFIX) HUDEP2 cells, and sgBCL11A +58 HUDEP2 cells following overexpression of BCL11A cDNA as quantified by RT-qPCR and immunoblot. Data were normalized to AHSP (n = 3 biological replicates) and expressed as mean ± SEM. ** P < 0.01. P values were calculated by comparing samples from cells overexpressing BCL11A to those serving as controls with parametric unpaired two-tailed Student’s t-test. sgNFIA&sgNFIX, P < 0.0001; sgBCL11A +58, P < 0.0001. Endogenous and ectopic BCL11A were distinguished by anti-BCL11A and anti-HA antibodies. Immunoblots were performed twice with similar results.
Fig. 6.
Fig. 6.. NFI factors directly silence the HBG1/2 genes.
a, NFIA CUT&RUN tracks at the β-globin locus in a HUDEP2 sub-clonal population in which the HBG1/2 genes are not fully silenced (HUDEP2 Clone 6), K562 cells, and primary human fetal liver erythroblasts. b, Zoomed-in view of NFIC ChIP-seq (ENCODE: ENCSR796ITY) in K562 cells and three CUT&RUN tracks in a at the HBG1 gene. Boxes demarcate two regions with bearing NFI motifs. c, Electrophoretic mobility shift assay (EMSA) examining the binding of NFIA and the IRDye 700 labeled site 1 sequence probe. The interaction of NFIA and site 1 (~450 bp upstream of HBG1/2 TSS) probe produced a gel shift which was competed with unlabeled cold probes in 50 (50×) or 200 (200×) times excess molar concentration, including a random sequence (random), wild type (WT), or two mutant sequences (Left mut or Right mut) containing either mutated left or right half of the NFI full motif (TGGA or GCCT). Note that the NFIA-DNA interaction could only be out-competed by the WT probe but not by random probes or half-site mutated probes, indicating the interaction requires a full NFIA binding site. The identity of the NFIA-DNA complex was verified with an anti-AM tag antibody that recognized the recombinant NFIA protein and generated a “supershift”. Left mut: probes contain four mutated sequences at the right half of the NFI motif sequences; Right mut: probes contain four mutated sequences at the left half of the NFI motif sequences. Experiments were performed twice with similar results. d, HUDEP2Δεγδβ/GγAγ cells expressing CRISPR-Cas9 were transduced by a lentiviral vector carrying sgRNAs targeting NFI binding site 1 (NFI −451) or site 2 (NFI +202). control (n = 4) and edited (n = 2) HUDEP2 cells were harvested at day 5 of differentiation and subjected to RT-qPCR analysis. The ratio of HBG/(HBG+HBB) as determined by RT-qPCR. n represents biological replicates. Data are expressed as means ± SEM. e. Model of the dual roles of NFI transcription factors in the silencing of HBG1/2 genes in adult erythroid cells. NFI proteins act both directly on the HBG1/2 genes (transcription repression) and indirectly by stimulating BCL11A transcription (transcription activation).

References

    1. Orkin SH Molecular Medicine: Found in Translation. Med 2, 122–136 (2021). - PMC - PubMed
    1. Menzel S et al. A QTL influencing F cell production maps to a gene encoding a zinc-finger protein on chromosome 2p15. Nat. Genet 39, 1197–1199 (2007). - PubMed
    1. Uda M et al. Genome-wide association study shows BCL11A associated with persistent fetal hemoglobin and amelioration of the phenotype of β-thalassemia. Proc. Natl. Acad. Sci. U. S. A 105, 1620–1625 (2008). - PMC - PubMed
    1. Sankaran VG et al. Human fetal hemoglobin expression is regulated by the developmental stage-specific repressor BCL11A. Science 322, 1839–1842 (2008). - PubMed
    1. Masuda T et al. Gene regulation: Transcription factors LRF and BCL11A independently repress expression of fetal hemoglobin. Science 351, 285–289 (2016). - PMC - PubMed

Publication types

LinkOut - more resources