. 2022 May 26;13(1):2950.
doi: 10.1038/s41467-022-30646-4.

Multiomics reveals persistence of obesity-associated immune cell phenotypes in adipose tissue during weight loss and weight regain in mice

Affiliations

Multiomics reveals persistence of obesity-associated immune cell phenotypes in adipose tissue during weight loss and weight regain in mice

Matthew A Cottam et al. Nat Commun. .

Abstract

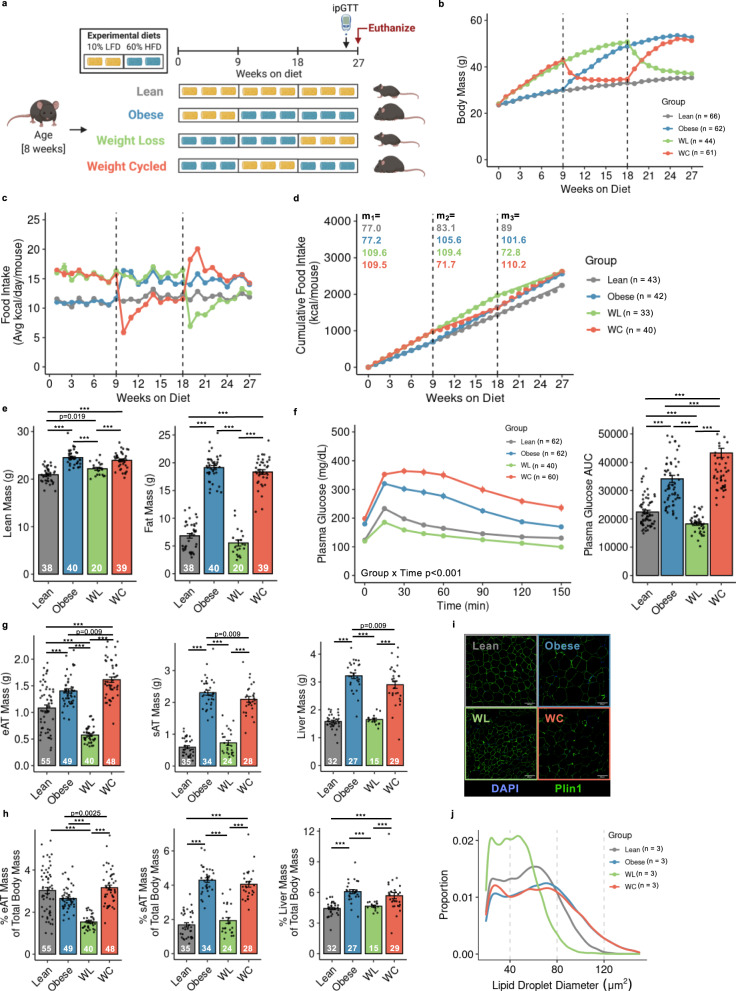
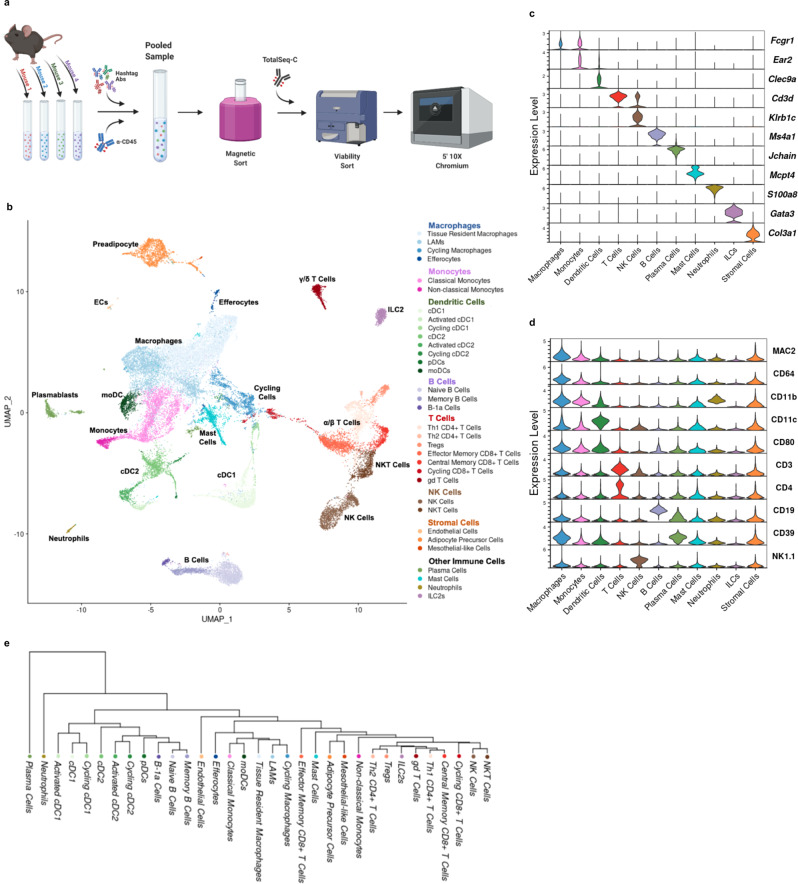
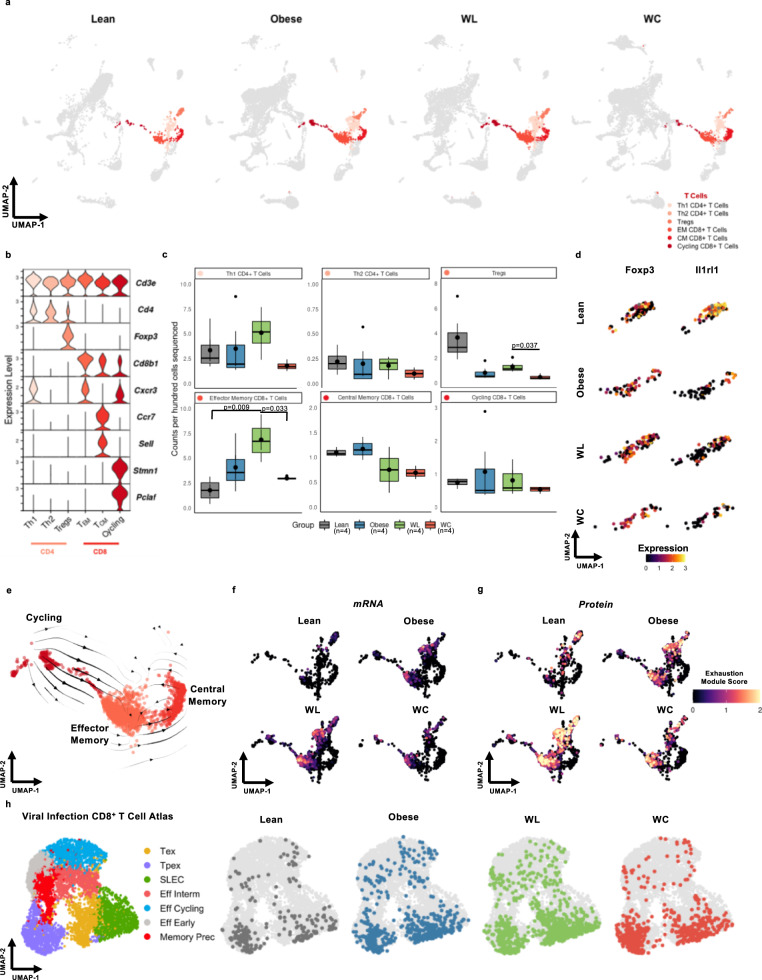
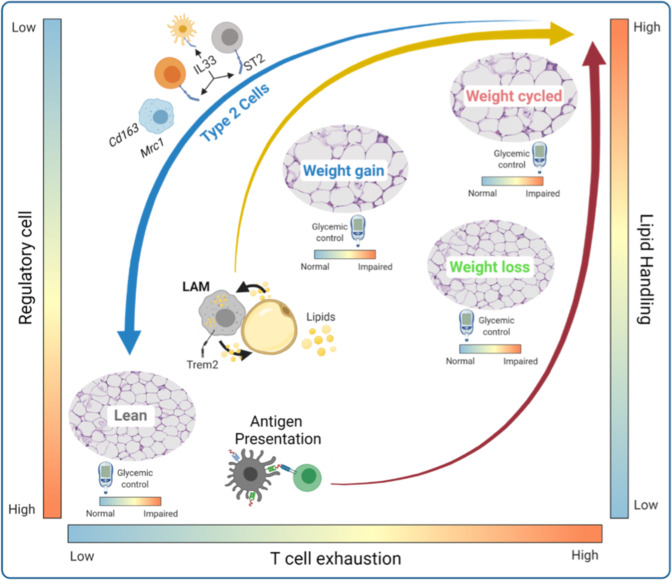
Within adipose tissue (AT), immune cells and parenchymal cells closely interact creating a complex microenvironment. In obesity, immune cell derived inflammation contributes to insulin resistance and glucose intolerance. Diet-induced weight loss improves glucose tolerance; however, weight regain further exacerbates the impairment in glucose homeostasis observed with obesity. To interrogate the immunometabolic adaptations that occur in AT during murine weight loss and weight regain, we utilized cellular indexing of transcriptomes and epitopes by sequencing (CITEseq) in male mice. Obesity-induced imprinting of AT immune cells persisted through weight-loss and progressively worsened with weight regain, ultimately leading to impaired recovery of type 2 regulatory cells, activation of antigen presenting cells, T cell exhaustion, and enhanced lipid handling in macrophages in weight cycled mice. This work provides critical groundwork for understanding the immunological causes of weight cycling-accelerated metabolic disease. For further discovery, we provide an open-access web portal of diet-induced AT immune cell imprinting: https://hastylab.shinyapps.io/MAIseq .


Conflict of interest statement

The authors declare no competing interests.

Figures

Fig. 1
Fig. 1. Mouse models of lean, obese, weight loss (WL), and weight cycling (WC).
a Schematic of dietary approaches to generate WL and WC mice using 10% low fat diet (LFD) and 60% high fat diet (HFD). b Body mass over time measured weekly with diet switch indicated by dashed lines. c Food intake over time measured weekly. d Cumulative food intake measured throughout the duration of the studies with slope (m) for each 9-week segment indicated. e Lean and fat mass measured by nuclear magnetic resonance. f Blood glucose during an intraperitoneal glucose tolerance test (ipGTT) dosed at 1.5 g dextrose/kg lean mass one week prior to the end of the study and area under the curve (AUC) for ipGTT. g Tissue mass for epididymal adipose tissue (eAT), subcutaneous adipose tissue (sAT), and liver and h tissue mass as percentage of body mass at sacrifice. i Representative imaging of Perilipin-1 (Plin1) and 4′,6-diamidino-2-phenylindole (DAPI) immunofluorescence for lipid droplet size. (j) Distribution of lipid droplet size. For diet groups, gray = lean, blue = obese, green = WL, orange = WC. Pairwise two-tailed Student’s t-tests with Bonferroni correction for multiple comparisons were used to compare groups for body composition, tissue mass, and ipGTT AUC and two-way ANOVA was used to compare groups for ipGTT; significant p values shown or ***padj < 0.001. Data is plotted as mean ± SEM. Sample size (mouse per group; n) is indicated in corresponding figure legends or by white text at the bottom of each histogram. Figure 1a was created with Biorender.com.
Fig. 2
Fig. 2. Adipose tissue immune cell populations observed by CITE-seq.
Schematic of CITE-seq approach using hashtag antibodies (Abs) and Total-SeqC antibodies. b Unbiased clustering of 33,322 single cells labeled broadly by cell type category and colored by high-resolution cell type identities via Uniform Manifold Approximation and Projection (UMAP). Populations include lipid-associated macrophages (LAMs), conventional dendritic cells (cDCs), plasmacytoid DCs (pDCs), monocyte-derived DCs (moDCs), T helper (Th) cells, T regulatory cells (Tregs), gamma-delta (gd) T cells, natural killer (NK) cells, and type 2 innate-like lymphoid cells (ILC2s). Selected markers of specific cell subsets based on c gene expression and d surface protein. e Phylogenetic tree of high-resolution cell type identities. Figure 2a was created with Biorender.com.
Fig. 3
Fig. 3. CITE-seq recapitulates obesity-associated immune cell changes in adipose tissue.
a Differential abundance by log fold change (FC) of metacells (index cells representing a neighborhood (Nhood) of cells connected by proximity in Uniform Manifold Approximation and Projection; UMAP) comparing cells from obese mice to lean mice. b Differential abundance of annotated cell types comparing cells from obese mice to lean mice. c Permutation testing of high-resolution clusters to calculate the proportional difference comparing cells from obese mice to lean mice by false discovery rate (FDR). Populations include lipid-associated macrophages (LAMs), conventional dendritic cells (cDCs), plasmacytoid DCs (pDCs), monocyte-derived DCs (moDCs), T helper (Th) cells, T regulatory cells (Tregs), gamma-delta (gd) T cells, natural killer (NK) cells, and type 2 innate-like lymphoid cells (ILCs). d, e Counts per hundred cells sequenced for lean-associated immune cell subsets and obesity-associated immune cell subsets in lean and obese mice (mean ± SEM; n = 4 mice; two-tailed t-test with indicated p values). For diet groups, gray = lean, blue = obese.
Fig. 4
Fig. 4. Adipose tissue T cells are retained and express markers of exhaustion in mice that have gained, lost, and regained weight.
a Uniform Manifold Approximation and Projection (UMAP) of T cell subclusters by diet group for lean, obese, weight loss (WL), and weight cycled (WC) mice. Populations include T helper (Th) cells, T regulatory cells (Tregs), and effector memory (EM) and central memory (CM) CD8+ T cells. b Expression of markers enriched in T cell subclusters. c Counts per hundred cells sequenced for α/β T cell subclusters (mean ± SEM; n = 4 mice). Box indicates interquartile range (25th–75th percentile) with 50th percentile indicated by solid line and mean indicated by large circle. Range of whiskers indicates largest and smallest values within 1.5 times the interquartile range and values outside of the range are indicated by small circles. d Expression of the Treg markers Foxp3 and Il1rl1 within the Treg subcluster across diet groups. e Embedding of RNA velocity displayed on the UMAP for CD8+ T cells. f CD8+ T cells colored by an exhaustion module containing the mRNA features Pdcd1, Tox, Tigit, Lag3, and Entpd1. g CD8+ T cells colored by an exhaustion module containing the CITE-seq features PD-1 (CD279) and TIGIT. h CD8+ T cells plotted onto a viral infection CD8+ T cell reference atlas using ProjecTILs. ProjectTILs populations CD8+ include terminally-exhausted (Tex), CD8+ precursor-exhausted (Tpex), short-lived effector cells (SLEC), effector interim (Eff Interm), and memory precursors (Memory Prec). For diet groups, gray = lean, blue = obese, green = WL, orange = WC. Each T cell subset indicated with a different shade of red. Pairwise two-tailed t-tests with Bonferroni correction for multiple comparisons were used to compare groups for cell counts; significant p values shown.
Fig. 5
Fig. 5. Monocytes and dendritic cells (DCs) are abundant in adipose tissue and DCs shift towards a mature, activated status in mice that have gained, lost, and regained weight.
a Uniform Manifold Approximation and Projection (UMAP) of highlighted monocyte and DC subclusters by diet group for lean, obese, weight loss (WL), and weight cycled (WC) mice. Populations include conventional dendritic cells (cDCs), plasmacytoid DCs (pDCs), and monocyte-derived DCs (moDCs). b Expression of genes associated with monocyte subclusters. c Monocyte counts per 100 cells sequenced by diet group (mean ± SEM; n = 4 mice; n.s.d.). d Lipid-handling, activation, adhesion, and co-stimulation genes by diet group for classical monocytes. e Expression of genes enriched in DC subsets. f DC counts per 100 cells sequenced by diet group (mean ± SEM; n = 4 mice). g Expression of genes associated with DC activation. h Embedding of RNA velocity displayed on the UMAP for conventional DC subsets. i Expression of immunoregulatory ligands Cd274, Pdcd1lg2, and Cd200 in DCs by diet group. For diet groups, gray = lean, blue = obese, green = WL, orange = WC. Each monocyte subset indicated with a different shade of pink and each DC subset with different shade of green. Pairwise two-tailed T-tests with Bonferroni correction for multiple comparisons were used to compare groups against the Lean reference group for cell counts with significant p values shown. For panels c and f, box indicates interquartile range (25th–75th percentile) with 50th percentile indicated by solid line and mean indicated by large circle. Range of whiskers indicates largest and smallest values within 1.5 times the interquartile range and values outside of the range are indicated by small circles.
Fig. 6
Fig. 6. Diet-induced obesity causes persistent changes in adipose tissue macrophages, even after weight loss and regain.
a Uniform Manifold Approximation and Projection (UMAP) of macrophage subclusters plotted by diet groups for lean, obese, weight loss (WL), and weight cycled (WC) mice. Populations include lipid-associated macrophages (LAMs). b Expression levels for genes (Lyz2, Cst3, Adgre1, Cd68, Lgals3, and Itgam) and proteins (CITE-seq; MAC2, CD64, and CD11b) associated with macrophages. c Expression of genes that associate with macrophage subclusters. d Counts per hundred cells sequenced for macrophage subclusters (mean ± SEM; n = 4 mice). Box indicates interquartile range (25th–75th percentile) with 50th percentile indicated by solid line and mean indicated by large circle. Range of whiskers indicates largest and smallest values within 1.5 times the interquartile range and values outside of the range are indicated by small circles. e UMAP visualization of Mrc1 and Cd163 expression in tissue resident macrophages (TRMs) by diet group. f Embedding of RNA velocity displayed on the UMAP for macrophage and monocyte subsets. g TRMs and LAMs plotted on based on the macrophage polarization index (MPI) and the activation-induced macrophage differentiation index (AMDI) calculated using MacSpectrum. A shift to the right indicates a more M1-like phenotype. For diet groups, gray = lean, blue = obese, green = WL, orange = WC. Each macrophage subset indicated with a different shade of blue. Pairwise two-tailed t-tests with Bonferroni correction for multiple comparisons were used to compare groups for cell counts; significant p values shown.
Fig. 7
Fig. 7. Adipose tissue immune remodeling during WL and WC.
Body weight gain results in a transition from abundant type 2 immune cells cells (type 2 innate-like lymphoid cells, regulatory T cells, and tissue resident macrophages) present in lean adipose tissue towards an accumulation of immune cells/phenotypes associated with lipid handling (lipid-associated macrophages, LAMs) and antigen presentation. WL does not restore the antigen presentation phenotype and is associated with T cell exhaustion. T cell exhaustion and LAMs are further amplified by weight regain. There is a disconnect between systemic glucose homeostasis and immune remodeling in adipose tissue, such that WL corrects obesity-induced glucose intolerance, but does not resolve the altered immune cell composition caused by diet-induced obesity.

References

    1. Hruby A, Hu FB. The epidemiology of obesity: a big picture. Pharmacoeconomics. 2015;33:673–689. doi: 10.1007/s40273-014-0243-x. - DOI - PMC - PubMed
    1. World Health Organization. Obesity And Overweight. https://www.who.int/news-room/fact-sheets/detail/obesity-and-overweight (2021).
    1. Ferrante AW., Jr. Macrophages, fat, and the emergence of immunometabolism. J. Clin. Invest. 2013;123:4992–4993. doi: 10.1172/JCI73658. - DOI - PMC - PubMed
    1. Russo L, Lumeng CN. Properties and functions of adipose tissue macrophages in obesity. Immunology. 2018;155:407–417. doi: 10.1111/imm.13002. - DOI - PMC - PubMed
    1. Zatterale F, et al. Chronic adipose tissue inflammation linking obesity to insulin resistance and type 2 diabetes. Front. Physiol. 2019;10:1607. doi: 10.3389/fphys.2019.01607. - DOI - PMC - PubMed

Publication types