. 2022 May 10:13:885101.
doi: 10.3389/fimmu.2022.885101. eCollection 2022.

Bromodomain Inhibitors Modulate FcγR-Mediated Mononuclear Phagocyte Activation and Chemotaxis

Affiliations

Bromodomain Inhibitors Modulate FcγR-Mediated Mononuclear Phagocyte Activation and Chemotaxis

Gemma D Banham et al. Front Immunol. .

Abstract

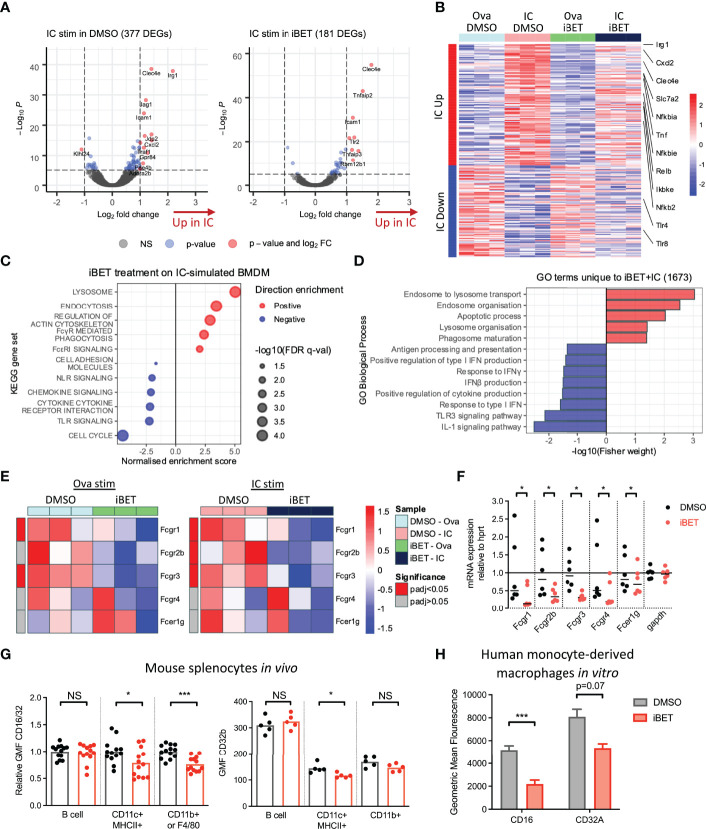
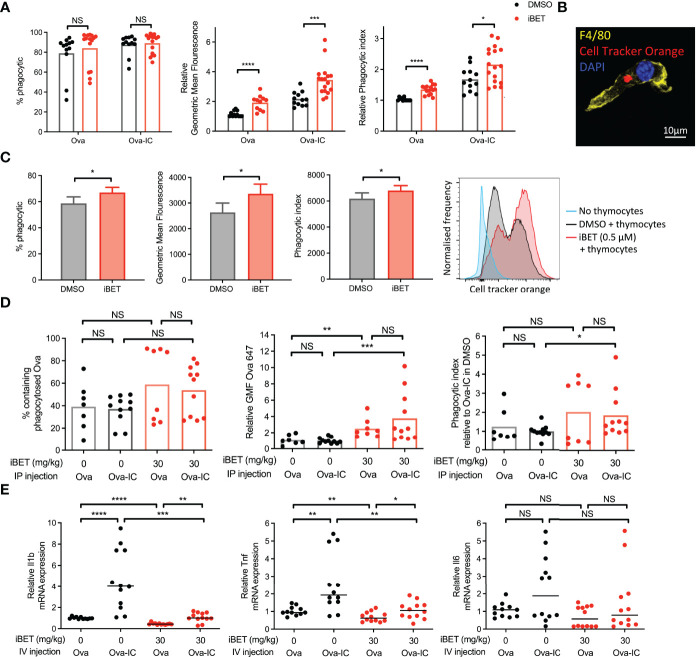
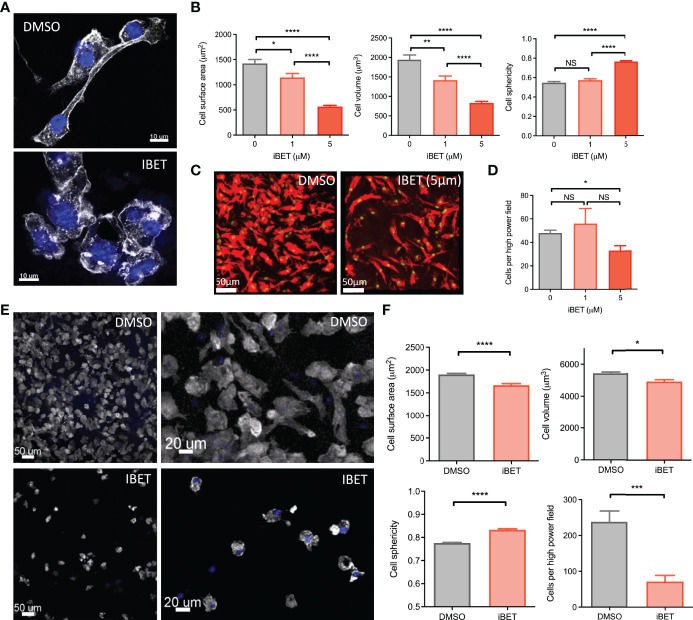
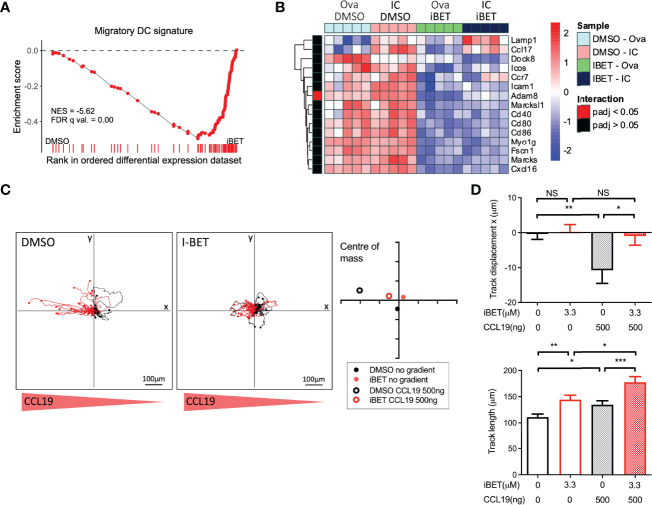
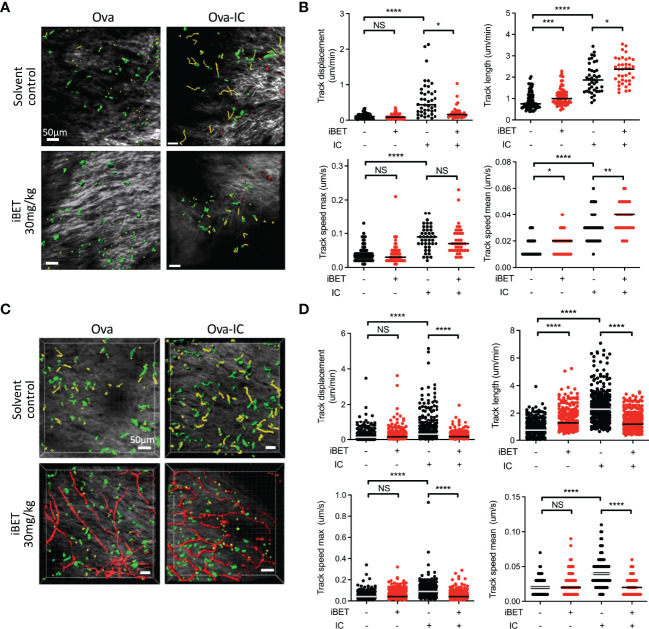
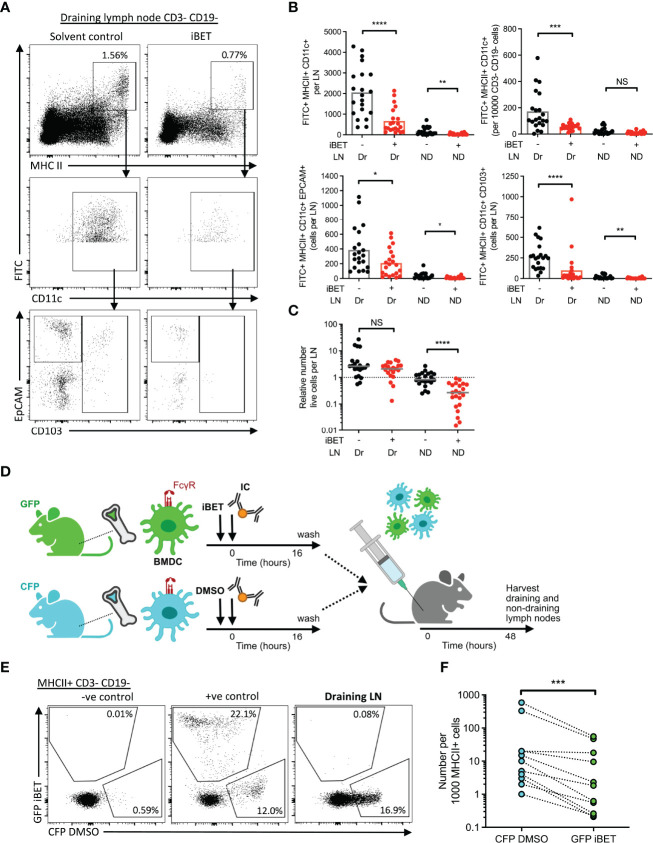
IgG antibodies form immune complexes (IC) that propagate inflammation and tissue damage in autoimmune diseases such as systemic lupus erythematosus. IgG IC engage Fcγ receptors (FcγR) on mononuclear phagocytes (MNP), leading to widespread changes in gene expression that mediate antibody effector function. Bromodomain and extra-terminal domain (BET) proteins are involved in governing gene transcription. We investigated the capacity of BET protein inhibitors (iBET) to alter IgG FcγR-mediated MNP activation. We found that iBET dampened IgG IC-induced pro-inflammatory gene expression and decreased activating FcγR expression on MNPs, reducing their ability to respond to IgG IC. Despite FcγR downregulation, iBET-treated macrophages demonstrated increased phagocytosis of protein antigen, IgG IC, and apoptotic cells. iBET also altered cell morphology, generating more amoeboid MNPs with reduced adhesion. iBET treatment impaired chemotaxis towards a CCL19 gradient in IC-stimulated dendritic cells (DC) in vitro, and inhibited IC-induced DC migration to draining lymph nodes in vivo, in a DC-intrinsic manner. Altogether, our data show that iBET modulates FcγR-mediated MNP activation and migration, revealing the therapeutic potential of BET protein inhibition in antibody-mediated diseases.

Keywords: BET inhibitors; Fcγ-receptor; antibody-mediated inflammation; dendritic cell chemotaxis; systemic lupus erythematosus (SLE).


Conflict of interest statement

Author NS and RP are employees of and shareholders in GlaxoSmithKline (GSK). This study received funding from GSK. GSK had the following involvement with the study: funded RNA sequencing. The remaining authors declare that the research was conducted in the absence of any commercial or financial relationships that could be construed as a potential conflict of interest.

Figures

Figure 1
Figure 1
Gene expression changes induced by FcγR crosslinking are variably affected by iBET. (A) Volcano plots demonstrating DEGs stimulated by Ova-IC vs ovalbumin control, in the absence and presence of iBET, in murine BMDMs. (Adjusted P-value cut-off = 10e-6.) (B) Heat map of top 200 IC-induced DEGs with iBET treatment, with genes of interest involved in inflammatory signalling highlighted. (C) Gene set enrichment analysis (GSEA) of selected KEGG pathways affected by iBET treatment in IC-stimulated BMDMs; all FDR q-value < 0.05. (D) GO biological processes of DEGs unique to combination of IC stimulation and iBET treatment. (E) Heat map of Fcgr expression in BMDMs following iBET treatment, with Ova or Ova-IC stimulation. (F) qPCR of Fcgr expression in BMDMs following iBET treatment. Medians are shown, where points represent expression levels of BMDMs from individual mice (n=6). (G) Flow cytometry quantification of FcγR expression on splenic B cells, dendritic cells (DC) and macrophages in vivo, following systemic treatment with iBET for 3 days. Medians are shown for data representative of 4 independent experiments, points represent individual mice. (H) Flow cytometry quantification of FcγR expression on human monocyte-derived macrophages (moMac) in vitro, following treatment with iBET. Means ± SEM shown for data representative of 2 independent experiments from independent donors. BMDM RNA-seq data is representative of 3 biological replicates from independent mice. Significance testing using Wald test as described in DESeq2 (E), Wilcoxon matched-pairs signed rank test (F), Mann-Whitney U test (G), and two-tailed Student’s t-test (H).
Figure 2
Figure 2
iBET alters macrophage phagocytosis. (A) Flow cytometry quantification for phagocytosis of fluorescent-labelled Ova-AF647 by murine BMDMs after 16 hours. Phagocytic index is the geometric mean fluorescence (GMF) of Ova+ gate (phagocytic macrophages). Means ± SEM shown for data representative of 5 independent experiments, normalized to DMSO-treated BMDMs in Ova, to allow comparison across experiments. (B) Representative image of murine BMDM with phagocytosed fluorescent-labelled (cell tracker orange) apoptotic thymocytes after 4 hours. (C) Flow cytometry quantification for phagocytosis of apoptotic thymocytes by BMDMs. Means ± SEM shown for data representative of 2 independent experiments. (D) Flow cytometry quantification for peritoneal macrophage accumulation of fluorescent-labelled immune complexed or soluble antigens in vivo. Medians are shown for data representative of 3 independent experiments, points represent individual mice. Relative values to untreated Ova-IC stimulated mice reported due to interexperimental variation in Ova-AF647 fluorescence. (E) qPCR of inflammatory cytokine expression in whole kidney tissue following iBET treatment and IC stimulation. Medians are shown from 2 independent experiments, where points represent expression levels from individual mice. Significance testing using two-tailed Student’s t-test (A, C), Mann-Whitney U test (D, E).
Figure 3
Figure 3
iBET alters MNP morphology and adhesion. (A) Representative images showing effect of iBET treatment on murine BMDM morphology in vitro. DAPI stain shown in blue, phalloidin in white. (B) Quantification of BMDM morphology by confocal microscopy of murine BMDMs following treatment with iBET for 24 hours. (C) Representative image change in BMDM adhesion after iBET treatment in vitro; phalloidin (red), DAPI (green). (D) Cells per high powered field observed after iBET treatment. Means ± SEM shown for data representative of 5 high-powered fields per condition. Means ± SEM shown for data representative of 5 high-powered fields per condition (A–D). (E) Representative images showing effect of iBET treatment on murine BMDC morphology and adhesion in vitro. DAPI stain shown in blue, phalloidin in white. (F) Quantification of BMDC adhesion and morphology by confocal microscopy of murine BMDCs following treatment with iBET (3.3μM) for 24 hours. Means ± SEM shown for data representative of 10 high-powered fields per condition. Significance testing using two-tailed Student’s t-test (B, D, F).
Figure 4
Figure 4
iBET limits DC migration in vitro. (A) GSEA of gene signature specific to migratory DCs, curated from scRNAseq data, in iBET treated murine BMDCs. Gene signature derived from Brown et al. (2019), GEO: GSE137710. (B) Heat map of expression of selected genes involved in DC migration and maturation. (C) Representative migration tracks of Ova-IC stimulated BMDCs over 2 hours, and average centre of mass in a 3D collagen matrix with or without a 500ng CCL-19 gradient. Red track marks represent cells with final displacement in the direction of the chemokine gradient. (D) Selected chemotaxis parameters from (C). Means ± SEM shown for data representative of 3 independent experiments, including at least 180 tracked BMDCs for each condition. RNA-seq data is representative of 5 biological replicates from independent mice. Significance testing using Student’s t-test.
Figure 5
Figure 5
iBET impairs IC-associated DC chemotaxis in vivo. (A) Representative images showing movement of CD11c-YFP labelled dermal DCs in mice footpads by two-photon microscopy. Following treatment with iBET or solvent control, CD11c-YFP reporter mice were injected with Ova in one hind footpad and Ova-IC in the contralateral footpad, with imaging under isoflurane anaesthesia 18 hours later. Green shows DCs, yellow shows representative migration tracks of respective DCs. (B) Quantification of chemotaxis of dermal DCs in mice footpads. (C) Representative images showing movement of CD11c-YFP labelled dermal DCs and (D) quantification of chemotaxis in footpads of FcγRIIb -/- mice. Blood vessels labelled with Qdot® probe (red), shown where successful. For all, medians are shown for data representative of 2 independent experiments, points show individual tracked dermal DCs. Significance testing using Mann-Whitney U test.
Figure 6
Figure 6
iBET impairs IC-stimulated DC migration to lymph nodes. (A) Representative flow cytometry plots of draining lymph nodes of mice from FITC paint model. FITC paint was applied topically to shaved skin of mice to label dermal DCs, stimulated and treated with IC and iBET with appropriate controls, and draining lymph nodes were harvested 48 hours later. (B) Flow cytometry quantification of dermal DCs from draining and non-draining lymph nodes from FITC paint model. Medians are shown for data representative of 4 independent experiments, points show individual mice. (C) Lymph node cell number in FITC paint model following iBET treatment. (D) Diagram of experimental set up for murine BMDC transfer model. BMDC were cultured from fluorescent-labelled mice and treated with iBET or DMSO followed by transfer to wild-type mice. Recipient mice were culled 48 hours alter and lymph nodes were harvested. (E) Representative flow cytometry plot of CFP and GFP staining of DCs in draining lymph nodes. (F) Flow cytometry quantification of DC composition in draining lymph nodes. Data shown is representative of 10 mice from 3 independent experiments. Significance testing using Mann-Whitney U test (B, C) and Wilcoxon matched-pairs sign rank test (E).

References

    1. Madhok R, Wu O. Systemic Lupus Erythematosus. BMJ Clin Evid (2007) 2007:929–39. doi: 10.1056/nejmra071297 - DOI - PubMed
    1. Nimmerjahn F, Ravetch J. Fc-Receptors as Regulators of Immunity. Adv Immunol (2007) 96:179–204. doi: 10.1016/S0065-2776(07)96005-8 - DOI - PubMed
    1. Smith KGC, Clatworthy MR. Fcγriib in Autoimmunity and Infection: Evolutionary and Therapeutic Implications. Nat Rev Immunol (2010) 10:328–43. doi: 10.1038/nri2762 - DOI - PMC - PubMed
    1. Bolland S, Ravetch JV. Spontaneous Autoimmune Disease in Fcγriib-Deficient Mice Results From Strain-Specific Epistasis. Immunity (2000) 13:277–85. doi: 10.1016/S1074-7613(00)00027-3 - DOI - PubMed
    1. Brownlie RJ, Lawlor KE, Niederer HA, Cutler AJ, Xiang Z, Clatworthy MR, et al. . Distinct Cell-Specific Control of Autoimmunity and Infection by Fcγriib. J Exp Med (2008) 205:883. doi: 10.1084/JEM.20072565 - DOI - PMC - PubMed

Publication types

LinkOut - more resources