

Autophagy-Related Genes Are Involved in the Progression and Prognosis of Asthma and Regulate the Immune Microenvironment
- PMID: 35619697
- PMCID: PMC9127139
- DOI: 10.3389/fimmu.2022.897835
Autophagy-Related Genes Are Involved in the Progression and Prognosis of Asthma and Regulate the Immune Microenvironment
Abstract
Background: Autophagy has been proven to play an important role in the pathogenesis of asthma and the regulation of the airway epithelial immune microenvironment. However, a systematic analysis of the clinical importance of autophagy-related genes (ARGs) regulating the immune microenvironment in patients with asthma remains lacking.
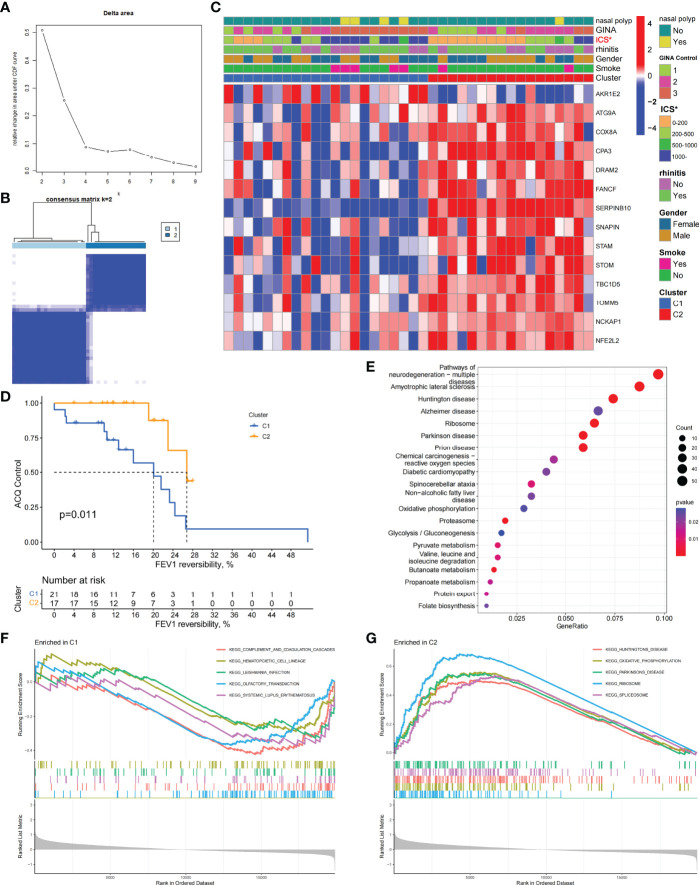
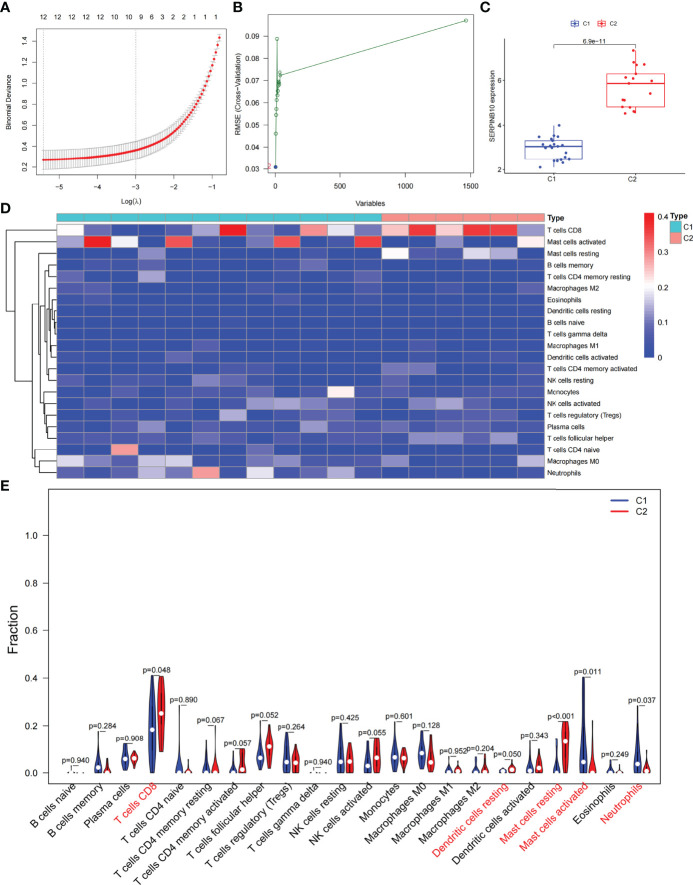
Methods: Clustering based on the k-means unsupervised clustering method was performed to identify autophagy-related subtypes in asthma. ARG-related diagnostic markers in low-autophagy subtypes were screened, the infiltration of immune cells in the airway epithelium was evaluated by the CIBERSORT, and the correlation between diagnostic markers and infiltrating immune cells was analyzed. On the basis of the expression of ARGs and combined with asthma control, a risk prediction model was established and verified by experiments.
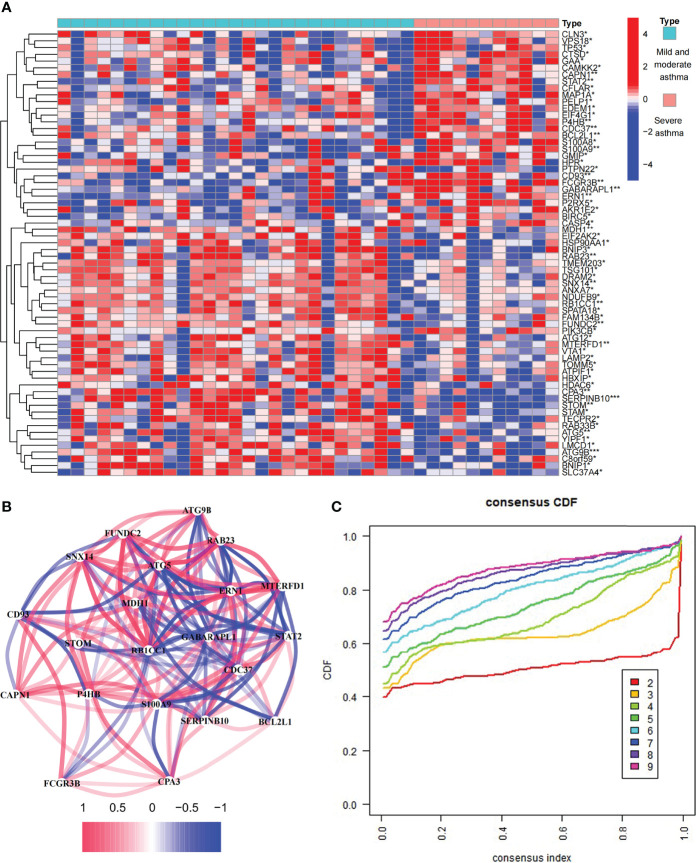
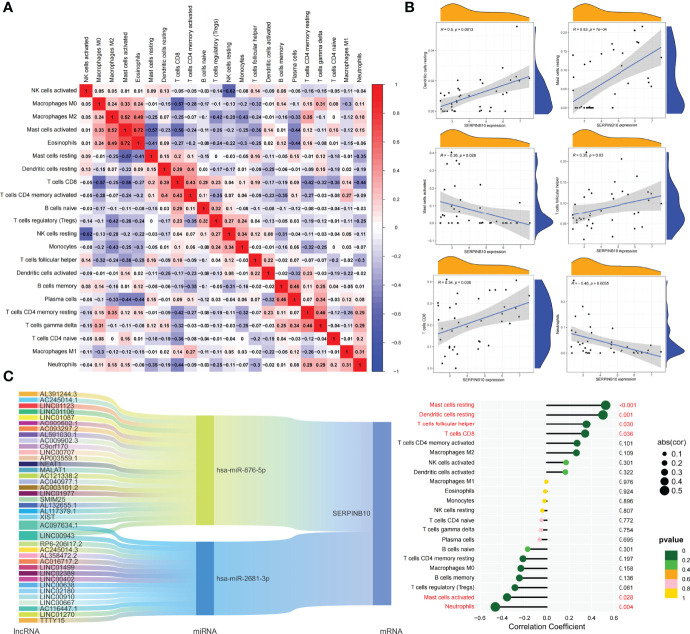
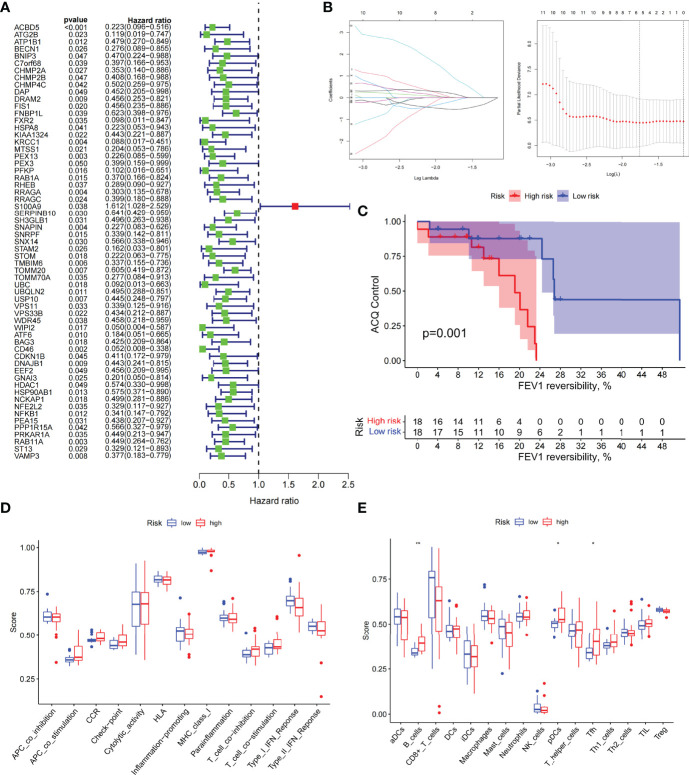
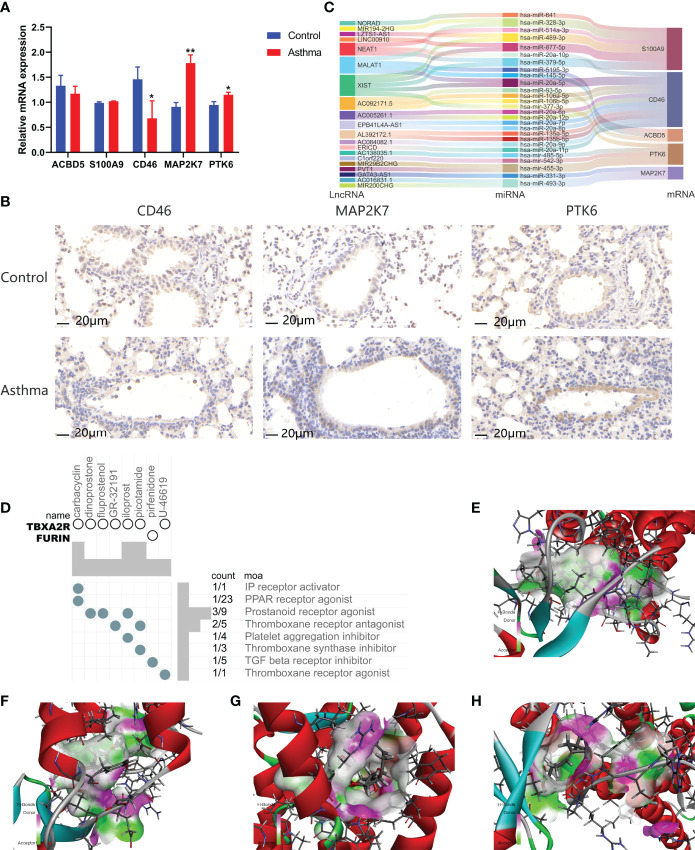
Results: A total of 66 differentially expressed ARGs and 2 subtypes were identified between mild to moderate and severe asthma. Significant differences were observed in asthma control and FEV1 reversibility between the two subtypes, and the low-autophagy subtype was closely associated with severe asthma, energy metabolism, and hormone metabolism. The autophagy gene SERPINB10 was identified as a diagnostic marker and was related to the infiltration of immune cells, such as activated mast cells and neutrophils. Combined with asthma control, a risk prediction model was constructed, the expression of five risk genes was supported by animal experiments, was established for ARGs related to the prediction model.
Conclusion: Autophagy plays a crucial role in the diversity and complexity of the asthma immune microenvironment and has clinical value in treatment response and prognosis.
Keywords: asthma; autophagy-related genes; diagnostic model; immune cell; prognosis.
Copyright © 2022 Yang, Kong, Zong, Li, Lyu, Li, Li, Zhu, Chen, Zhao and Wang.
Conflict of interest statement
The authors declare that the research was conducted in the absence of any commercial or financial relationships that could be construed as a potential conflict of interest.
Figures
Similar articles
-
Identification of pyroptosis-related subtypes and establishment of prognostic model and immune characteristics in asthma.Front Immunol. 2022 Jul 28;13:937832. doi: 10.3389/fimmu.2022.937832. eCollection 2022. Front Immunol. 2022. PMID: 35967302 Free PMC article.
-
Identification of a Five Autophagy Subtype-Related Gene Expression Pattern for Improving the Prognosis of Lung Adenocarcinoma.Front Cell Dev Biol. 2021 Nov 18;9:756911. doi: 10.3389/fcell.2021.756911. eCollection 2021. Front Cell Dev Biol. 2021. PMID: 34869345 Free PMC article.
-
Construction of Autophagy-Related Gene Classifier for Early Diagnosis, Prognosis and Predicting Immune Microenvironment Features in Sepsis by Machine Learning Algorithms.J Inflamm Res. 2022 Nov 8;15:6165-6186. doi: 10.2147/JIR.S386714. eCollection 2022. J Inflamm Res. 2022. PMID: 36386585 Free PMC article.
-
Autophagy in airway diseases: a new frontier in human asthma?Allergy. 2016 Jan;71(1):5-14. doi: 10.1111/all.12761. Epub 2015 Oct 20. Allergy. 2016. PMID: 26335713 Free PMC article. Review.
-
Crosstalk between autophagy and immune cell infiltration in the tumor microenvironment.Front Med (Lausanne). 2023 Feb 6;10:1125692. doi: 10.3389/fmed.2023.1125692. eCollection 2023. Front Med (Lausanne). 2023. PMID: 36814780 Free PMC article. Review.
Cited by
-
Decreased TLR7 expression was associated with airway eosinophilic inflammation and lung function in asthma: evidence from machine learning approaches and experimental validation.Eur J Med Res. 2024 Feb 10;29(1):116. doi: 10.1186/s40001-023-01622-5. Eur J Med Res. 2024. PMID: 38341589 Free PMC article.
-
Deciphering a mitochondria-related signature to supervise prognosis and immunotherapy in hepatocellular carcinoma.Front Immunol. 2022 Dec 2;13:1070593. doi: 10.3389/fimmu.2022.1070593. eCollection 2022. Front Immunol. 2022. PMID: 36544763 Free PMC article.
-
Food Allergy Genetics and Epigenetics: A Review of Genome-Wide Association Studies.Allergy. 2025 Jan;80(1):106-131. doi: 10.1111/all.16429. Epub 2024 Dec 19. Allergy. 2025. PMID: 39698764 Free PMC article. Review.
-
Identification of potential key autophagy-related genes in asthma with bioinformatics approaches.Am J Transl Res. 2022 Oct 15;14(10):7350-7361. eCollection 2022. Am J Transl Res. 2022. PMID: 36398258 Free PMC article.
-
Serum autophagy protein 5 is positively related to T helper 2/T helper 1 ratio, inflammation, and exacerbation in adult asthma patients.Allergy Asthma Clin Immunol. 2023 Aug 29;19(1):77. doi: 10.1186/s13223-023-00821-3. Allergy Asthma Clin Immunol. 2023. PMID: 37644509 Free PMC article.