. 2022 May 10:13:890019.
doi: 10.3389/fimmu.2022.890019. eCollection 2022.

Landscape of Immune Cells Heterogeneity in Liver Transplantation by Single-Cell RNA Sequencing Analysis

Affiliations

Landscape of Immune Cells Heterogeneity in Liver Transplantation by Single-Cell RNA Sequencing Analysis

Xinqiang Li et al. Front Immunol. .

Abstract

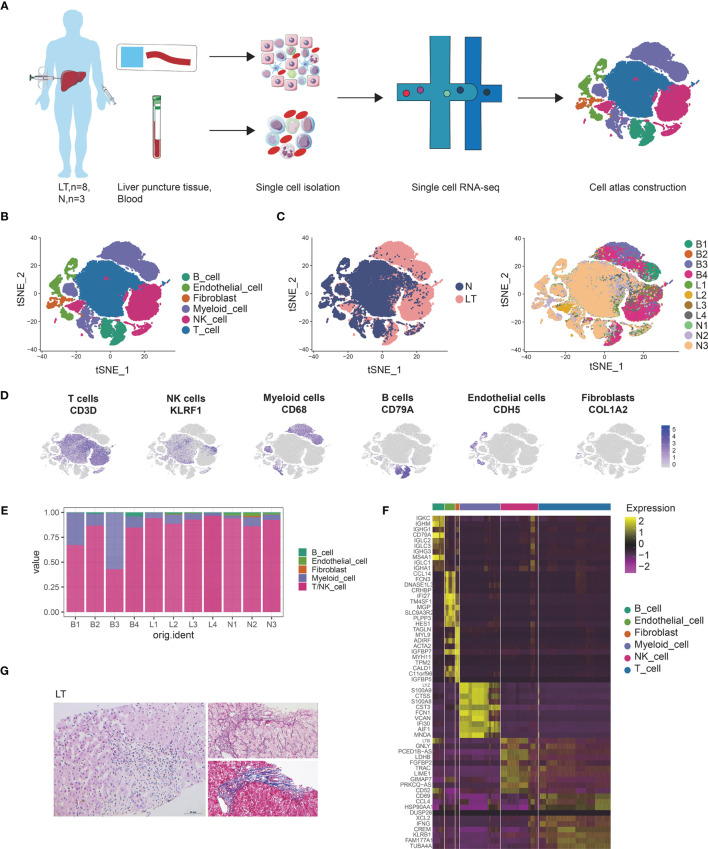
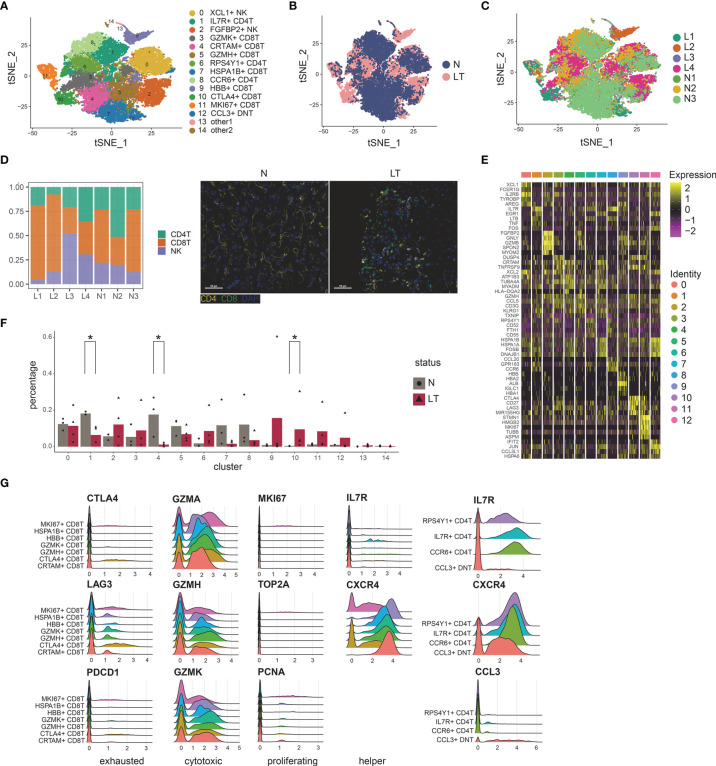
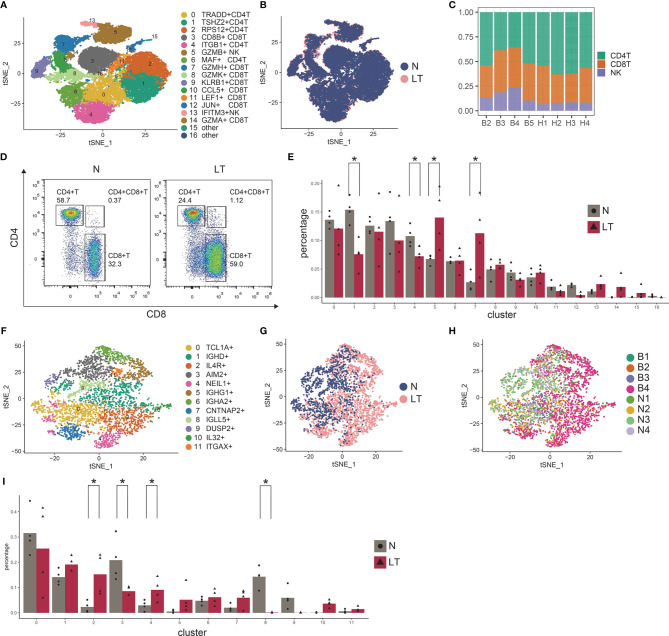
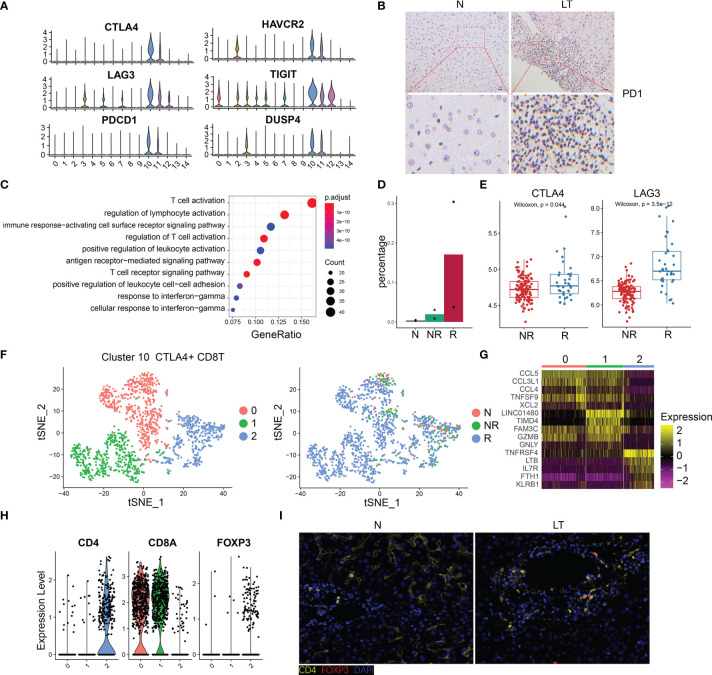
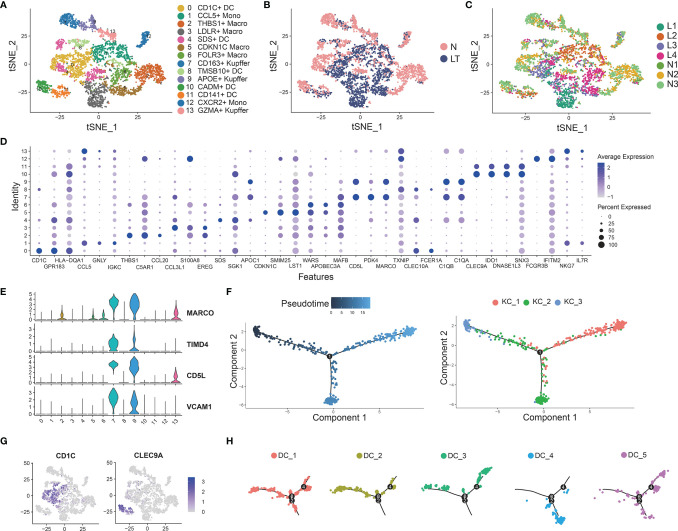
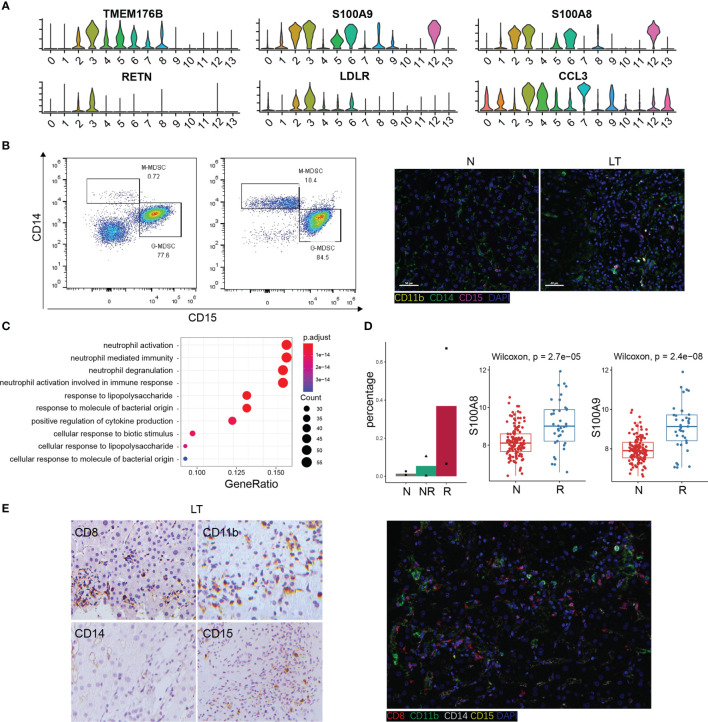
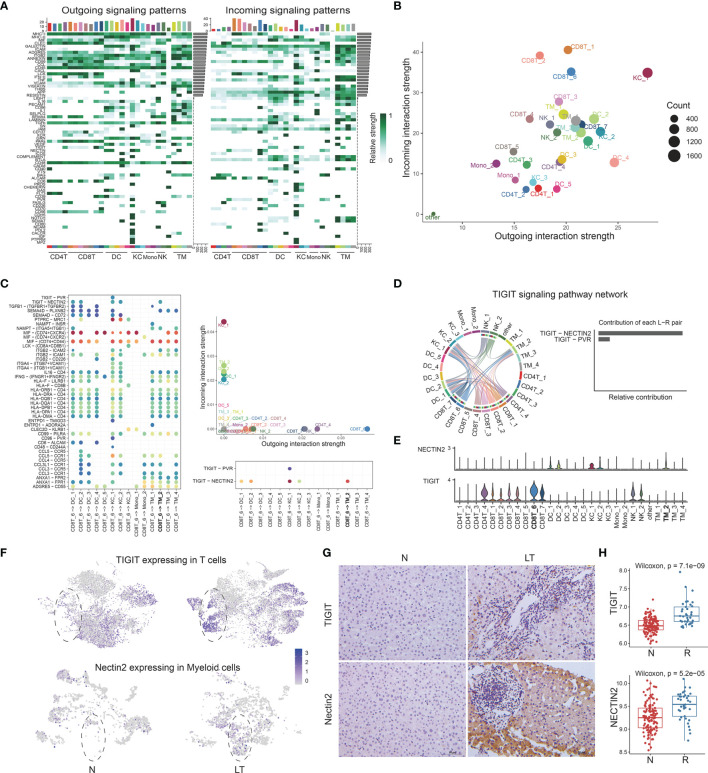
Rejection is still a critical barrier to the long-term survival of graft after liver transplantation, requiring clinicians to unveil the underlying mechanism of liver transplant rejection. The cellular diversity and the interplay between immune cells in the liver graft microenvironment remain unclear. Herein, we performed single-cell RNA sequencing analysis to delineate the landscape of immune cells heterogeneity in liver transplantation. T cells, NK cells, B cells, and myeloid cell subsets in human liver and blood were enriched to characterize their tissue distribution, gene expression, and functional modules. The proportion of CCR6+CD4+ T cells increased within an allograft, suggesting that there are more memory CD4+ T cells after transplantation, in parallel with exhausted CTLA4+CD8+ T and actively proliferating MKI67+CD8+ T cells increased significantly, where they manifested heterogeneity, distinct function, and homeostatic proliferation. Remarkably, the changes of CD1c+ DC, CADM+ DC, MDSC, and FOLR3+ Kupffer cells increase significantly, but the proportion of CD163+ Kupffer, APOE+ Kupffer, and GZMA+ Kupffer decreased. Furthermore, we identified LDLR as a novel marker of activated MDSC to prevent liver transplant rejection. Intriguingly, a subset of CD4+CD8+FOXP3+ T cells included in CTLA4+CD8+ T cells was first detected in human liver transplantation. Furthermore, intercellular communication and gene regulatory analysis implicated the LDLR+ MDSC and CTLA4+CD8+ T cells interact through TIGIT-NECTIN2 signaling pathway. Taken together, these findings have gained novel mechanistic insights for understanding the immune landscape in liver transplantation, and it outlines the characteristics of immune cells and provides potential therapeutic targets in liver transplant rejection.

Keywords: CD8 T cell; MDSC; immune; liver tranpslant; single cell RNA sequence.


Conflict of interest statement

The authors declare that the research was conducted in the absence of any commercial or financial relationships that could be construed as a potential conflict of interest.

Figures

Figure 1
Figure 1
Single cell atlas of human liver transplantation. (A) Schematic diagram of scRNA-seq analysis workflow. (B) tSNE plots for cell type identification of 68,174 high-quality cells. (C) tSNE plot colors by spatial distribution of cells in normal (N) and liver transplantation (LT) tissues. (D) Expression of canonical cell markers including CD3D, KLEF1, CD68, CD79A, CDH5, and COL1A2. (E) Barplots showing the proportion of cell types in each sample. (F) Heatmap showing the top 10 genes of each cell type. (G) HE, Masson, and reticular staining of liver transplantation samples.
Figure 2
Figure 2
Identifying T and NK cell subpopulations in liver tissue. (A) Clustering of 31,300 T and NK cells and cell annotation. (B) tSNE plot colors by spatial distribution of cells in normal (n=3) and liver transplantation (n=4) human tissues. (C) tSNE plot colors by spatial distribution of cells in 7 samples. (D) Barplots showing the proportion of CD4+ T cells, CD8+ T cells, and NK cells in each sample. Immunofluorescence including CD4 and CD8 in normal and liver transplantation. (E) Heatmap of each T and NK cells cluster top 5 marker genes. (F) Fractions of T, NK cell subpopulations in normal (n=3) and liver transplantation (n=4) samples (* means p < 0.05). (G) RidgePlots showing the expression of exhausted, cytotoxic, proliferating, and helper T cells of CD8+ T cells and CD4+ T cells.
Figure 3
Figure 3
Identifying T and NK cell subpopulations in PBMC. (A) Clustering of 30,465 T and NK cells and cell annotation. (B) tSNE plot colors by spatial distribution of cells in normal (n=4) and liver transplantation (n=4) human tissues. (C) tSNE plot colors by spatial distribution of cells in 8 samples. (D) Flow cytometry analysis of CD4+ T cells and CD8+ T cells fraction in normal and liver transplantation tissues. (E) Fractions of T, NK cell subpopulations in normal (n=4) and liver transplantation (n=4) samples (* means p < 0.05). (F) Clustering of 3786 B cells. (G) tSNE plot colors by spatial distribution of cells in normal (n=4) and liver transplantation (n=4) human tissues. (H) tSNE plot colors by spatial distribution of cells in 8 samples. (I) Fractions of B cell subpopulations in normal (n=4) and liver transplantation (n=4) samples (* means p < 0.05).
Figure 4
Figure 4
The specific phenotypes of exhausted CD8 T cells. (A) Expression of differentially expressed genes in exhausted CD8 T cells. (B) Immunohistology of PD1 in normal and liver transplantation tissue. (C) Enrichment analysis of Gene Ontology terms for differentially expressed genes in exhausted CD8 T cells. (D) Fractions of exhausted CD8 T cells in normal (n=3), stable (n=2), and rejection samples (n=2) after liver transplantation. (E) Bulk RNA-seq expression of CTLA4 and LAG3 in stable (N, n=129) and rejection samples (R, n=37) after liver transplantation. (F) tSNE plots showing re-clustering of exhausted CD8 T cells. (G) Heatmap of each cluster’s top 5 marker genes. (H) Expression of CD4, CD8A and FOXP3 among clusters. (I) Immunofluorescence including CD4 and FOXP3 in normal and liver transplantation.
Figure 5
Figure 5
Identifying myeloid cell subpopulations in liver tissue. (A) Clustering of 4883 myeloid cells and cell annotation. (B) tSNE plots colors by spatial distribution of cells in normal (n=3) and liver transplantation (n=4) human tissues. (C) tSNE plots colors by spatial distribution of cells in 7 samples. (D) Dotplots of each cluster of myeloid cells’ top 5 marker genes. (E) Gene expression of Kupffer cells’ canonical markers across myeloid cells. (F) Pseudotime analysis with identified 3 Kupffer groups. (G) Gene expression of dendritic cells’ canonical markers across myeloid cells. (H) Pseudotime analysis with 5 dendritic cell groups.
Figure 6
Figure 6
The specific phenotypes of LDLR+ MDSC. (A) Expression of differentially expressed genes in LDLR+ MDSC. (B) Flow cytometry analysis of MDSC fraction in normal and liver transplantation PBMC, and immunofluorescence including CD11b, CD14, and CD15 in normal and liver transplantation. (C) Enrichment analysis of Gene Ontology (GO) terms for differentially expressed genes in LDLR+ MDSC. (D) Fractions of LDLR+ MDSC in normal (n=3), stable (n=2), and rejection samples (n=2) after liver transplantation. Bulk RNA-seq expression of S100A8 and S100A9 in stable (n=129) and rejection samples (n=37) after liver transplantation. (E) Immunohistology of CD8, CD11b, CD14, and CD15 in liver transplantation tissue, and immunofluorescence including CD8, CD11b, CD14, and CD15 in liver transplantation.
Figure 7
Figure 7
The multi-lineage interactome in the liver tissue. (A) Overview of outgoing and incoming signaling patterns among T, NK, and myeloid cell groups in liver transplantation tissue. (B) Projecting signaling pathways with bubble plots. Each dot represents the communication network of one signaling pathway. Dot size is proportional to the overall communication probability. (C) Dotplots showing the interactions between exhausted CD8+ T cells and myeloid cells in liver transplantation. (D) The distribution and contribution of TIGIT signaling pathway network. (E) Expression of TIGIT and NECTIN2 among T, NK, and myeloid cells. (F) tSNE plots showing the TIGIT expression in exhausted CD8+ T cells and the NECTIN2 expression in LDLR+ macrophage cells. (G) Immunohistology of TIGIT and NECTIN2 in normal and liver transplantation tissue. (H) Bulk RNA-seq expression of TIGIT and NECTIN2 in stable (n=129) and rejection samples (n=37) after liver transplantation.

References

    1. Meirelles Junior RF, Salvalaggio P, Rezende MB, Evangelista AS, Guardia BD, Matielo CE, et al. . Liver Transplantation: History, Outcomes and Perspectives. Einstein (Sao Paulo) (2015) 13(1):149–52. doi: 10.1590/S1679-45082015RW3164 - DOI - PMC - PubMed
    1. Starzl TE, Fung JJ. Themes of Liver Transplantation. Hepatology (2010) 51(6):1869–84. doi: 10.1002/hep.23595 - DOI - PMC - PubMed
    1. Duong N, Bajaj JS. The Impact of the Gut Microbiome on Liver Transplantation. Curr Opin Organ Transplant (2021) 26(6):587–94. doi: 10.1097/MOT.0000000000000930 - DOI - PMC - PubMed
    1. Adam R, Karam V, Cailliez V, JG OG, Mirza D, Cherqui D, et al. . 2018 Annual Report of the European Liver Transplant Registry (ELTR) - 50-Year Evolution of Liver Transplantation. Transpl Int (2018) 31(12):1293–317. doi: 10.1111/tri.13358 - DOI - PubMed
    1. Delgado JF, Sanchez V, de la Calzada CS. Acute Rejection After Heart Transplantation. Expert Opin Pharmacother (2006) 7(9):1139–49. doi: 10.1517/14656566.7.9.1139 - DOI - PubMed

Publication types