. 2022 May 23:2:56.
doi: 10.1038/s43856-022-00113-8. eCollection 2022.

SARS-CoV-2 detection using a nanobody-functionalized voltammetric device

Affiliations

SARS-CoV-2 detection using a nanobody-functionalized voltammetric device

Quentin Pagneux et al. Commun Med (Lond). .

Abstract

Background: An ongoing need during the COVID-19 pandemic has been the requirement for accurate and efficient point-of-care testing platforms to distinguish infected from non-infected people, and to differentiate SARS-CoV-2 infections from other viruses. Electrochemical platforms can detect the virus via its envelope spike protein by recording changes in voltammetric signals between samples. However, this remains challenging due to the limited sensitivity of these sensing platforms.

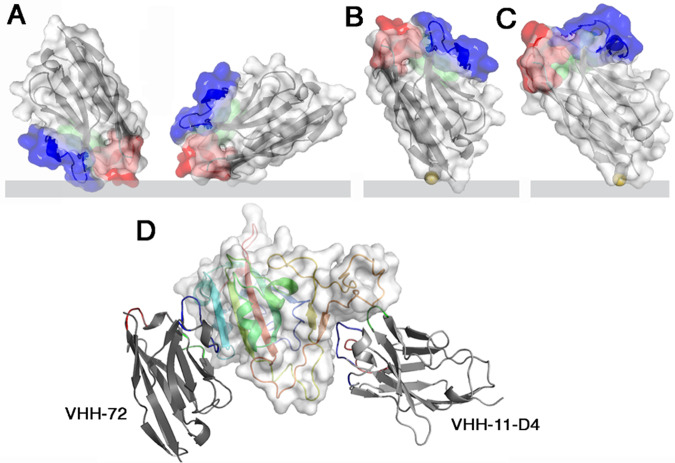
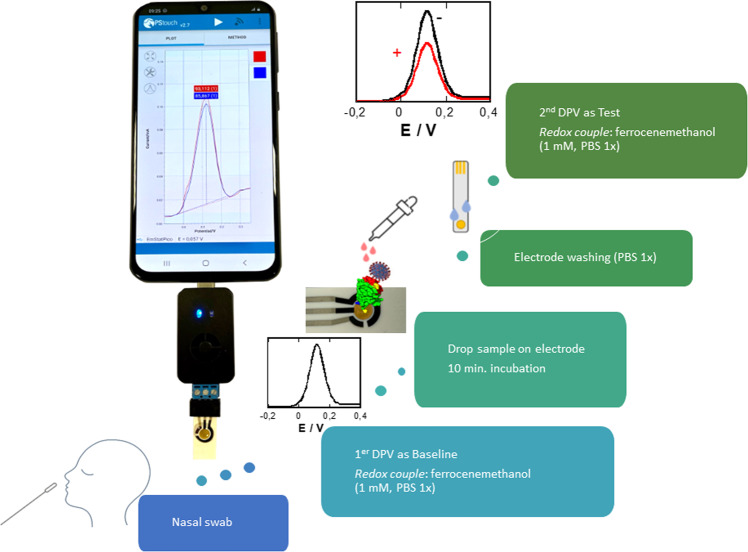
Methods: Here, we report on a nanobody-functionalized electrochemical platform for the rapid detection of whole SARS-CoV-2 viral particles in complex media such as saliva and nasopharyngeal swab samples. The sensor relies on the functionalization of gold electrode surface with highly-oriented Llama nanobodies specific to the spike protein receptor binding domain (RBD). The device provides results in 10 min of exposure to 200 µL of unprocessed samples with high specificity to SARS-CoV-2 viral particles in human saliva and nasopharyngeal swab samples.

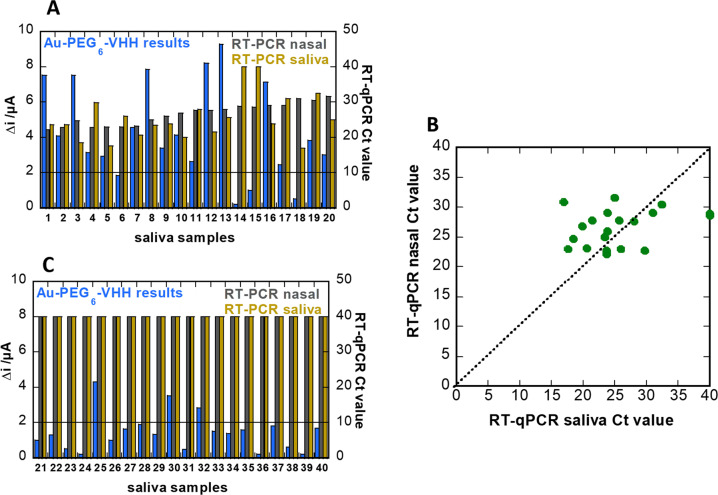
Results: The developed sensor could discriminate between different human coronavirus strains and other respiratory viruses, with 90% positive and 90% negative percentage agreement on 80 clinical samples, as compared to RT-qPCR.

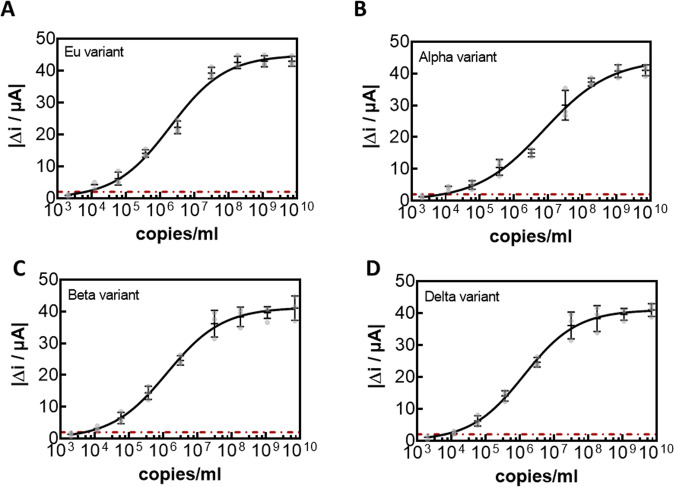
Conclusions: We believe this diagnostic concept, also validated for RBD mutants and successfully tested on Delta variant samples, to be a powerful tool to detect patients' infection status, easily extendable to other viruses and capable of overcoming sensing-related mutation effects.

Keywords: Diagnostic markers; Nanobiotechnology.


Conflict of interest statement

Competing interestsThe authors declare no competing interests.

Figures

Fig. 1
Fig. 1. Different generations of nanobodies were used in this work and integrated into the electrochemical sensing device.
Surface and ribbon views of the VHHs (the three CDRs are colored red, green, blue, respectively): A VHH-72 can bind the sensor in different orientations. B VHH-72-C13 is oriented on the sensor by the Cys link (yellow). The direct linkage to the gold electrode is shown rather than the thiol-PEG-MAL linker, considered more meaningful. C VHH11-D4-C13 is oriented on the sensor surface by the Cys link (yellow). D Ribbon views of the two VHHs bound to the Spike RBD (rainbow colored, white surface). Note the large distance between the two epitopes. VHHs affinity constants determined by BLI: VHH-72 (KD = 36.6 nM), VHH-72-13C (KD = 12.1 nM), VHH-H11D4-13C (KD = 5 nM).
Fig. 2
Fig. 2. Design and characterisation of VHH-72-13C modified gold electrodes.
A Direct linkage via cysteine groups of VHH-72-13C. B Maleimide-thiol based grafting onto a functional PEG6 spacer. C C1s high resolution XPS spectra of Au-VHH-72-C13 and D Au-PEG6-VHH-72-C13 surfaces. E Differential pulse voltammograms (DPVs) of Au-VHH-72-C13 (black) and Au-PEG6-VHH-72-C13 (grey) in ferrocenemethanol (1 mM in 0.1 M PBS, pH 7.4). F Au-PEG6-MAL interface modified with 6-(ferrocenyl) hexanethiol and the corresponding cyclic voltammogram in PBS (0.1 M PBS, pH 7.4). Control: immobilization of ferrocene (grey line) scan rate: 100 mV s−1.
Fig. 3
Fig. 3. Nanobody-based COVID-19 voltammetric sensor.
Schematic of the sensor concept together with working principle of the sensor and solutions used. Incubation time of sample before test via differential pulse voltammogram using ferrocenemethanol (1 mL, PBS 1×) as a redox probe is 10 min.
Fig. 4
Fig. 4. Performance of Au-VHH-72-C13, Au-PEG6-VHH-72-C13, and Au-MPA-VHH-72 electrodes.
A Differential pulse voltammograms (DPVs) of Au-PEG6-VHH-72-C13 in ferrocenemethanol (1 mM in 0.1 M PBS, pH 7.4) initially (black) and after addition of RBD (1.2, 2.5, 5, 10, 25, 100, 1770, 5000 nM). B Dose–response curve of RBD of Au-PEG6-VHH-C13 as well as Au-VHH-C13 electrodes. Data were fitted to a Langmuir adsorption isotherm assuming a 1:1 complex between the antigen (RBD) from the solution and the linked VHH-72 receptor. C Surface attachment strategy of VHH onto 3-mercaptopropionic acid-modified gold (Au-MPA) interfaces using EDC/NHS coupling chemistry (protein, linkers, and gold surface are not drawn to scale with respect to each other). D Dose–dependent response curve of Au-MPA-VHH electrode to increasing RBD concentrations. The results are expressed as the mean ± SEM of at least 3 independent samples for each group.
Fig. 5
Fig. 5. Performance of Au-PEG6-VHH-72-C13 and Au-VHH-72-C13 electrodes on cultured SARS-CoV-2 EU variant.
A Dose-dependent response curves of 10-fold dilutions (D1-D9) of SARS-CoV-2, clade 20 A.EU2 (EU variant) on VHH-72-13C modified electrodes and VHH-72 for comparison. B Correlation of qRT-PCR Ct values and viral RNA copies mL−1. C Correlation of viral RNA copies mL−1 with plaque forming units of SARS-CoV-2 as a measure of infectivity. For this, Vero E6 cells were infected with 10-fold dilutions of a SARS-CoV-2 isolate clade 20 A.EU2 (EU variant). Calculation of estimated virus concentration was carried out by the Spearman and Karber method, and expressed as TCID50/mL (50% tissue culture infectious dose). TCID50/mL values were transformed to PFU mL−1 by using the formula PFU mL−1 = TCID50/mL × 0.7 (https://www.lgcstandards-atcc.org/support/faqs/48802/Converting%20TCID50%20to%20plaque%20forming%20units%20PFU-124.aspx). RNA extraction and qRT-PCR (target IP4) were performed in duplicate for each dilution. D Dose-dependent response curves of viral copies of SARS-CoV-2, clade 20 A.EU2 (EU variant) on VHH-72-13C modified electrodes. The results are expressed as the mean ± SEM of at least 3 independent electrodes for each group.
Fig. 6
Fig. 6. Dose-dependent response curves of Au-PEG6-VHH-72-C13 electrode for different SARS-CoV-2 cultured clades.
A clade 20 A.EU2 (EU variant). B 20I/501Y.V1 (Alpha variant). C clade 20H/501Y.V2 (Beta variant). D B.1.617.2+AY.1+AY.2 (Delta variant). All results are expressed as the mean ± SEM of at least 3 independent electrodes for each group.
Fig. 7
Fig. 7. Performance of Au-PEG6-VHH-72-C13 sensor on clinical samples.
A Current response difference for nasopharyngeal swab samples from COVID-19 positive patients (n = 20) and COVID-19 negative patients (n = 20) against the golden standard, RT-PCR Ct values. Cut-off level of positivity was set at Ct = 33. Cycle threshold value of RT-PCR (grey). The current cut-off value for positive samples was set to 2 µA. Each patient sample was performed on a new electrode. The results are expressed as the mean ± SEM of 3 independent measurements for each sample. B ROC curve from clinical data and positive and negative RT-PCR identification. C Selectivity of the SARS-CoV-2 electrochemical diagnostics towards other viruses. The results are expressed as the mean ± SEM of 3 independent measurements for each sample.
Fig. 8
Fig. 8. Performance of sensor in saliva clinical samples.
A Response diagram for saliva samples from COVID-19 positive patients (n = 20) as recorded on Au-PEG6-VHH electrodes (blue). Cycle threshold value of RT-qPCR on nasal swab samples of same patient (grey), as well as RT-PCR of saliva (brown). The current cut-off value for positive samples was 2 µA. B Collection of RT-qPCR values of nasopharyngeal swab samples vs. saliva samples collected from the same patient and measured in the hour after sample taking. C Response diagram for saliva samples from COVID-19 negative patients (n = 20) as recorded on Au-PEG6-VHH electrodes (blue) and Cycle threshold value of RT-PCR on nasal swab samples (grey), and saliva (brown).

References

    1. Williams E, Bond K, Zhang B, Butland M, Williamson DA. Saliva as a non-invasive specimen for detection of SARS-CoV-2. J. Clin. Microbiol. 2020;58:e00776–00720. - PMC - PubMed
    1. Wyllie AL, Fournier J, Arnau Casanovas-Massana PD, et al. Saliva or nasopharyngeal swab specimens for detection of SARS-CoV-2. New Engl. J. Med. 2020;383:1283–1286. doi: 10.1056/NEJMc2016359. - DOI - PMC - PubMed
    1. Bullard J, Dust K, Funk D, et al. Predicting infectious SARS-CoV-2 from diagnostic samples. Clin. Infect. Dis. 2020;71:2663–2666. doi: 10.1093/cid/ciaa638. - DOI - PMC - PubMed
    1. Vogels CBF, Brito AF, Anne L, et al. Analytical sensitivity and efficiency comparisons of SARS-CoV-2 RT–qPCR primer–probe sets. Nat. Microbiol. 2020;5:1299–1305. doi: 10.1038/s41564-020-0761-6. - DOI - PMC - PubMed
    1. Walls AC, Park Y-J, Tortorici MA, Wall A, McGuire AT, Vessler D. Structure, function, and antigenicity of the SARS-CoV-2 spike glycoprotein. Cell. 2020;181:281–292. doi: 10.1016/j.cell.2020.02.058. - DOI - PMC - PubMed