. 2022 May 10:13:883934.
doi: 10.3389/fmicb.2022.883934. eCollection 2022.

Chromatin Regulators Ahc1p and Eaf3p Positively Influence Nitrogen Metabolism in Saccharomyces cerevisiae

Affiliations

Chromatin Regulators Ahc1p and Eaf3p Positively Influence Nitrogen Metabolism in Saccharomyces cerevisiae

Yu Chen et al. Front Microbiol. .

Abstract

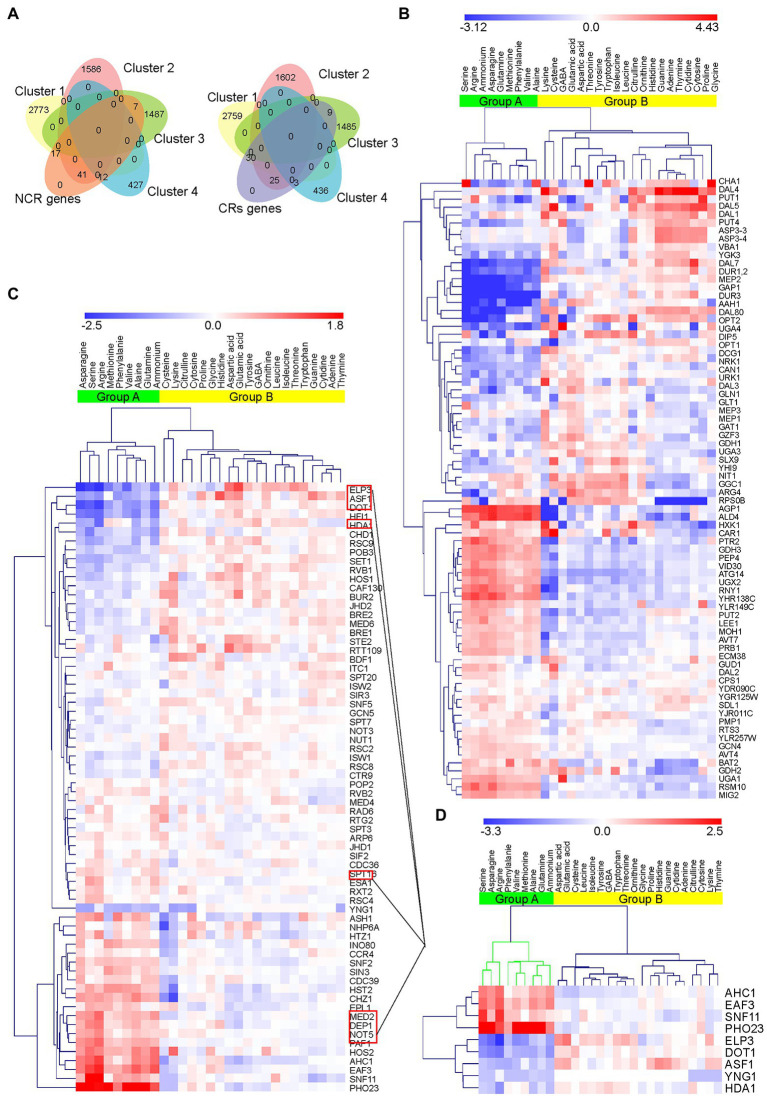
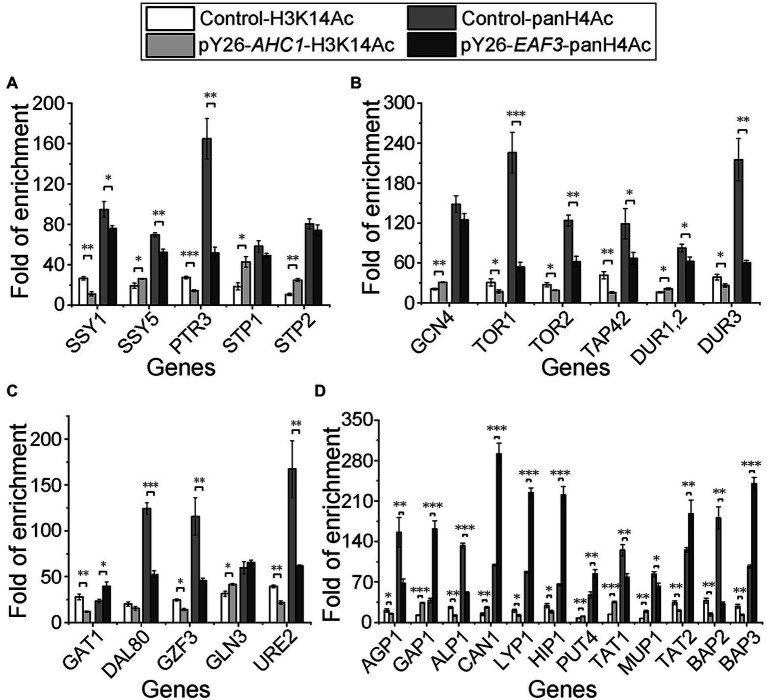
There is a complex regulatory network of nitrogen metabolism in Saccharomyces cerevisiae, and many details of this regulatory network have not been revealed. This study explored the global regulation of nitrogen metabolism in S. cerevisiae from an epigenetic perspective. Comparative transcriptome analysis of S. cerevisiae S288C treated with 30 nitrogen sources identified nine chromatin regulators (CRs) that responded significantly to different nitrogen sources. Functional analysis showed that among the CRs identified, Ahc1p and Eaf3p promoted the utilization of non-preferred nitrogen sources through global regulation of nitrogen metabolism. Ahc1p regulated nitrogen metabolism through amino acid transport, nitrogen catabolism repression (NCR), and the Ssy1p-Ptr3p-Ssy5p signaling sensor system. Eaf3p regulated nitrogen metabolism via amino acid transport and NCR. The regulatory mechanisms of the effects of Ahc1p and Eaf3p on nitrogen metabolism depended on the function of their histone acetyltransferase complex ADA and NuA4. These epigenetic findings provided new insights for a deeper understanding of the nitrogen metabolism regulatory network in S. cerevisiae.

Keywords: Ahc1p; Eaf3p; amino acid utilization; histone acetylation; nitrogen preference.


Conflict of interest statement

The authors declare that the research was conducted in the absence of any commercial or financial relationships that could be construed as a potential conflict of interest.

Figures

Figure 1
Figure 1
Overview of RNA-Seq data. (A) Clustering heatmap of all differentially expressed genes. Genes with similar transcription patterns were clustered into a cluster, resulting in four clusters. Samples were clustered to two groups. The thermogram shows the transcription of genes in different samples. The colors of squares represent values after normalization. Downregulated genes are highlighted in blue, and upregulated genes are highlighted in red. (B) Number of differentially expressed genes in each comparison group. Urea served as a control. Genes with an adjusted value of p <0.05 and |log2foldchange| >0.0 were considered differentially expressed. (C) KEGG analysis of the four clusters. KEGG pathway enrichment used padj <0.05 served as threshold criteria for significant enrichment. The 20 KEGG pathways with the most significant enrichment are shown in the scatter diagram.
Figure 2
Figure 2
Venn diagrams and heatmaps of NCR target genes and CRs enrichment. (A) Venn diagrams of NCR and CRs in the four clusters. A total of 78 NCR genes and 67 CRs were obtained from the four clusters. (B) Hierarchical clustering of 78 NCR genes in response to changes in nitrogen sources based on normalized log2FoldChange. The green cluster (Group A) represents the preferred nitrogen sources of S288C obtained by clustering. Downregulated genes are highlighted in blue and upregulated genes are highlighted in red. (C) Hierarchical clustering of 67 CRs in response to changes in nitrogen sources based on normalized log2foldchange. Group A (green) obtained by clustering is consistent with NCR genes. Red square frames indicate nine CRs showing significant changes in transcription in the presence of various nitrogen sources. (D) Enrichment heatmap of the nine CRs showing the most significant differences in transcription in response to nitrogen sources among 67 CRs.
Figure 3
Figure 3
Physiological index analysis of CRs recombinant strains. (A) Growth status of nine CR recombinant strains in the presence of different nitrogen sources. (B) Urea accumulation in nine CR recombinant strains in the presence of different nitrogen sources. (C) Amino acid utilization rate of S288C-pY26-AHC1 and S288C-pY26-EAF3 in mixed medium containing the 20 common amino acids. Results are mean (M) ± standard deviation (SD) of three biological replicates. Statistical significance was determined by unpaired parametric two-tailed Welch’s t-test with 95% confidence (*p < 0.05, **p < 0.005, ***p < 0.0005).
Figure 4
Figure 4
Relative transcription levels of key genes for nitrogen metabolism. (A) Relative transcription levels of SPS sensor system-related genes. (B) Relative transcription levels of genes related to the general amino acid control (GAAC) pathway, the TOR pathway, and urea metabolism. (C) Relative transcription levels of NCR genes. (D) Relative transcription levels of amino acid transporters. Genes with a transcriptional fold change greater or less than 1 were considered upregulated or downregulated, respectively. Transcription levels were normalized against the housekeeping gene ACT1 and S288C as controls. Results are mean (M) ± standard deviation (SD) of three biological replicates. Statistical significance was determined by unpaired parametric two-tailed Welch’s t-test with 95% confidence (*p < 0.05, **p < 0.005, ***p < 0.0005).
Figure 5
Figure 5
Histone acetylation levels of key nitrogen metabolism genes in AHC1/EAF3 overexpression strains. (A) Histone acetylation levels of SPS sensor system-related genes. (B) Histone acetylation levels of genes related to the general amino acid control (GAAC) pathway, the TOR pathway, and urea metabolism. (C) Histone acetylation levels of NCR genes. (D) Histone acetylation levels of amino acid transporters. S288C served as a control. Signals were normalized against IgG, and results are mean (M) ± standard deviation (SD) of three biological replicates. Statistical significance was determined by unpaired parametric two-tailed Welch’s t-test with 95% confidence (*p < 0.05, **p < 0.005, ***p < 0.0005).
Figure 6
Figure 6
Schematic diagram of the potential mechanism by which AHC1/EAF3 overexpression regulates key nitrogen metabolism genes. (A) Potential mechanism by which AHC1 overexpression regulates nitrogen metabolism. Ahc1p may activate gene expression together with other transcription factors, and its effects are enhanced by overexpression of AHC1. Ahc1p depends on the ADA complex for its function to acetylate histone H3K14 sites on the promoters of target genes. This loosens nucleosomes and promotes the binding of Gln3p or other transcription factors, thereby activating the expression of target genes, resulting in upregulation of target gene expression, and eventually increased utilization of non-preferred nitrogen sources. (B) Potential mechanism by which EAF3 overexpression regulates nitrogen metabolism. Eaf3p may act in a similar manner to Ahc1p. However, Eaf3p recognizes H3K4me sites on target gene promoters through its N-terminal chromodomain and localizes the NuA4 histone acetyltransferase complex to target gene promoters.

Similar articles

Cited by

References

    1. Abdul-Rahman F., Tranchina D., Gresham D. (2021). Fluctuating environments maintain genetic diversity through neutral fitness effects and balancing selection. Mol. Biol. Evol. 38, 4362–4375. doi: 10.1093/molbev/msab173, PMID: - DOI - PMC - PubMed
    1. Amberg D. C., Burke D. J., Strathern J. N. (2006). Measuring yeast cell density by spectrophotometry. CSH Protocols 2006:pdb.prot4186. doi: 10.1101/pdb.prot4186, PMID: - DOI - PubMed
    1. Biswas D., Takahata S., Stillman D. J. (2008). Different genetic functions for the Rpd3(L) and Rpd3(S) complexes suggest competition between NuA4 and Rpd3(S). Mol. Cell. Biol. 28, 4445–4458. doi: 10.1128/MCB.00164-08, PMID: - DOI - PMC - PubMed
    1. Cigic I. K., Vodosek T. V., Kosmerl T., Strlic M. (2008). Amino acid quantification in the presence of sugars using HPLC and pre-column derivatization with 3-MPA/OPA and FMOC-cl. Acta Chim. Slov. 2, 165–175. doi: 10.1021/nn700226y - DOI
    1. Cubillos F. A., Brice C., Molinet J., Tisne S., Abarca V., Tapia S. M., et al. . (2017). Identification of nitrogen consumption genetic variants in yeast through QTL mapping and bulk segregant RNA-Seq analyses. G3 7, 1693–1705. doi: 10.1534/g3.117.042127, PMID: - DOI - PMC - PubMed