. 2022 May 10:16:853909.
doi: 10.3389/fnhum.2022.853909. eCollection 2022.

Combination of Group Singular Value Decomposition and eLORETA Identifies Human EEG Networks and Responses to Transcranial Photobiomodulation

Affiliations

Combination of Group Singular Value Decomposition and eLORETA Identifies Human EEG Networks and Responses to Transcranial Photobiomodulation

Xinlong Wang et al. Front Hum Neurosci. .

Abstract

Transcranial Photobiomodulation (tPBM) has demonstrated its ability to alter electrophysiological activity in the human brain. However, it is unclear how tPBM modulates brain electroencephalogram (EEG) networks and is related to human cognition. In this study, we recorded 64-channel EEG from 44 healthy humans before, during, and after 8-min, right-forehead, 1,064-nm tPBM or sham stimulation with an irradiance of 257 mW/cm2. In data processing, a novel methodology by combining group singular value decomposition (gSVD) with the exact low-resolution brain electromagnetic tomography (eLORETA) was implemented and performed on the 64-channel noise-free EEG time series. The gSVD+eLORETA algorithm produced 11 gSVD-derived principal components (PCs) projected in the 2D sensor and 3D source domain/space. These 11 PCs took more than 70% weight of the entire EEG signals and were justified as 11 EEG brain networks. Finally, baseline-normalized power changes of each EEG brain network in each EEG frequency band (delta, theta, alpha, beta and gamma) were quantified during the first 4-min, second 4-min, and post tPBM/sham periods, followed by comparisons of frequency-specific power changes between tPBM and sham conditions. Our results showed that tPBM-induced increases in alpha powers occurred at default mode network, executive control network, frontal parietal network and lateral visual network. Moreover, the ability to decompose EEG signals into individual, independent brain networks facilitated to better visualize significant decreases in gamma power by tPBM. Many similarities were found between the cortical locations of SVD-revealed EEG networks and fMRI-identified resting-state networks. This consistency may shed light on mechanistic associations between tPBM-modulated brain networks and improved cognition outcomes.

Keywords: default mode network; eLORETA; executive control network; frontal parietal network; singular value decomposition; transcranial photobiomodulation.


Conflict of interest statement

The authors declare that the research was conducted in the absence of any commercial or financial relationships that could be construed as a potential conflict of interest. The handling editor FG-L declared a past co-authorship with the authors.

Figures

FIGURE 1
FIGURE 1
Experimental protocol with a 2-min baseline, 8-min tPBM/sham, and a 3-min recovery period. The solid red and black-dashed open circles mark the spatial sites of tPBM and sham delivery, respectively, on the subject’s forehead. All participants and the experimental operator were required to wear a pair of googles for eye protection.
FIGURE 2
FIGURE 2
(A) A flow chart of seven steps for EEG data processing; (B) a corresponding diagram to graphically explain each data processing step in detail. Note that in step 4 of (B), the time course shows only 2-s data as a demo of time series in U matrix for one SVD component. The number in yellow circles matches the steps given in the flowchart (A).
FIGURE 3
FIGURE 3
One example of the group-averaged PSD (in log scale for both x and y axis) for SVD component one, SVD #1, during 4–8 min tPBM (red) and sham (black), respectively. Blue vertical dashed lines separate the five EEG frequency bands, namely, delta (δ: 1–4 Hz), theta (θ: 4–8 Hz), alpha (α: 8–13 Hz), beta (β:13–30 Hz), and gamma (γ: 30–70 Hz) bands. The dashed black box provides a zoom-in view of the PSD in alpha band (in linear scale for both x and y axis).
FIGURE 4
FIGURE 4
Ranks and weights of all the 64 gSVD components after gSVD process. The x-axis indicates the rank number of the 64 components, while the y-axis denotes the weight of each component. An exponential decay pattern of weight appears across the 64 components. The 11 most-weighted components, each of which has more than 90% weight of the most weighted component, are marked by red dots and selected for further data processing. The total weight of the 11 selected components (red) takes 70% of the total weight (all the dots).
FIGURE 5
FIGURE 5
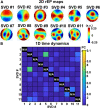
(A) 2D topographies of relative electrical potential (rEP) at sensor space for the 11 extracted gSVD components. (B) PCC values of temporal dynamics between each pair of gSVD-derived component across 11-min measurement time. It shows that the 11 components have minimally time-correlated values (PCC < 0.07). Note that self-correlation for each component is meaningless and thus marked with N/A (i.e., not applicable).
FIGURE 6
FIGURE 6
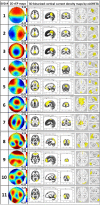
The leftmost column excluding the number column shows 2D rEP maps for 11 EEG brain networks corresponding to 11 SVD components. Accordingly, the middle three columns display axial, sagittal, and coronal views of the current density of neural activity for each EEG network, while the right most column illustrates respective 3D source localizations of cortical current density. Yellow color on the brain models indicates the binarized cortical current density at the associated cortical locations under a threshold of >75% of the maximum neural activity in the network/brain model.
FIGURE 7
FIGURE 7
Group-level (n = 44) ΔnP (i.e., baseline-normalized, sham-subtracted EEG powers) for each brain network in (A) alpha and (B) gamma bands, during 0–4 min (green), 4–8 min (blue) tPBM/sham, and 3-min recovery (purple) periods. Error bars represent the standard error of the mean. Significant differences of ΔnP between tPBM vs. sham when pair-wise, two-sample, non-parametric tests between nP values for tPBM and sham (equivalent to one-sample non-parametric test between ΔnP vs. zero) were performed at the significance level of p < 0.05 (marked by “*”) and p < 0.01 (marked by “&”).

Similar articles

Cited by

References

    1. Akiki T. J., Averill C. L., Wrocklage K. M., Scott J. C., Averill L. A., Schweinsburg B., et al. (2018). Default mode network abnormalities in posttraumatic stress disorder: a novel network-restricted topology approach. Neuroimage 176 489–498. 10.1016/j.neuroimage.2018.05.005 - DOI - PMC - PubMed
    1. Angelakis E., Stathopoulou S., Frymiare J. L., Green D. L., Lubar J. F., Kounios J. (2007). EEG neurofeedback: a brief overview and an example of peak alpha frequency training for cognitive enhancement in the elderly. Clin. Neuropsychol. 21 110–129. 10.1080/13854040600744839 - DOI - PubMed
    1. Aoki Y., Ishii R., Pascual-Marqui R. D., Canuet L., Ikeda S., Hata M., et al. (2015). Detection of EEG-resting state independent networks by eLORETA-ICA method. Front. Hum. Neurosci. 9:31. 10.3389/fnhum.2015.00031 - DOI - PMC - PubMed
    1. Asadi N., Wang Y., Olson I., Obradovic Z. (2020). A heuristic information cluster search approach for precise functional brain mapping. Hum. Brain Mapp. 41 2263–2280. 10.1002/hbm.24944 - DOI - PMC - PubMed
    1. Bai M., Huang Y., Zhang G., Zheng W., Lin Q., Hu Z. (2019). Fast backward singular value decomposition (SVD) algorithm for magnetocardiographic signal reconstruction from pulsed atomic magnetometer data. Opt. Express 27 29534–29546. 10.1364/OE.27.029534 - DOI - PubMed

LinkOut - more resources