. 2022 Apr 20;4(3):fcac101.
doi: 10.1093/braincomms/fcac101. eCollection 2022.

Graph theoretical measures of fast ripples support the epileptic network hypothesis

Affiliations

Graph theoretical measures of fast ripples support the epileptic network hypothesis

Shennan A Weiss et al. Brain Commun. .

Abstract

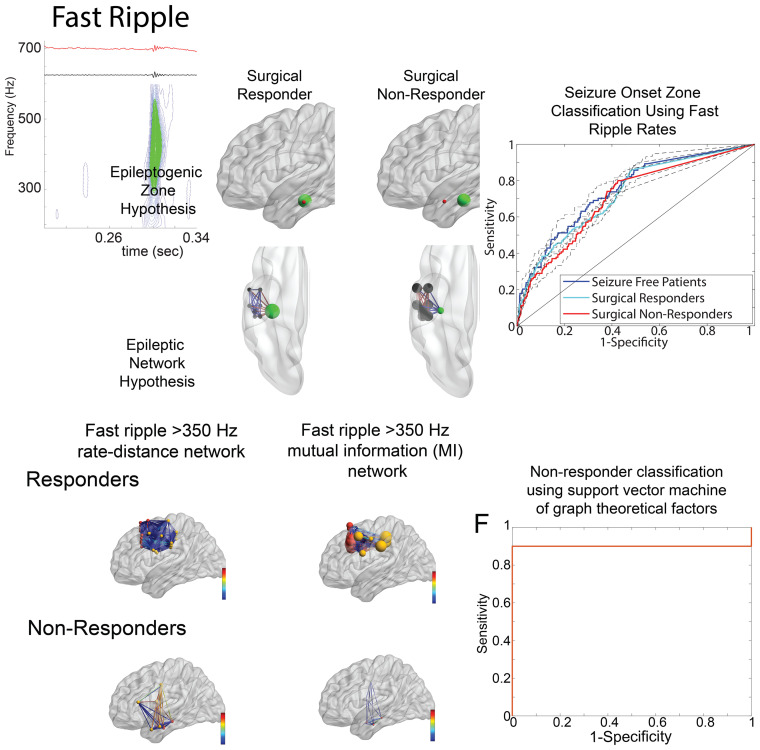
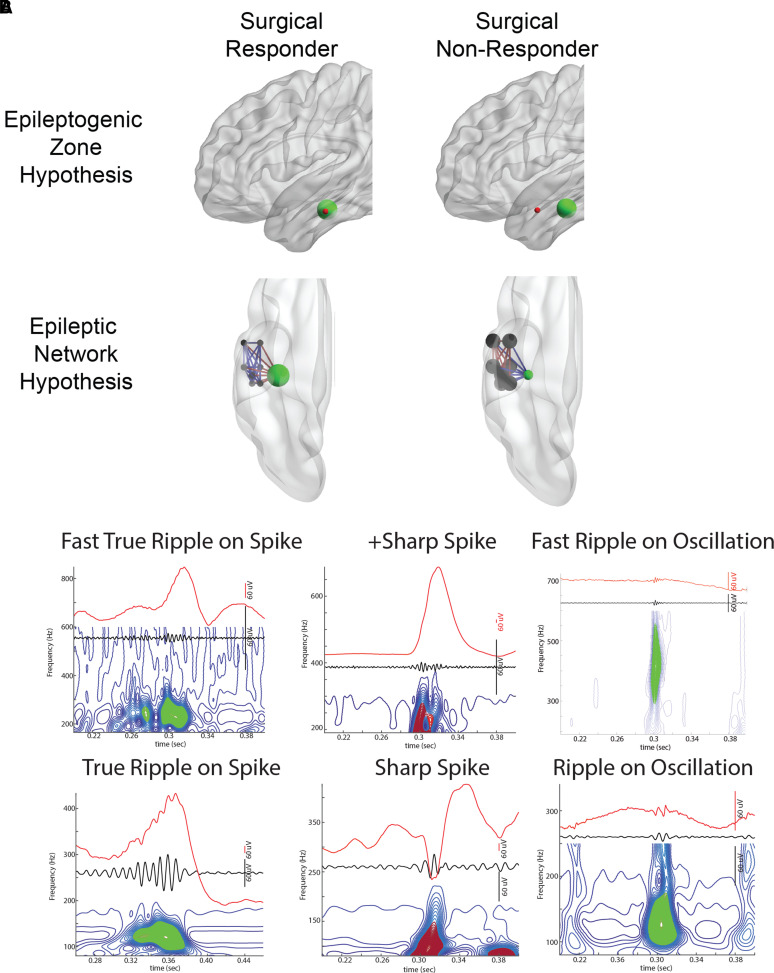
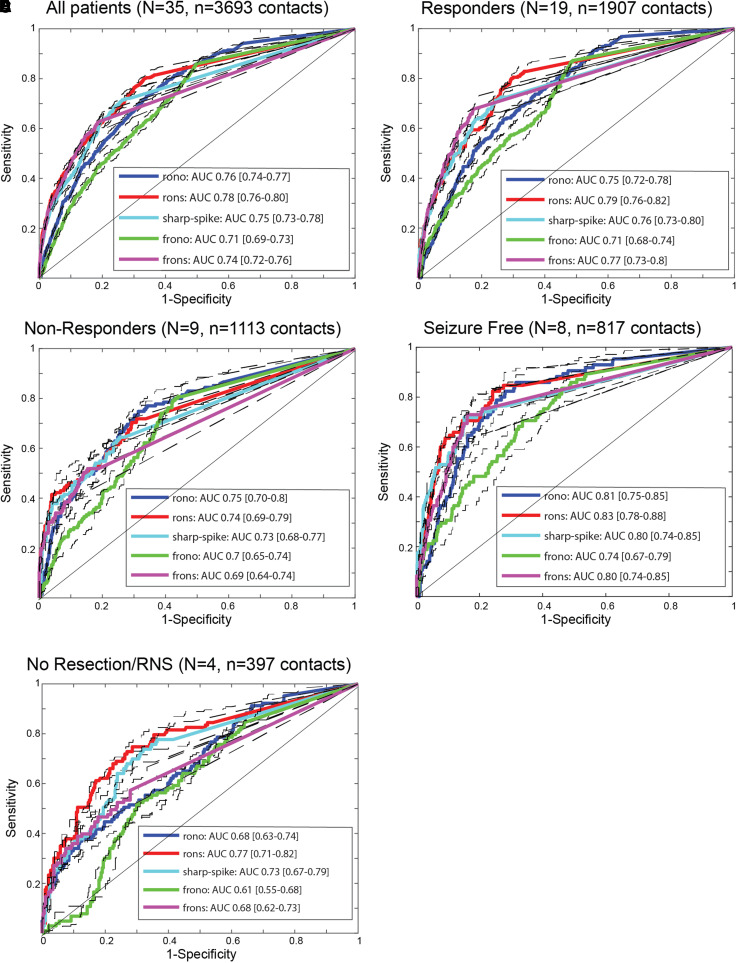
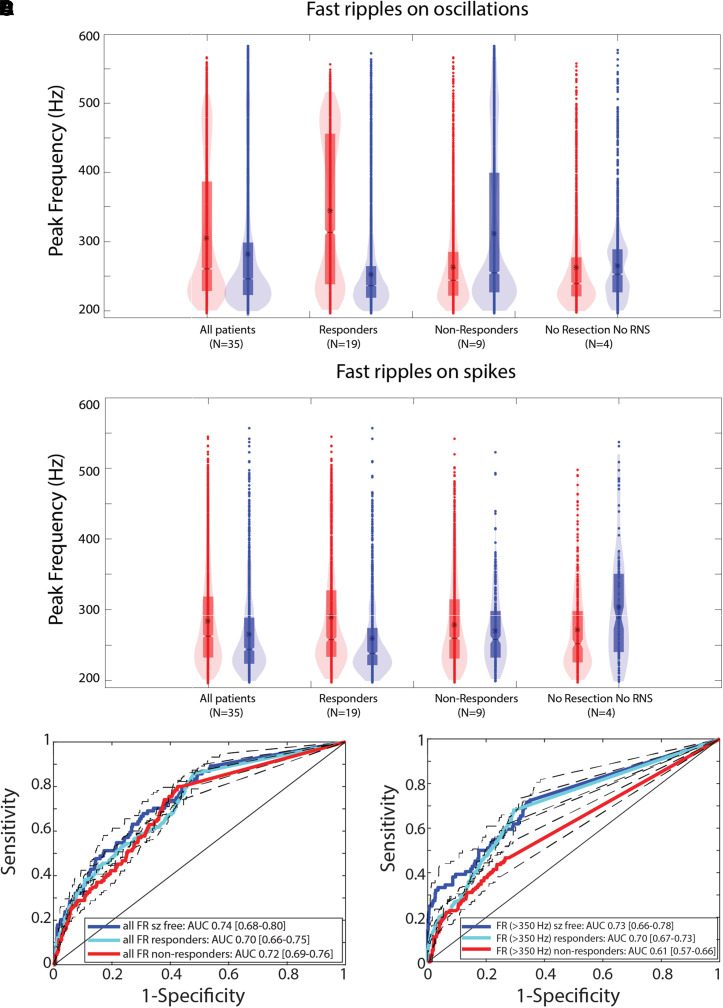
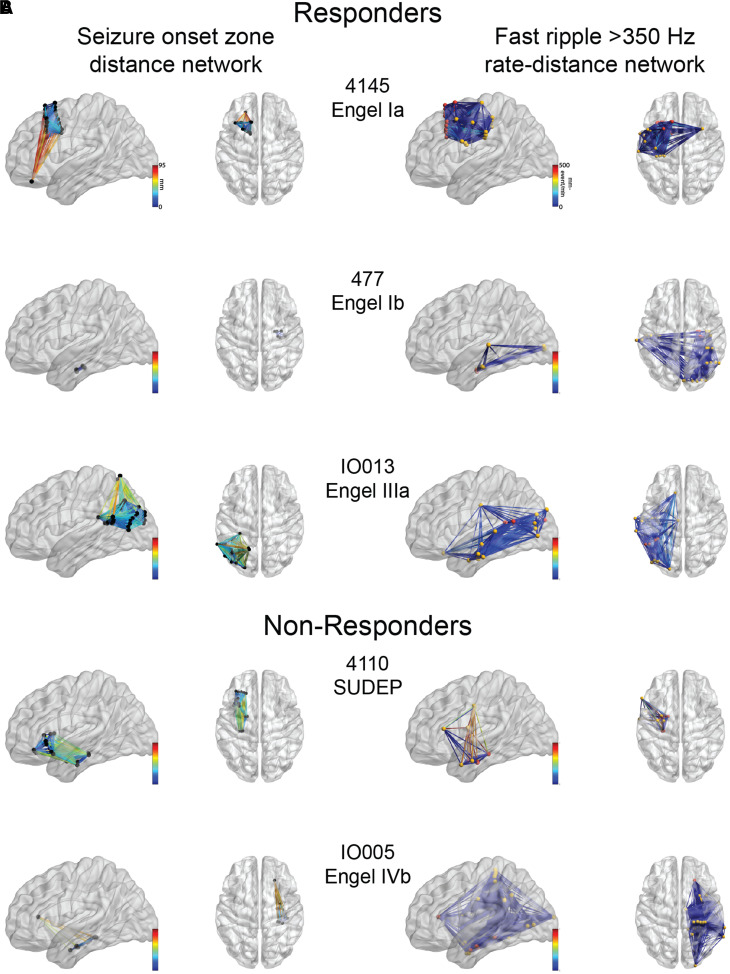
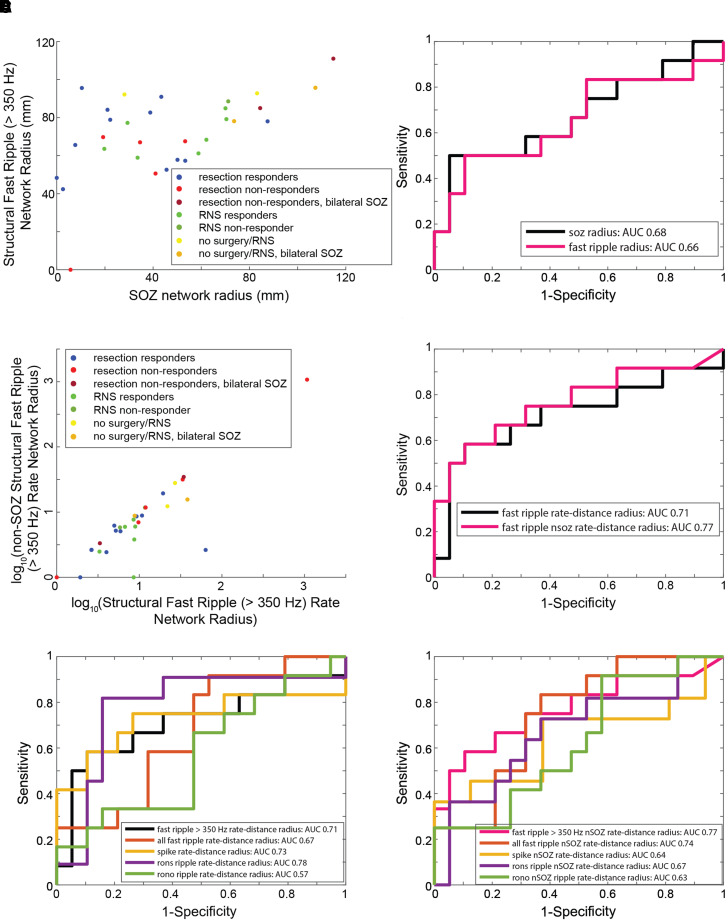
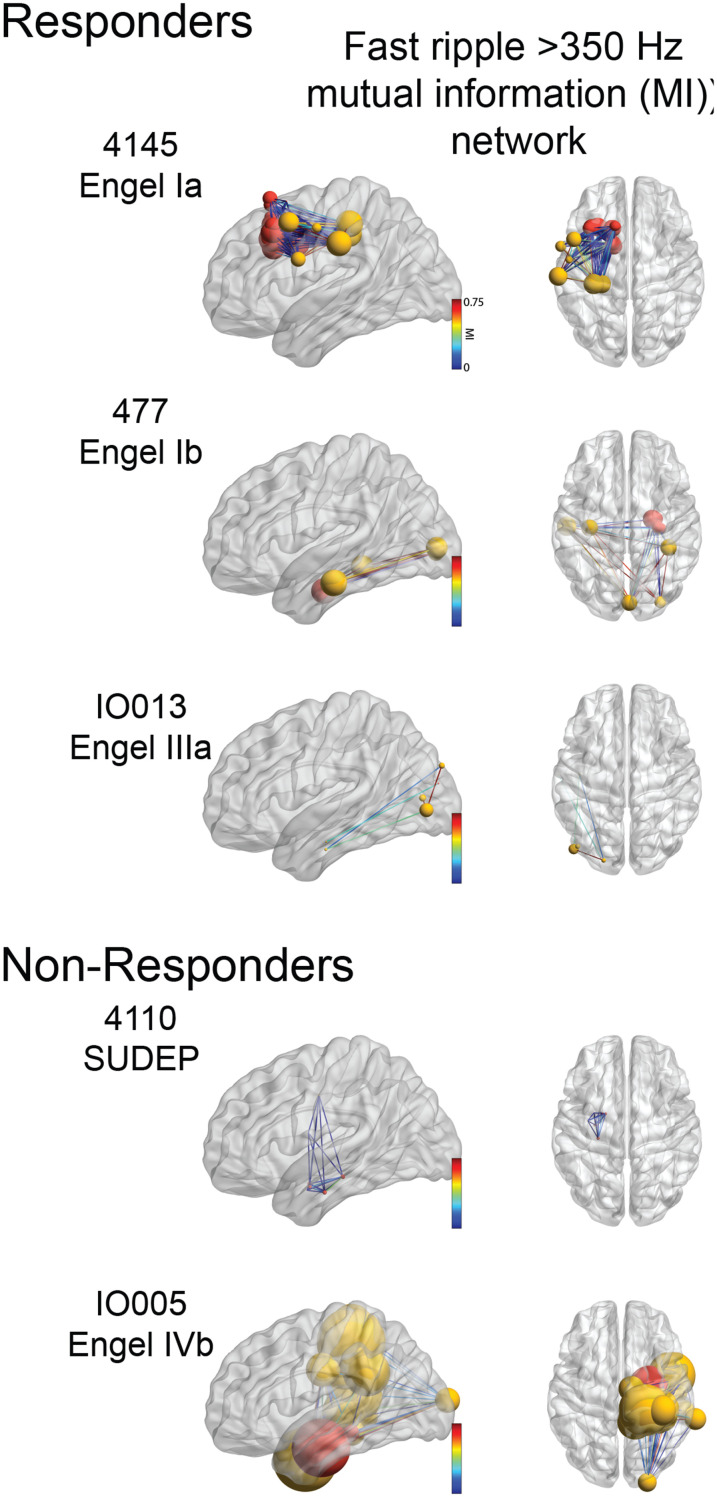
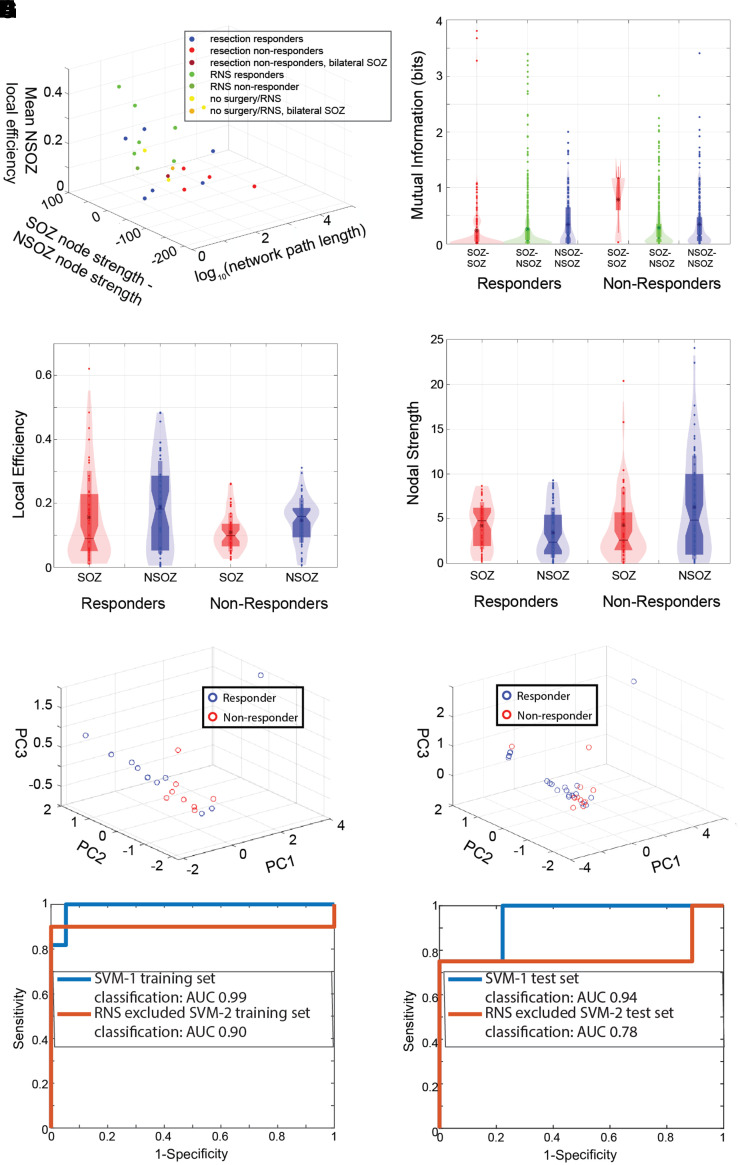
The epileptic network hypothesis and epileptogenic zone hypothesis are two theories of ictogenesis. The network hypothesis posits that coordinated activity among interconnected nodes produces seizures. The epileptogenic zone hypothesis posits that distinct regions are necessary and sufficient for seizure generation. High-frequency oscillations, and particularly fast ripples, are thought to be biomarkers of the epileptogenic zone. We sought to test these theories by comparing high-frequency oscillation rates and networks in surgical responders and non-responders, with no appreciable change in seizure frequency or severity, within a retrospective cohort of 48 patients implanted with stereo-EEG electrodes. We recorded inter-ictal activity during non-rapid eye movement sleep and semi-automatically detected and quantified high-frequency oscillations. Each electrode contact was localized in normalized coordinates. We found that the accuracy of seizure onset zone electrode contact classification using high-frequency oscillation rates was not significantly different in surgical responders and non-responders, suggesting that in non-responders the epileptogenic zone partially encompassed the seizure onset zone(s) (P > 0.05). We also found that in the responders, fast ripple on oscillations exhibited a higher spectral content in the seizure onset zone compared with the non-seizure onset zone (P < 1 × 10⁻⁵). By contrast, in the non-responders, fast ripple had a lower spectral content in the seizure onset zone (P < 1 × 10⁻⁵). We constructed two different networks of fast ripple with a spectral content >350 Hz. The first was a rate-distance network that multiplied the Euclidian distance between fast ripple-generating contacts by the average rate of fast ripple in the two contacts. The radius of the rate-distance network, which excluded seizure onset zone nodes, discriminated non-responders, including patients not offered resection or responsive neurostimulation due to diffuse multifocal onsets, with an accuracy of 0.77 [95% confidence interval (CI) 0.56-0.98]. The second fast ripple network was constructed using the mutual information between the timing of the events to measure functional connectivity. For most non-responders, this network had a longer characteristic path length, lower mean local efficiency in the non-seizure onset zone, and a higher nodal strength among non-seizure onset zone nodes relative to seizure onset zone nodes. The graphical theoretical measures from the rate-distance and mutual information networks of 22 non- responsive neurostimulation treated patients was used to train a support vector machine, which when tested on 13 distinct patients classified non-responders with an accuracy of 0.92 (95% CI 0.75-1). These results indicate patients who do not respond to surgery or those not selected for resection or responsive neurostimulation can be explained by the epileptic network hypothesis that is a decentralized network consisting of widely distributed, hyperexcitable fast ripple-generating nodes.

Keywords: brain network; epilepsy surgery; fast ripple; high-frequency oscillation.


Figures

Graphical Abstract
Graphical Abstract
Figure 1
Figure 1
Illustration of two potential mechanisms accounting for epilepsy surgery failure and HFO and spike biomarkers. (A) In the EZ hypothesis, the EZ (red) is necessary and sufficient for seizure generation. When the EZ overlaps with the SOZ (green), and the SOZ is resected, the patient is a surgical responder. However, if the EZ is discordant with the SOZ, and the SOZ is resected instead of the EZ, the patient will be a surgical non-responder. In the epileptic network hypothesis, the nodes of the epileptic network (black) are connected to each other by weighted connections. If the SOZ node (green) is the hub and the most strongly connected (red edges) to the other nodes, then resecting the SOZ node alone will result in a surgical response. In contrast, if the non-SOZ nodes are most strongly connected with each other (red edges), and weakly connected (blue edges) with the SOZ node, the patient will be a surgical failure if only the SOZ node is resected. (B) Illustration of the HFO subtypes detected using the topographical analysis method. Each panel includes the iEEG trace (above), the 80–600 Hz band-pass filtered iEEG (middle), and the corresponding contour lines of isopower in the time-frequency spectrogram (below). Each contour line is shown in blue, groups of closed-loop contours are in green, open-loop contours are in dark red. Note that sharp-spikes produce HFOs after band-pass filtering but no closed-loop contours.
Figure 2
Figure 2
SOZ classification accuracy differences using high-frequency oscillation and spike rates in seizure-free patients, surgical responders, surgical non-responders, and those not offered surgery. ROC curves for SOZ classification using HFO subtype and sharp-spike rates for the different patient cohorts, (A) all patients, (B) responders, (C) non-responders, (D) seizure-free responders, (E) no resection/RNS. rono, ripples on oscillations; rons, ripples on spikes; frono, fast ripples on oscillations; frons, fast ripples on spikes; AUC, area under the ROC curve. Dashed lines and brackets indicate 95% CIs calculated using bootstrapping (n = 1000 surrogates). The AUC for fRonO trended lower in the no resection/RNS group (bootstrapping, P = 0.05). The AUC for fRonS trended higher in the seizure-free group compared with non-responders (bootstrapping, P = 0.05), and was significantly greater than the no resection/RNS group (bootstrapping, P < 0.05).
Figure 3
Figure 3
Fast Ripples (FR) with a higher spectral content are better markers of epileptogenic brain regions. Violin plots of FR on oscillation (fRonO, A) and FR on spike (fRonS, B) peak spectral frequency in the SOZ (red) and non-SOZ (blue) in all patients, responders, non-responders and patients not offered resection or RNS. Asterisk indicates mean. In the responders, the peak spectral frequency of fRonO was higher in the SOZ than in the non-SOZ (GLMM, P < 1 × 10−5). In the non-responders, the peak spectral frequency of fRonO was lower in the SOZ than the non-SOZ (GLMM, P < 1 × 10−5). In the no resection/RNS group, fRonS peak spectral frequency was significantly higher in the non-SOZ (GLMM, P < 1 × 10−5). (C, D) ROC curves for seizure onset zone classification using the rate of all fast ripples, including fRonO and fRonS irrespective of frequency (C), and higher-frequency fast ripples (D, fRonO and fRonS > 350 Hz) for the different patient cohorts. The area under the ROC curve of FR (>350 Hz) rates was significantly different in responders compared with non-responders (bootstrapping, P < 0.05). Dashed lines and brackets indicate 95% CIs calculated using bootstrapping (n = 1000 surrogates).
Figure 4
Figure 4
Example of SOZ networks and FR rate–distance networks. Glass brain renderings of the (A) SOZ distance networks and the (B) FR (>350 Hz) rate–distance networks for three representative responders (top) and two non-responders (bottom). (A) The edge colour corresponds to the geometric distance (mm) between electrode contacts inside the SOZ. (B) The electrode contacts in the SOZ are coloured red and those in the non-SOZ yellow. The edge colour corresponds to the geometric distance multiplied by the average FR rate between the two electrodes. The FR distance networks (not shown) can be inferred from (B) since the node locations are identical, but the edge weights are calculated as the Euclidian distance between the nodes alone (not shown).
Figure 5
Figure 5
The radius of FR rate–distance networks classifies non-responders with moderate accuracy. FR (>350 Hz) rate–distance network for each patient group and classification accuracy of non-responders (resection non-responders, RNS non-responders and no surgery) from responders (resection responders, RNS responders). (A) Scatterplot of the radius of the SOZ and the radius of the FR distance network for the 31 patients. (B) ROC curves of the radius of the SOZ network (black) and radius of the FR network (magenta) for classifying non-responders. (C) Scatterplot of the log-transformed radius of the FR rate–distance network, and the log-transformed radius of the corresponding non-SOZ networks. (D) ROC curves of the radius of the FR rate–distance networks (black) and corresponding non-SOZ networks (magenta). After bootstrapping (n = 1000 surrogates, not shown), the AUC for the FR non-SOZ rate–distance radius was 0.77 (95% CI 0.56–0.98). (E) ROC curves of the radius of the rate–distance networks of the different biomarkers. (F) ROC curves of the radius of the corresponding non-SOZ networks of the different biomarkers.
Figure 6
Figure 6
Examples of FR mutual information networks. Glass brain renderings of the FR (>350 Hz) mutual information networks defined by mutual information between fast ripple ‘spike trains’ recorded from paired electrode contacts. Nodes in the SOZ are coloured red, nodes in the non-SOZ are coloured yellow. The size of the node corresponds to the node strength. The edge colour corresponds to the mutual information value between nodes.
Figure 7
Figure 7
Graph theoretical measures of the fast ripple MI networks improve the discrimination of non-responders. (A) 3D scatter plot of the FR (>350 Hz) MI global graph theoretical measures (three univariate Wilcoxon rank-sum tests, P > 0.05). (B) Violin plot of MI computed for SOZ–SOZ edges (red), SOZ–NSOZ edges (green), NSOZ–NSOZ edges (blue) across all the responder and non-responder patients (GLMM, P > 0.05). (C) Local efficiency of SOZ (red) and NSOZ (blue) nodes across responder and non-responder patients (GLMM, P > 0.05). (D) Nodal strength of SOZ (red) and NSOZ (blue) nodes across responder and non-responder patients. The location of the node within the SOZ significantly influenced nodal strength (GLMM, P < 0.05), (E, F) 3D scatter plots of the PC scores derived from PCA of the three global measures (A) from all the patients in the training set (E) and combined exploratory and test set (F). The PC2 score was significantly different in the responders compared with non-responders for the training set (rank-sum, P = 0.03) and the combined exploratory and test set patients (rank-sum, P = 0.01). However, only in the latter group did the effect survive after Bonferroni–Holm correction. The PC1 and PC3 scores were not significantly different rank-sum, P > 0.05). (G, H, blue) The ROC curve for non-responder classification in the exploratory dataset (G, n = 19 responders, n = 11 non-responders/no resection or RNS) and in the test dataset (H, n = 9 responders, 4 non-responders/no resection or RNS) by the SVM-1 trained using the SOZ, and FR (>350 Hz) distance, rate–distance and three MI global metric predictors derived from all the exploratory dataset patients. (G, H, red) The ROC curve for non-responder classification using SVM-2 in the exploratory (n = 12 responders, n = 10 non-responders/no resection or RNS) and test set patients (H, n = 9 responders, 4 non-responders/no resection or RNS). SVM-2 excluded RNS implant only patients in the exploratory dataset prior to training and testing. AUC: area under the ROC curve.

References

    1. Rosenow F, Lüders H. Presurgical evaluation of epilepsy. Brain. 2001;124(9):1683–1700. - PubMed
    1. Lüders HO, Najm I, Nair D, Widdess-Walsh P, Bingman W. The epileptogenic zone: General principles. Epileptic Disord. 2006;8(Suppl 2):S1–S9. - PubMed
    1. Jehi L. The epileptogenic zone: Concept and definition. Epilepsy Curr. 2018;18(1):12–16. - PMC - PubMed
    1. Spencer SS. Neural networks in human epilepsy: Evidence of and implications for treatment. Epilepsia. 2002;43(3):219–227. - PubMed
    1. Richardson MP. Large scale brain models of epilepsy: Dynamics meets connectomics. J Neurol Neurosurg Psychiatry. 2012;83(12):1238–1248. - PubMed