

Unbiased analysis of mouse brain endothelial networks from two- or three-dimensional fluorescence images
- PMID: 35620183
- PMCID: PMC9125696
- DOI: 10.1117/1.NPh.9.3.031916
Unbiased analysis of mouse brain endothelial networks from two- or three-dimensional fluorescence images
Abstract
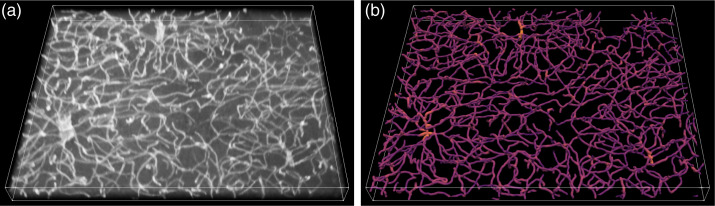
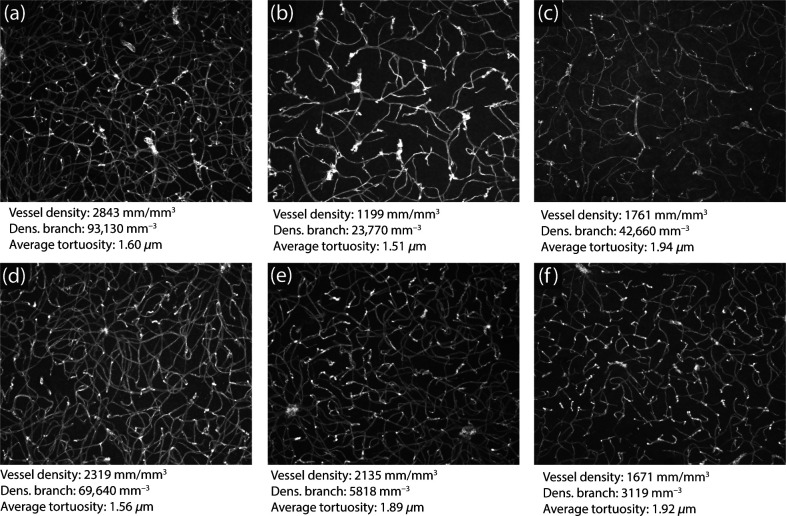
Significance: A growing body of research supports the significant role of cerebrovascular abnormalities in neurological disorders. As these insights develop, standardized tools for unbiased and high-throughput quantification of cerebrovascular structure are needed. Aim: We provide a detailed protocol for performing immunofluorescent labeling of mouse brain vessels, using thin ( ) or thick (50 to ) tissue sections, followed respectively by two- or three-dimensional (2D or 3D) unbiased quantification of vessel density, branching, and tortuosity using digital image processing algorithms. Approach: Mouse brain sections were immunofluorescently labeled using a highly selective antibody raised against mouse Cluster of Differentiation-31 (CD31), and 2D or 3D microscopy images of the mouse brain vasculature were obtained using optical sectioning. An open-source toolbox, called Pyvane, was developed for analyzing the imaged vascular networks. The toolbox can be used to identify the vasculature, generate the medial axes of blood vessels, represent the vascular network as a graph, and calculate relevant measurements regarding vascular morphology. Results: Using Pyvane, vascular parameters such as endothelial network density, number of branching points, and tortuosity are quantified from 2D and 3D immunofluorescence micrographs. Conclusions: The steps described in this protocol are simple to follow and allow for reproducible and unbiased analysis of mouse brain vascular structure. Such a procedure can be applied to the broader field of vascular biology.
Keywords: angiogenesis; cerebrovascular; computation; connectivity; endothelium; image analysis; mouse brain; networks; unbiased.
© 2022 The Authors.
Figures


Similar articles
-
Zebrafish vascular quantification: a tool for quantification of three-dimensional zebrafish cerebrovascular architecture by automated image analysis.Development. 2022 Feb 1;149(3):dev199720. doi: 10.1242/dev.199720. Epub 2022 Feb 14. Development. 2022. PMID: 35005771 Free PMC article.
-
Automated quantification and integrative analysis of 2D and 3D mitochondrial shape and network properties.PLoS One. 2014 Jul 2;9(7):e101365. doi: 10.1371/journal.pone.0101365. eCollection 2014. PLoS One. 2014. PMID: 24988307 Free PMC article.
-
An analytical tool that quantifies cellular morphology changes from three-dimensional fluorescence images.J Vis Exp. 2012 Aug 31;(66):e4233. doi: 10.3791/4233. J Vis Exp. 2012. PMID: 22951512 Free PMC article.
-
Automatic anatomical labeling of the complete cerebral vasculature in mouse models.Neuroimage. 2014 Jul 15;95:117-28. doi: 10.1016/j.neuroimage.2014.03.044. Epub 2014 Mar 28. Neuroimage. 2014. PMID: 24680868
-
3D BrainCV: simultaneous visualization and analysis of cells and capillaries in a whole mouse brain with one-micron voxel resolution.Neuroimage. 2014 Feb 15;87:199-208. doi: 10.1016/j.neuroimage.2013.10.036. Epub 2013 Oct 31. Neuroimage. 2014. PMID: 24185025
Cited by
-
Special Section Guest Editorial: Imaging Neuroimmune, Neuroglial, and Neurovascular Interfaces.Neurophotonics. 2022 Jul;9(3):031901. doi: 10.1117/1.NPh.9.3.031901. Epub 2022 Sep 30. Neurophotonics. 2022. PMID: 36204654 Free PMC article.
-
Using digital pathology to analyze the murine cerebrovasculature.J Cereb Blood Flow Metab. 2024 Apr;44(4):595-610. doi: 10.1177/0271678X231216142. Epub 2023 Nov 21. J Cereb Blood Flow Metab. 2024. PMID: 37988134 Free PMC article.
-
A new dataset for measuring the performance of blood vessel segmentation methods under distribution shifts.PLoS One. 2025 May 27;20(5):e0322048. doi: 10.1371/journal.pone.0322048. eCollection 2025. PLoS One. 2025. PMID: 40424440 Free PMC article.
References
LinkOut - more resources
Full Text Sources
Research Materials
