. 2022 May 10:13:885655.
doi: 10.3389/fphar.2022.885655. eCollection 2022.

Medicinal Cannabis Prescribing in Australia: An Analysis of Trends Over the First Five Years

Affiliations

Medicinal Cannabis Prescribing in Australia: An Analysis of Trends Over the First Five Years

Sara L MacPhail et al. Front Pharmacol. .

Abstract

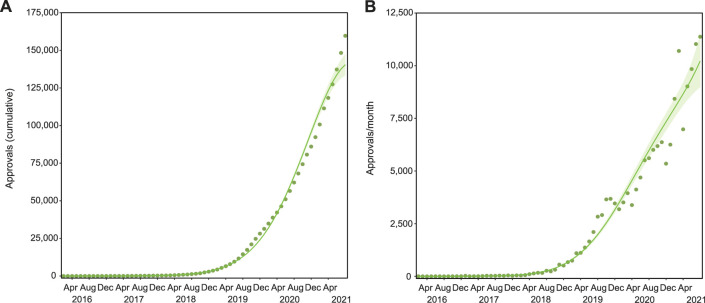
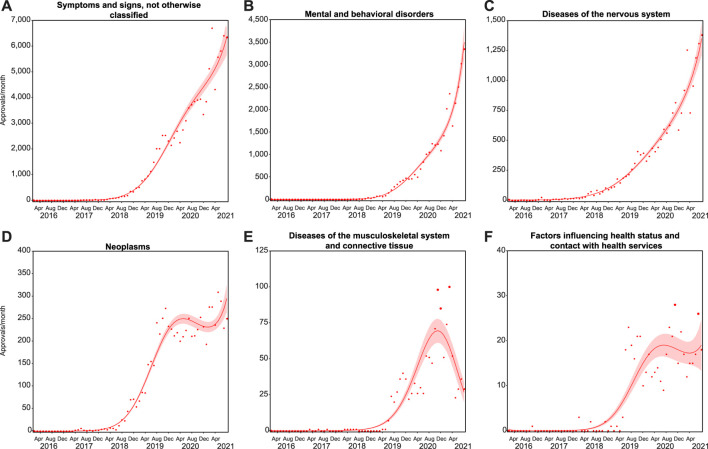
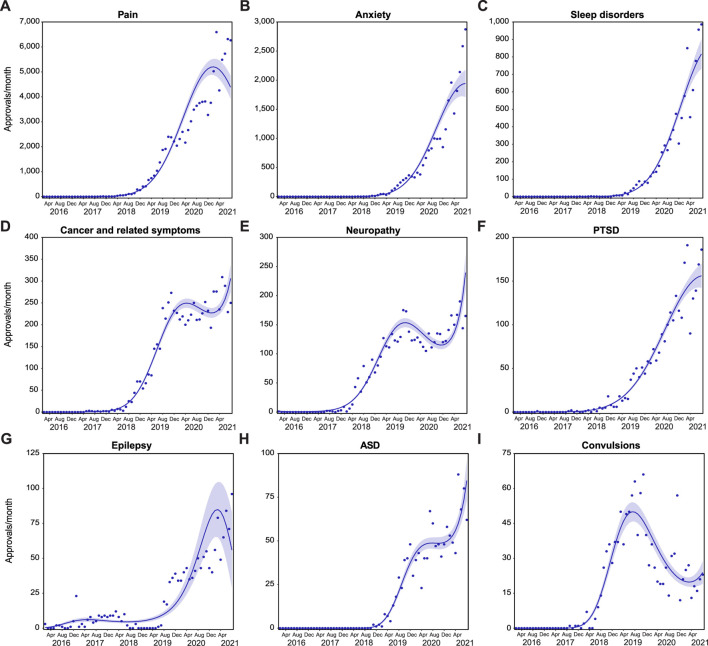
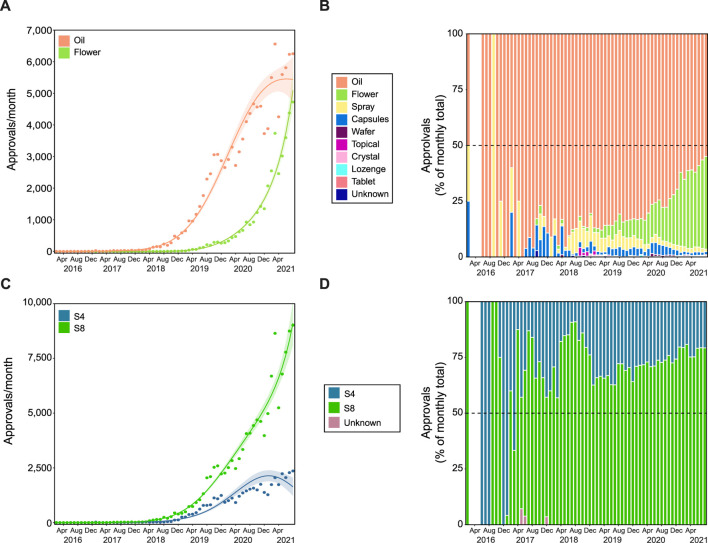
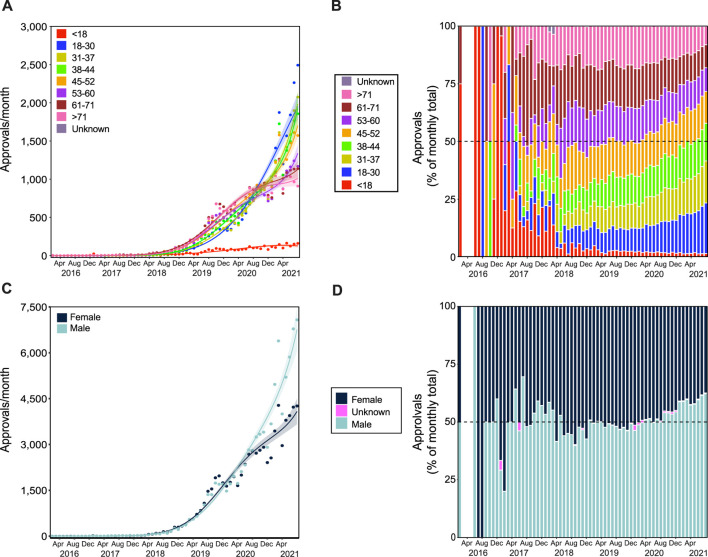
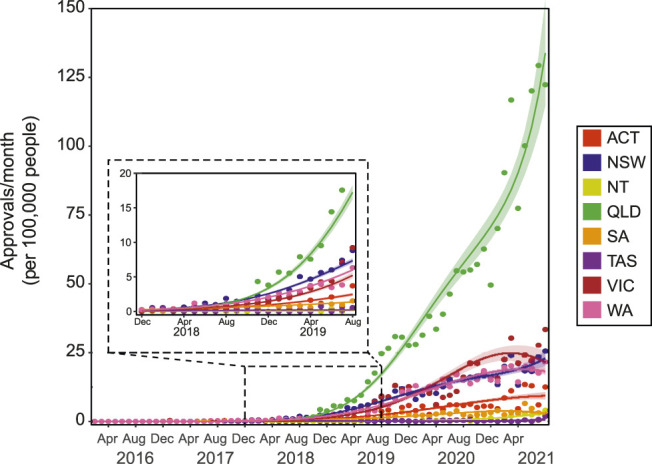
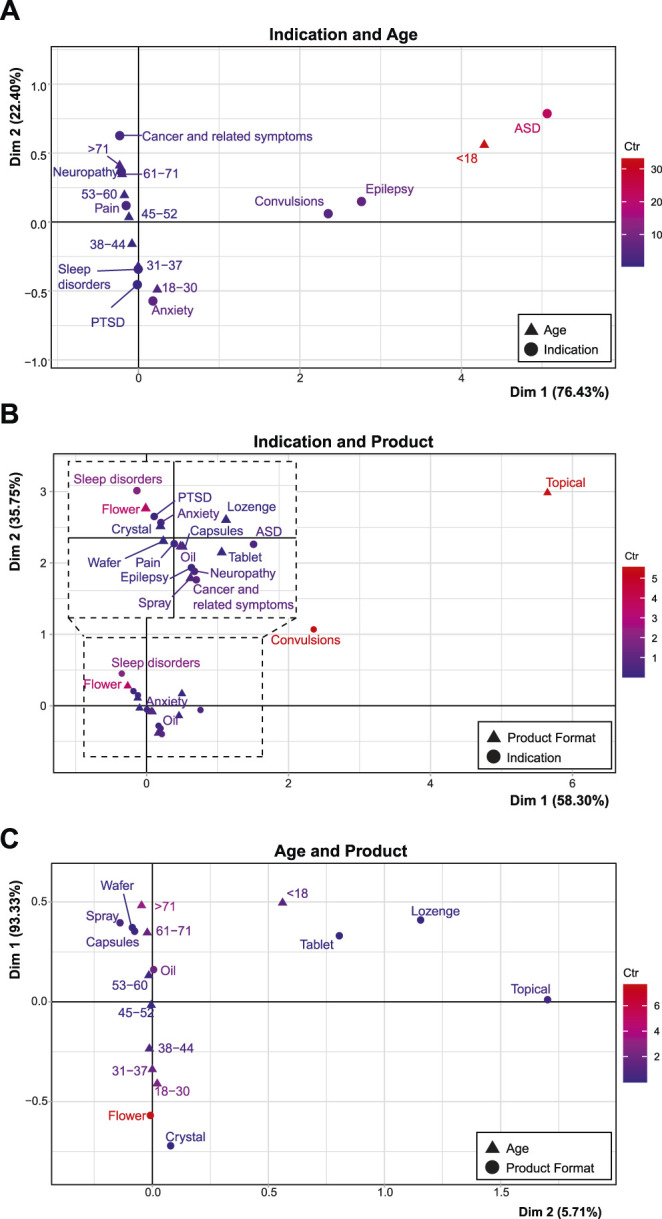
A regulatory framework allowing legal access to medicinal cannabis (MC) products has operated in Australia since November 2016. MC prescribing by healthcare practitioners (HCPs) is primarily conducted through the Special Access Scheme - Category B (SAS-B) pathway, through which prescribers apply to the Therapeutic Goods Administration (TGA-the federal regulator) for approval to prescribe a category of product to an individual patient suffering from a specific indication. The dataset collected by the TGA provides a unique opportunity to examine MC prescribing trends over time in the Australian population. Here we analysed this TGA SAS-B dataset since inception with respect to age, gender, product type (e.g., oil, flower, etc.), CBD content, indication treated, and prescriber location. Results are presented descriptively as well as being analysed using non-linear regression models. Relationship between variables were explored via correspondence analyses. Indications were classified with reference to the International Statistical Classification of Diseases and Related Health Problems (10th Revision). As of 31 August 2021, a total of 159,665 SAS-B approvals had been issued for MC products, 82.4% of were since January 2020. Leading indications for approvals were for pain, anxiety, and sleep disorders. Oil products were the most popular product type, while CBD-dominant products (≥98% CBD) accounted for 25.1% of total approvals. Approvals for flower products increased markedly during 2020-2021, as did approvals involving younger age groups (18-31 years old), male patients, and non-CBD dominant products. A disproportionate number of SAS-B MC applications (around 50%) came from HCPs in the state of Queensland. Associations between patient gender and age and/or indication with product type were found. For example, approvals for oil products were commonly associated with approvals for pain. While, overall prescribing increased dramatically over the last 2 years of analysis, stabilization of approval numbers is evident for some indications, such as pain. Current prescribing practices do not always reflect provided TGA guidance documents for MC prescribing. While acknowledging some limitations around the SAS-B dataset, it provides a unique and valuable resource with which to better understand current prescribing practices and utilisation of MC products within Australia.

Keywords: Australia; authorised prescriber scheme; cannabinoid; medicinal cannabis; prescribing trends; regulation; special access scheme; therapeutic goods administration (TGA).


Conflict of interest statement

RC is an owner of Cannabis Consulting Australia; however, receives no financial or commercial benefit from the results of this study. The remaining authors declare that the research was conducted in the absence of any commercial or financial relationships that could be construed as a potential conflict of interest.

Figures

FIGURE 1
FIGURE 1
SAS-B approvals over time. There have been 159,665 cumulative SAS-B approvals since 2016, with growth that followed a Negative binomial, 3rd degree polynomial curve (R2 = 0.998, Δm = 44.398; (A). Applications per month increase by around 12,000 a month, following a Negative binomial, 4th degree polynomial curve (R2 = 0.984, Δm = 22.590; (B). Solid lines represent the best fit with shaded standard error of the mean (SEM).
FIGURE 2
FIGURE 2
Growth across indication groups differs. Trends in monthly approvals over time were analyzed in six ICD-10 groups representing almost all cumulative approvals (Supplementary Table S1). Approvals for symptoms, signs and abnormal clinical and laboratory findings, not elsewhere classified (A); mental and behavioral disorders (B); neoplasms (C); and diseases of the nervous system (D) followed Negative binomial, 4th degree polynomial curves (R2 = 0.989, 0.993, 0.976, and 0.976, and Δm = 7.055, 18.903, 20.462, and 6.037, respectively). Approvals for diseases of the musculoskeletal system and connective tissue (E); and factors influencing health status and contact with health services (F) followed Negative binomial 3rd degree polynomial curves (R2 = 0.894 and 0.831, and Δm = 83.058 and 49.676, respectively). Solid lines represent the best fit with shaded standard error of the mean.
FIGURE 3
FIGURE 3
Growth is varied across indication categories. Trends in monthly approvals over time were analyzed in ICD-10 indication categories with >1,000 cumulative approvals (Supplementary Table S1). Approvals for pain (A); anxiety (B); sleep disorders (C); and PTSD (F) followed Negative binomial, 2nd degree polynomial curves (R2 = 0.988, 0.989, 0.987, and 0.973, and Δm = 13,202.020, 1,413.481, 51.913, and 54.544, respectively). Approvals for cancer and related symptoms (D); and neuropathy (E) followed Negative binomial 4th degree polynomial curve (R2 = 0.981 and 0.962, and Δm = 17.271 and 21.698, respectively). Approvals for epilepsy (G) moderately followed a Negative binomial 4th degree polynomial curve (R2 = 0.587, Δm = 7.922). Approvals for ASD (H) and convulsions (I) followed Negative binomial 3rd degree polynomial curves (R2 = 0.977 and 0.918, and Δm = 27.715 and 31.812, respectively). Solid lines represent the best fit with shaded standard error of the mean.
FIGURE 4
FIGURE 4
Flower and Schedule 8 products have disproportionate growth. Growth trends in product format (A,B) and product schedule (C,D). Approvals for oil products followed a Negative binomial 4th degree polynomial curve (R2 = 0.980, Δm = 18.292), while approvals for flower followed a Negative binomial 3rd degree polynomial curve (R2 = 0.991, Δm = 8.267). The proportion (%) of approvals per product category (see legend) are shown in panel (B). Approvals for S4 and S8 products followed Negative binomial 4th degree polynomial curves (C; R2 = 0.934 and 0.987, and Δm = 11.691 and 15.707, respectively). The proportion (%) of approvals per product schedule (see legend) are presented in panel (D). The gap (between February 2016 and June 2016 in panels (B) and (D), indicates no applications submitted in this period. In panels (A) and (C) Solid lines represent best fit with shaded standard error of the mean.
FIGURE 5
FIGURE 5
Patient demographics for SAS-B approvals. Growth trends in age groups (A,B) and in patient genders (C,D). Approvals for patients younger than 18 years and between 31 and 37 years of age followed a Negative binomial 3rd degree polynomial curve (R2 = 0.888 and 0.993, and Δm = 6.750 and 22.056, respectively); approvals for patients between 18 and 30 years of age followed a Negative binomial 2nd degree polynomial curve (R2 = 0.986, and Δm = 58.345); approvals for patients in age groups 38 to 44, 45 to 52, 53 to 60, 61 to 71, and over 71 years of age followed a Negative binomial 4th degree polynomial curve (R2 = 0.990, 0.990, 0.991, 0.985, and 0.989, and Δm = 10.929, 16.765, 10.162, 27.937, and 8.374, respectively). Panel (B) shows the proportion of approvals for each age category (see legend) per month. Approvals for females and males followed Negative binomial 4th degree polynomial curves (C; R2 = 0.986 and 0.989, and Δm = 32.522 and 16.797, respectively). The proportion (%) of approvals by patient gender per month are shown in panel (D). Solid lines in panels (A) and (C) represent best fit with shaded standard error of the mean. The gap (between February 2016 and June 2016 in panels (B) and (D), indicates no applications submitted in this period.
FIGURE 6
FIGURE 6
SAS-B approvals across states and territories. The number of SAS-B approvals per month across states and territories represented as per 100,000 persons. Approvals from the Northern Territory (NT) followed a Poisson 1st degree polynomial curve (R2 = 0.772). Approvals from Australian Capital Territory (ACT) and Western Australia (WA) followed Negative binomial, 2nd degree polynomial curves (R2 = 0.926 and 0.986, and Δm = 24.998, and 1,525.398, respectively). Approvals Victoria (VIC) followed a Negative binomial, 3rd degree polynomial curves (R2 = 0.934, Δm = 11.759). Approvals New South Wales (NSW), Queensland (QLD) and South Australia (SA) followed Negative binomial, 4th degree polynomial curves (R2 = 0.982, 0.986, and 0.926, and Δm = 6.783, 73.955, and 4.143, respectively). Approvals from Tasmania (TAS) moderately followed a Negative binomial, 3rd degree polynomial curve (R2 = 0.402, Δm = 2.611). Solid lines represent best fit with shaded standard error of the mean.
FIGURE 7
FIGURE 7
Associations between age, product format, and indication. Correspondence analyses with groups of age compared with indication (A), indication compared with product preference (with an inset representing an expanded view of the dashed area; (B), and age compared with product preference (C). Description of deviation from independence is labelled with the according axes, while the red to blue color gradient indicates the scaled contribution of these factors to the overall variance (the inertia*100; “Ctr”) for each graph. The maximum inertia*100 are 33.07, 8.47, and 5.56, respectively. See Supplementary Tables S3–S5 for the contribution of variance related to these graphs.

References

    1. Alexander S. P. (2020). Barriers to the Wider Adoption of Medicinal Cannabis. Br. J. Pain 14, 122–132. 10.1177/2049463720922884 - DOI - PMC - PubMed
    1. Anderson L. L., Low I. K., McGregor I. S., Arnold J. C. (2020). Interactions between Cannabidiol and Δ9-tetrahydrocannabinol in Modulating Seizure Susceptibility and Survival in a Mouse Model of Dravet Syndrome. Br. J. Pharmacol. 177, 4261–4274. 10.1111/bph.15181 - DOI - PMC - PubMed
    1. Arnold J. C., Nation T., McGregor I. S. (2020). Prescribing Medicinal Cannabis. Aust. Prescr 43, 152–159. 10.18773/austprescr.2020.052 - DOI - PMC - PubMed
    1. Australian Bureau of Statistics (2021). National, State and Territory Population. [Online]. Available at: https://www.abs.gov.au/statistics/people/population/national-state-and-t... (Accessed October, 2021).
    1. Australian Institute of Health and Welfare (2021). COVID-19 Impact on Mental Health [Online]. Canberra, ACT: Australian Government. Available at: https://www.aihw.gov.au/reports/mental-health-services/mental-health-ser... .

LinkOut - more resources