. 2022 May 10:13:872224.
doi: 10.3389/fgene.2022.872224. eCollection 2022.

Association of a Novel DOCK2 Mutation-Related Gene Signature With Immune in Hepatocellular Carcinoma

Affiliations

Association of a Novel DOCK2 Mutation-Related Gene Signature With Immune in Hepatocellular Carcinoma

Yushen Huang et al. Front Genet. .

Abstract

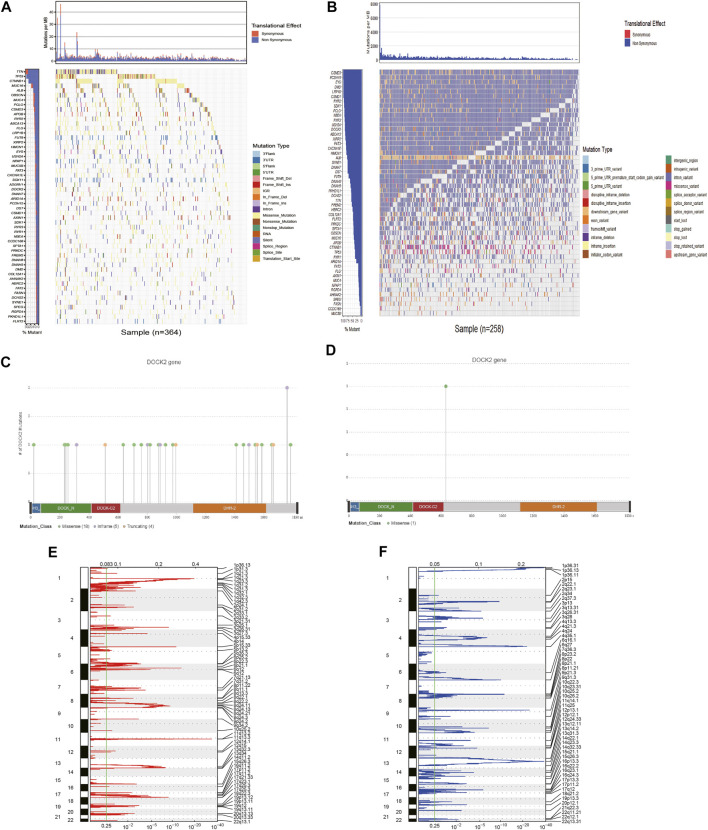
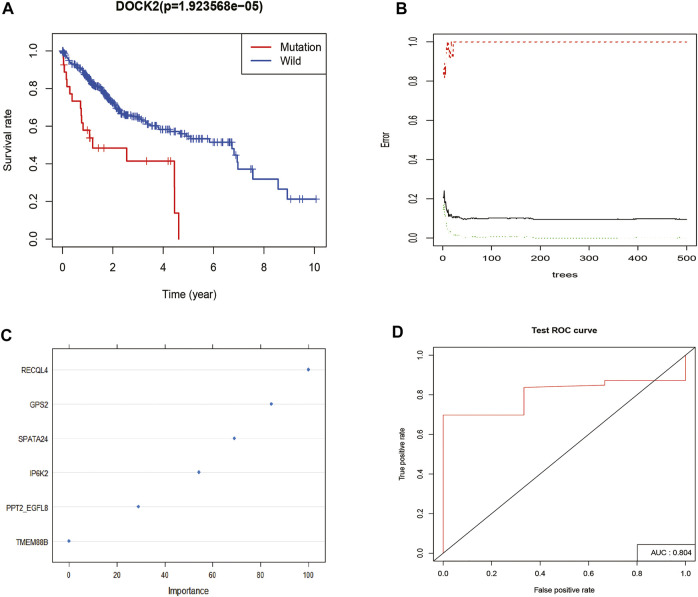
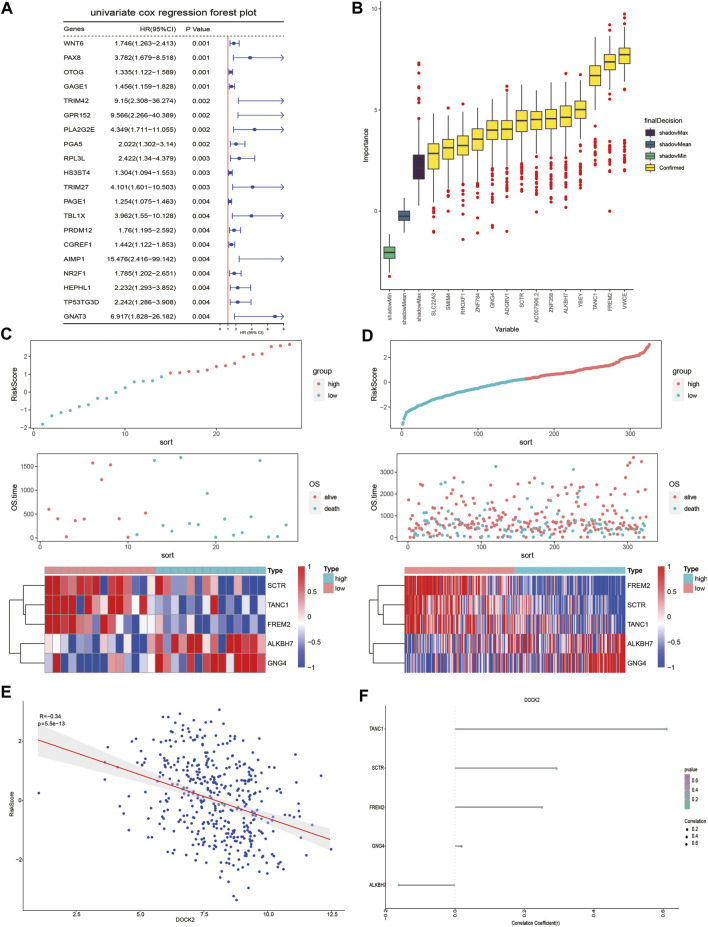
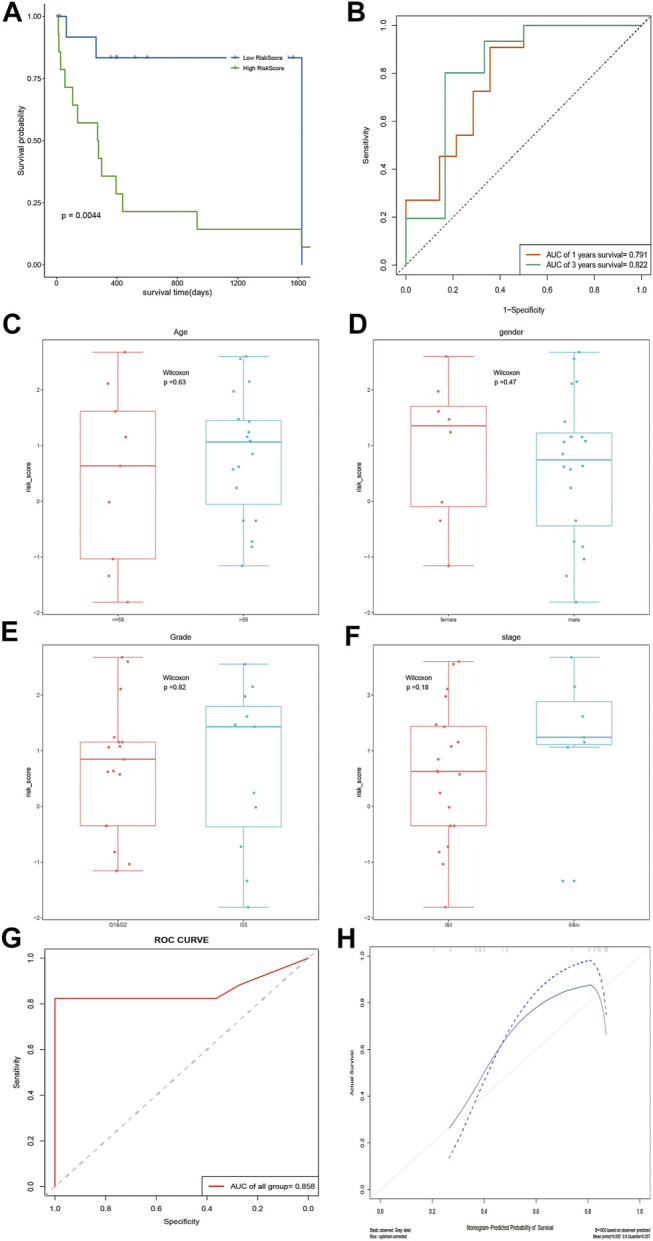
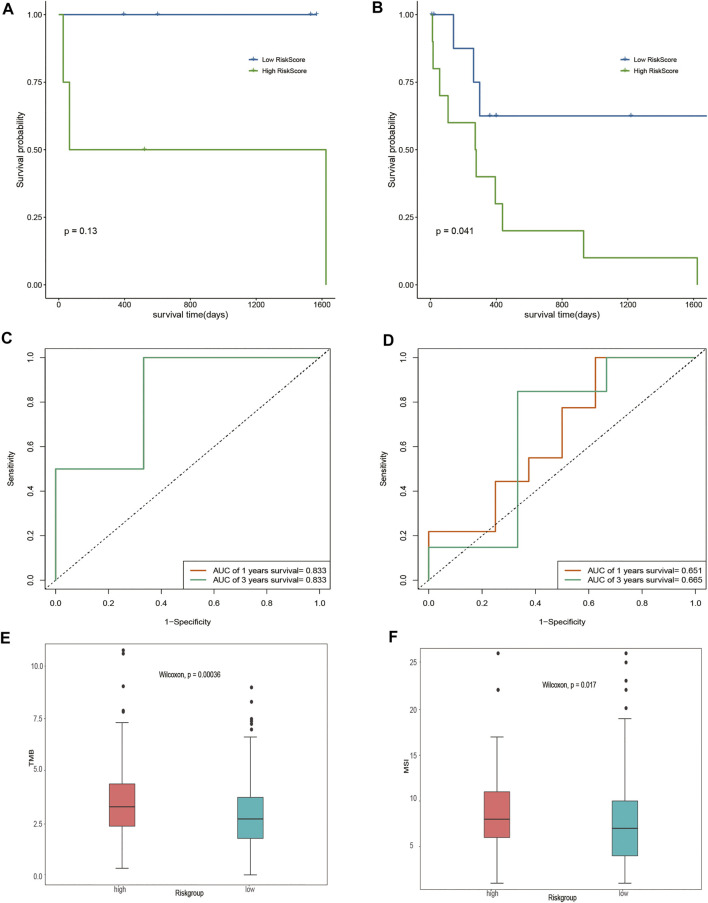
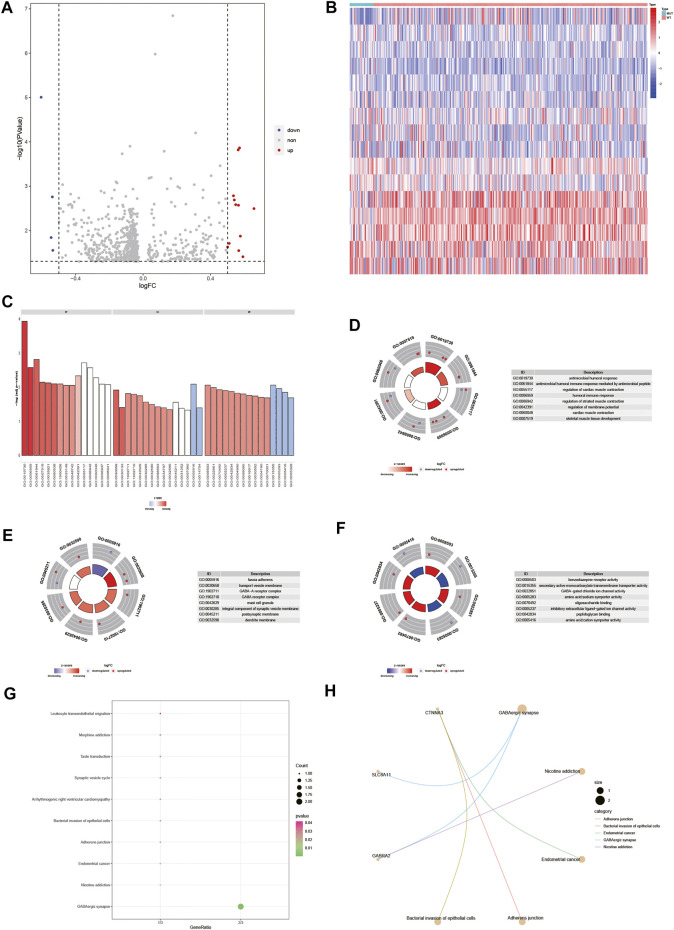
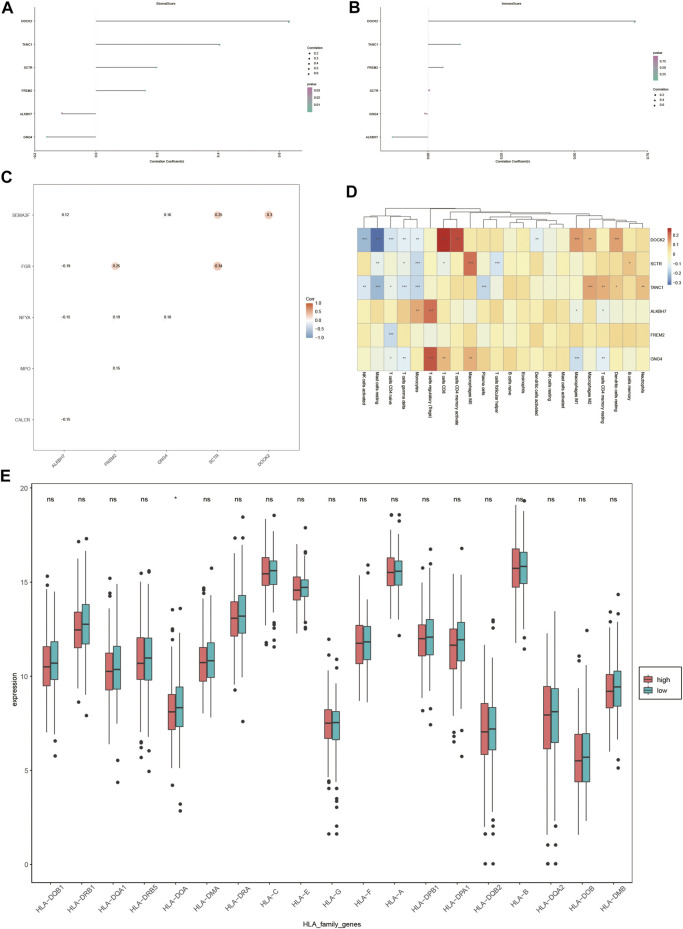
Hepatocellular carcinoma (HCC) is a malignant tumor with high morbidity and mortality worldwide. Many studies have shown that dedicator of cytokinesis 2 (DOCK2) has a crucial role as a prognostic factor in various cancers. However, the potentiality of DOCK2 in the diagnosis of HCC has not been fully elucidated. In this work, we aimed to investigate the prognostic role of DOCK2 mutation in HCC. The Cancer Genome Atlas (TCGA) and the International Cancer Genome Consortium (ICGC) cohorts were utilized to identify the mutation frequency of DOCK2. Then, univariate Cox proportional hazard regression analysis, random forest (RF), and multivariate Cox regression analysis were performed to develop the risk score that was significantly related to DOCK2 mutation. Moreover, Gene Set Enrichment Analysis (GSEA), Gene Set Variation Analysis (GSVA), and immune correlation analysis were conducted for an in-depth study of the biological process of DOCK2 mutation involved in HCC. The results revealed that the mutation frequency of DOCK2 was relatively higher than that in non-cancer control subjects, and patients with DOCK2 mutations had a low survival rate and a poor prognosis compared with the DOCK2-wild group. In addition, the secretin receptor (SCTR), tetratricopeptide repeat, ankyrin repeat and coiled-coil domain-containing 1 (TANC1), Alkb homolog 7 (ALKBH7), FRAS1-related extracellular matrix 2 (FREM2), and G protein subunit gamma 4 (GNG4) were found to be the most relevant prognostic genes of DOCK2 mutation, and the risk score based on the five genes played an excellent role in predicting the status of survival, tumor mutation burden (TMB), and microsatellite instability (MSI) in DOCK2 mutant patients. In addition, DOCK2 mutation and the risk score were closely related to immune responses. In conclusion, the present study identifies a novel prognostic signature in light of DOCK2 mutation-related genes that shows great prognostic value in HCC patients; and this gene mutation might promote tumor progression by influencing immune responses. These data may provide valuable insights for future investigations into personalized forecasting methods and also shed light on stratified precision oncology treatment.

Keywords: DOCK2; biomarker; hepatocellular carcinoma; immune; prognosis.


Conflict of interest statement

The authors declare that the research was conducted in the absence of any commercial or financial relationships that could be construed as a potential conflict of interest.

Figures

FIGURE 1
FIGURE 1
Analysis of somatic mutation and copy number variation in patients with HCC. (A) 54 genes with the highest mutation frequency in LIHC patients in TCGA cohort. (B) Mutations of 54 genes in ICGC. The panels on the left of the two waterfall charts show genes with high-frequency mutations in different cohorts, and the order was based on their mutation frequency; The panels on the right side of the two waterfall charts reveal different types of mutations represented by various color modules. (C) DOCK2 mutation in TCGA cohort. (D) DOCK2 mutation in the ICGC cohort. (E,F) Identification of significantly amplified and deleted genes. The mRNA located at the focal CNA peak was related to LIHC. The false discovery rate (Q value) and the change score of GISTIC2.0 (x-axis) corresponded to the genome position (y-axis). The dotted line indicates the centromere. The green line represents the significant cutoff (q value of 0.25).
FIGURE 2
FIGURE 2
DOCK2 mutation survival analysis and model construction. (A) Effect of DOCK2 mutation on OS and its significance. Blue indicates the DOCK2 wild type; red indicates the DOCK2 mutant type. (B) Relationship between the model error and the number of decision trees. (C) Importance of DOCK2 mutation model variables. (D) Performance of the DOCK2 mutation model in the test set.
FIGURE 3
FIGURE 3
DOCK2 mutation prognostic model. (A) Forest plot of the top 20 prognostic-related genes obtained by univariate regression analysis. The left side of the vertical red line is the protective gene, and the right side is the dangerous gene. (B) 14 important features selected based on RF. (C,D) Risk score, survival status, and characteristic gene expression of DOCK2 mutant and DOCK2 wild type, respectively. (E) Scatter plot of the correlation between DOCK2 expression and risk score. (F) Correlation between DOCK2 and characteristic genes. The size of the dot represents the strength of the correlation between DOCK2 and the characteristic gene; the size of the point is proportional to the correlation. The color of the dot represents the p-value; the greener the color, the smaller the p-value, and the pinker the color, the greater the p-value. p-value ≤ 0.05 was considered statistically significant.
FIGURE 4
FIGURE 4
Analysis of the prognostic model and clinical prediction model. (A) The impact of risk score on patients’ OS and its significance. Blue meant a low-risk score, and green meant a high-risk score. (B) Time-dependent ROC analysis of risk score. (C–F) Correlation analysis of risk score with age, gender, tumor stage, and clinical stage. (G) ROC curve of a clinical prediction model in 28 DOCK2 mutant samples. (H) Calibration curve of the clinical prediction model. The X-axis was the outcome probability predicted by the model. The Y-axis was the value obtained by actual observation, and the calculation was repeated 1,000 times. The blue solid line is the calibration curve, and the diagonal line is the ideal curve. The closer the calibration curve was to the ideal curve, the better the predictive ability of the model.
FIGURE 5
FIGURE 5
Assessment of risk score. (A,B) Impact of risk score on OS in the subgroup of inactivated mutations and other subgroups of non-silent mutations and its significance, respectively. Blue means a low-risk score, and green means a high-risk score. (C,D) Time-dependent ROC analysis of the risk score in the subgroup of inactivated mutations and other subgroups of non-silent mutations. (E) Analysis of the correlation between TMB and risk score. Pink represents the high-risk group, and green represents the low-risk group. (F) Correlation analysis between MSI and risk score. Pink represents the high-risk group, and green represents the low-risk group.
FIGURE 6
FIGURE 6
Differential gene and its functional enrichment analysis. (A) Abscissa is log2FoldChange, and the ordinate is −log10 (adjust p-value). The red nodes indicates upregulation, the blue nodes indicate downregulation, and the gray nodes represent insignificant expression. (B) Abscissa is the patient ID, and the ordinate is the differential gene. Red represents high gene expression, and blue represents low gene expression. The green comment bar indicates the DOCK2 mutant sample, while the red comment bar indicates the DOCK2 wild-type sample. (C–F) GO function enrichment analysis of differential genes and display of BP, MF, and CC. (D–F) Color of the node indicates the level of gene expression value. Blue represents that the expression value was downregulated, and red indicates that the expression value was upregulated. The middle quadrilateral represents the effect of genes on the enriched GO terms. Light color means inhibition; dark color means activation. (G) KEGG pathway enrichment analysis. The abscissa is the gene ratio, and the ordinate is the pathway name. The size of the node indicates the number of genes enriched in the pathway, and the color of the node indicates −log10 (p-value). (H) Display of the first five items in the KEGG enrichment analysis of differential genes.
FIGURE 7
FIGURE 7
GSEA and GSVA. (A,B) Results of GSEA biological function enrichment. (C,D) Results of biological pathway enrichment. (E) Heat map of the significant hallmark analyzed by GSVA. (F,H) Scatter plot of correlation between significant hallmark and risk score.
FIGURE 8
FIGURE 8
Immune correlation analysis. (A,B) Correlation of DOCK2 and characteristic genes with the content of immune cells and stromal cells. (C) Correlation between DOCK2 and characteristic genes and immune genes. (D) Correlation of DOCK2 and characteristic gene expression with immune cell infiltration. (E) Correlation between HLA family expression and the risk score.

Similar articles

Cited by

References

    1. Ashburner M., Ball C. A., Blake J. A., Botstein D., Butler H., Cherry J. M., et al. (2000). Gene Ontology: Tool for the Unification of Biology. Nat. Genet. 25 (1), 25–29. 10.1038/75556 - DOI - PMC - PubMed
    1. Bayliss W. M., Starling E. H. (1902). The Mechanism of Pancreatic Secretion. J. Physiol. 28, 325–353. 10.1113/jphysiol.1902.sp000920 - DOI - PMC - PubMed
    1. Bhattacharya S., Andorf S., Gomes L., Dunn P., Schaefer H., Pontius J., et al. (2014). ImmPort: Disseminating Data to the Public for the Future of Immunology. Immunol. Res. 58 (2-3), 234–239. 10.1007/s12026-014-8516-1 - DOI - PubMed
    1. Bjerre M. T., Strand S. H., Nørgaard M., Kristensen H., Rasmussen A. K., Mortensen M. M., et al. (2019). Aberrant DOCK2, GRASP, HIF3A and PKFP Hypermethylation Has Potential as a Prognostic Biomarker for Prostate Cancer. Int. J. Mol. Sci. 20 (5), 1173. 10.3390/ijms20051173 - DOI - PMC - PubMed
    1. Chan T. A., Yarchoan M., Jaffee E., Swanton C., Quezada S. A., Stenzinger A., et al. (2019). Development of Tumor Mutation burden as an Immunotherapy Biomarker: Utility for the Oncology Clinic. Ann. Oncol. 30 (1), 44–56. 10.1093/annonc/mdy495 - DOI - PMC - PubMed