. 2022 May 9:13:890551.
doi: 10.3389/fpls.2022.890551. eCollection 2022.

Combined Drought and Heat Stress Influences the Root Water Relation and Determine the Dry Root Rot Disease Development Under Field Conditions: A Study Using Contrasting Chickpea Genotypes

Affiliations

Combined Drought and Heat Stress Influences the Root Water Relation and Determine the Dry Root Rot Disease Development Under Field Conditions: A Study Using Contrasting Chickpea Genotypes

Aswin Reddy Chilakala et al. Front Plant Sci. .

Abstract

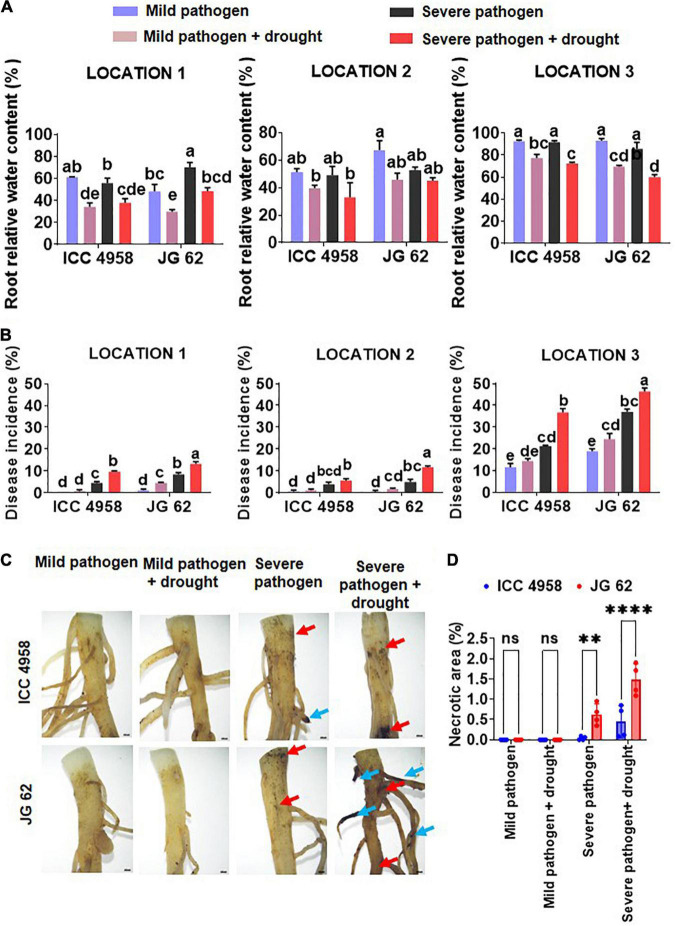
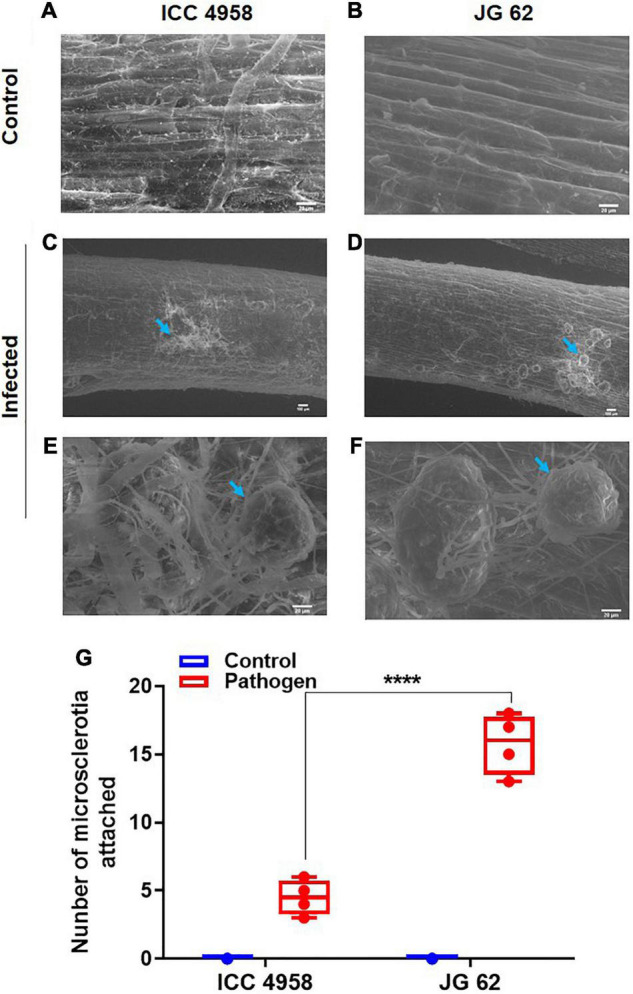
Abiotic stressors such as drought and heat predispose chickpea plants to pathogens of key importance leading to significant crop loss under field conditions. In this study, we have investigated the influence of drought and high temperature on the incidence and severity of dry root rot disease (caused by Macrophomina phaseolina) in chickpea, under extensive on- and off-season field trials and greenhouse conditions. We explored the association between drought tolerance and dry root rot resistance in two chickpea genotypes, ICC 4958 and JG 62, with contrasting resistance to dry root rot. In addition, we extensively analyzed various patho-morphological and root architecture traits altered by combined stresses under field and greenhouse conditions in these genotypes. We further observed the role of edaphic factors in dry root rot incidence under field conditions. Altogether, our results suggest a strong negative correlation between the plant water relations and dry root rot severity in chickpeas, indicating an association between drought tolerance and dry root rot resistance. Additionally, the significant role of heat stress in altering the dynamics of dry root rot and the importance of combinatorial screening of chickpea germplasm for dry root rot resistance, drought, and heat stress have been revealed.

Keywords: Cicer arietinum; Macrophomina phaseolina; combined stress; disease resistance; drought; heat; plant water status; stress tolerance.


Conflict of interest statement

The authors declare that the research was conducted in the absence of any commercial or financial relationships that could be construed as a potential conflict of interest.

Figures

FIGURE 1
FIGURE 1
On-season field trials exhibiting the influence of plant-water relations in dry root rot (DRR) disease aggravation. The four treatments considered were- mild pathogen (fields frequent irrigated to maintain 80% FC and treated with appropriate fungicide), mild pathogen + drought (less frequently irrigated fields to maintain 50% FC and treated with appropriate fungicide), severe pathogen (frequently irrigated fields to maintain 80% FC without any fungicide application), severe pathogen + drought (less frequently irrigated fields to maintain 50% FC without any fungicide application) for both the genotypes ICC 4958 and JG 62. (A) Root relative water content of the two contrasting chickpea genotypes under different stress and their combinations across different experimental locations. The bars in the following graphs are the averages of their respective block replicates with standard error as error bars. Under field conditions, we did not observe a non-symptomatic control plot as the minor infection was reported in the control (fungicide treated) plot as well. This treatment is mentioned as a “mild pathogen”. (B) The disease incidence data, was collected at the late podding stage and additionally at the harvest stage from plants with symptomatic roots for confirmation from three locations under different stress treatments. The bars in the following graphs are the averages of their respective block replicates with standard error as error bars. (C) Root images showing the root branching zone 1 of 29 days old JG 62 and ICC 4958 plants exposed to a mild pathogen, severe pathogen, mild pathogen + drought, severe pathogen + drought, for 10 days under greenhouse conditions. The dark-colored lesions show the severity and higher infection in JG 62 over ICC 4958. Root images were captured under 0.63X objective lens of SMZ25 research stereomicroscope. Blue arrows show the necrotized lateral roots. Red arrows indicate the necrotic spots. The details of the locations are provided in Supplementary Table 2. Statistical significance between means was checked by two-way ANOVA and Tukey’s Posthoc test. The different letters denote a significant difference between mean at p < 0.05. (D) Graph represents the root necrosis area (%) of two cultivars for different treatments mild pathogen, severe pathogen, mild pathogen + drought, severe pathogen + drought. The bars on the graph indicate the averages of different treatments for 4 replicates with standard error as an error bar. Statistical significance difference between means is checked by two-way ANOVA and sidak’s mean multiple comparison test. The **p < 0.01, ****p < 0.0001., ns, non-significant.
FIGURE 2
FIGURE 2
Differences in root architectural traits in the two chickpea genotypes across the different stress treatments. (A) A representative segmentation figure panel from the root scanning image analysis of ICC 4958 and JG 62 plants subjected to the mild pathogen, severe pathogen, mild pathogen + drought, and severe pathogen + drought. The analysis was done using Scanjet G4050 Photo Scanner and the images were analyzed using GIA roots (Galkovskyi et al., 2012). (B) The root trait variations were observed in the genotypes across the treatments. The image analysis data was accrued from the images of washed roots of 43 days old plants grown in greenhouse conditions using field soil from location 1. The bars on the graph indicate the averages of different traits for 3 RCB replicates with standard error as an error bar. Statistical significance difference between means is checked by one-way ANOVA and Tukey’s posthoc test. A significant difference between the mean at p < 0.05.
FIGURE 3
FIGURE 3
Root images indicating the differential attachment of M. phaseolina microsclerotia on the ICC 4958 and JG 62. ICC 4958 showed resistance to DRR pathogen (MH509971.1) infection. ICC 4958 and JG 62 were subjected to infection by microsclerotia under well-watered conditions using the blotting paper method (Irulappan and Senthil-Kumar, 2021). Roots were collected and examined for the number of attached microsclerotia using the scanning electron microscope. (A) Uninfected root images of ICC 4958. (B) Uninfected root images of JG 62. (C) Infected ICC 4958 roots showing attached microsclerotia. (D) JG 62 roots show the attached microsclerotia. (E) Mycelial growth on ICC 4958 roots. (F) Extensive growth of mycelia from the attached microsclerotia in JG 62. (G) The graph shows the variation in attached microsclerotia. Two-way ANOVA was used. Asterisks show the significance at ****p ≤ 0.0001. N = 5. The experiment was repeated three times at least.
FIGURE 4
FIGURE 4
Combined drought and heat stress significantly alter the DRR disease development in chickpeas. Chickpea plants were exposed to different treatments namely, control, drought, heat, mild pathogen, mild pathogen + drought, severe pathogen, severe pathogen + drought, mild pathogen + heat, mild pathogen + heat + drought, severe pathogen + heat, and severe pathogen + heat + drought under field conditions during the off-season field trials. The control, drought, heat treatments were maintained separately in the isolated field and greenhouse conditions (Supplementary Figure 4). (A) Root relative water content of the two contrasting chickpea genotypes under different individual and combined stresses from the off-season field trials. (B) The DRR disease incidence in chickpea plants exposed to DRR under individual and combined drought and heat stresses. The treatment combinations are from both the on-season and off-season trials at Location 1. The bars in the following graphs are the average of respective block replicates with standard deviation as an error bar. Statistical significance between means was checked by two-way ANOVA and Tukey’s posthoc test.
FIGURE 5
FIGURE 5
Effect of drought and heat stress on DRR disease severity in ICC 4958 and JG 62 chickpea genotypes. (A) Disease severity in the two genotypes under different stress treatments, namely control, drought, pathogen, drought + pathogen, heat, heat + drought, heat + pathogen, heat + drought + pathogen. (B) Root water potential (C) Leaf water potential of the individual and combined stressed ICC 4958 and JG 62 as measured on the 30th day post-drought imposition (Supplementary Figure 15). Root and leaf water potential were measured using Wiscor Psyprometer in 3 biological replicates per treatment. One replicate constituted three pots per set with each pot having two plants. Error bar signifies the SEM. Statistical significance difference between means is checked by one-way ANOVA and Tukey’s Posthoc test. The different letters denote a significant difference between mean at p < 0.05.
FIGURE 6
FIGURE 6
Schematic summary showing the effect of drought and heat on chickpea water relations and response to DRR. (A) Illustration comparing the effect of individual drought, drought + pathogen, drought + pathogen + heat on water relations of chickpea. Both drought-only and combined drought and pathogen treatments reduce the root and leaf water content apparently due to reduction in the root-associated traits like network area, volume, and length. Enhanced transpiration under heat stress further reduces the root water status. The differences in the leaf and root water status, root architectural traits, and soil water content in the three treatments are indicated by black-colored arrows. The length of the arrows represents the extent of reduction (the longer the arrows, the more are the reductions). (B) Schematic representation of the possible mechanisms by which heat can reduce the resistance of a drought-tolerant variety to DRR. The left-hand side panel indicates the differential response of a drought-tolerant and susceptible variety to drought, pathogen, and combination of drought, heat, and pathogen. Whereas ICC 4958 can resist DRR infection better under drought conditions, heat makes it significantly susceptible to DRR. The right-hand panel represents the possible mechanism behind the same. A combination of pathogen and heat stress additively reduces the plant water content and disrupts the resistance to DRR shown by ICC 4958 under drought stress conditions. We hypothesize that drastic reduction in root water content mediated by heat may be one of the primary physiological processes behind the loss of resistance of ICC 4958 under heat stress. Broken arrows exhibit a predicted observation warranting future investigations. P, pathogen stress; H, heat stress, D + H, combined drought and heat stress. In panel (A), the colors of the shoots represent the effect of soil water deficit and pathogen infection on plants. Since M. phaseolina is a root infecting pathogen, symptoms are not very visible in shoots. A combination of drought and DRR pathogen leads to enhanced disease and reduced shoot water status indicated by the faded color of the shoots. The combination of heat, drought, and pathogen causes further additive reductions in leaf water status and an increase in disease severity which is indicated by the brown coloration of the shoot showing the maximum deleterious effect of the triple stress combination.

References

    1. Baird R. E., Watson C. E., Scruggs M. (2003). Relative longevity of Macrophomina phaseolina and associated mycobiota on residual soybean roots in the soil. Plant Dis. 87 563–566. 10.1094/PDIS.2003.87.5.563 - DOI - PubMed
    1. Cabral R. N., Marouelli W. A., Café-Filho A. C. (2020). Irrigation management strategies for reducing verticillium wilt severity in eggplants. Summa Phytopathol. 46 9–13. 10.1590/0100-5405/190000 - DOI
    1. Chai Y. N., Schachtman D. P. (2022). Root exudates impact plant performance under abiotic stress. Trends Plant Sci. 27 80–91. 10.1016/j.tplants.2021.08.003 - DOI - PubMed
    1. de Sousa Linhares C. M., Ambrósio M. M. Q., Castro G., Torres S. B., Esteras C., De Sousa Nunes G. H., et al. (2020). Effect of temperature on disease severity of charcoal rot of melons caused by Macrophomina phaseolina: implications for selection of resistance sources. Eur. J. Plant Pathol. 158 431–441. 10.1007/s10658-020-02083-w - DOI
    1. Deokar A. A., Kondawar V., Jain P. K., Karuppayil S. M., Raju N., Vadez V., et al. (2011). Comparative analysis of expressed sequence tags (ESTs) between drought-tolerant and-susceptible genotypes of chickpea under terminal drought stress. BMC Plant Biol. 11:70. 10.1186/1471-2229-11-70 - DOI - PMC - PubMed

LinkOut - more resources