

Glyoxalase 1 knockdown induces age-related β-cell dysfunction and glucose intolerance in mice
- PMID: 35620868
- PMCID: PMC9253754
- DOI: 10.15252/embr.202152990
Glyoxalase 1 knockdown induces age-related β-cell dysfunction and glucose intolerance in mice
Abstract
Tight control of glycemia is a major treatment goal for type 2 diabetes mellitus (T2DM). Clinical studies indicated that factors other than poor glycemic control may be important in fostering T2DM progression. Increased levels of methylglyoxal (MGO) associate with complications development, but its role in the early steps of T2DM pathogenesis has not been defined. Here, we show that MGO accumulation induces an age-dependent impairment of glucose tolerance and glucose-stimulated insulin secretion in mice knockdown for glyoxalase 1 (Glo1KD). This metabolic alteration associates with the presence of insular inflammatory infiltration (F4/80-positive staining), the islet expression of senescence markers, and higher levels of cytokines (MCP-1 and TNF-α), part of the senescence-activated secretory profile, in the pancreas from 10-month-old Glo1KD mice, compared with their WT littermates. In vitro exposure of INS832/13 β-cells to MGO confirms its casual role on β-cell dysfunction, which can be reverted by senolytic treatment. These data indicate that MGO is capable to induce early phenotypes typical of T2D progression, paving the way for novel prevention approaches to T2DM.
Keywords: aging; dicarbonyl stress; glyoxalase 1; insulin secretion; methylglyoxal.
© 2022 The Authors.
Figures

- A–I
Data distribution of the absolute quantification of Glo1 (A–C), Akr1b3 (D–F), and Aldh1a3 (G–I) gene expression measured by qRT–PCR in skeletal muscle (quadriceps) (A, D, and G), white adipose tissue (WAT, epididymal fat) (B, E, and H) and liver (C, F, and I) of 10‐month‐old Glo1KD (n = 5 in D; n = 6 in F and I; n = 7 in C and G; n = 8 in A and H; n = 9 in B and E) and WT mice (n = 6 in E, F and I; n = 7 in B–D, G and H; n = 8 in A). Cyclophilin A was used as reference gene. Gene expression is shown as the ratio of Glo1, Akr1b3, or Aldh1a3 to Cyclophilin A copy number (arbitrary units, AU).

- A, B
Evaluation of glucose tolerance in 5‐month‐old (A, WT n = 19 and Glo1KD n = 20) and 10‐month‐old mice (B, n = 15) by ipGTT. Line graphs show the trend of blood glucose levels within 120 min after intraperitoneal administration of a glucose bolus (2 g/kg). Bar graphs on the right side of panels A and B show the GTT IAUC of Glo1KD and WT mice.
- C, D
Evaluation of insulin sensitivity in 5‐month‐old (C, WT n = 8 and Glo1KD n = 7) and 10‐month‐old mice (D, WT n = 5 and Glo1KD n = 7) by ITT. Line graphs show the trend of blood glucose levels within 120 min after intraperitoneal administration of an insulin bolus (0.75 U/kg). Blood glucose was measured by the use of a portable blood glucometer at the indicated time points (X axes). Bar graphs on the right side of panels C and D show the ITT iAUC of Glo1KD and WT mice.

- A, B
Line graphs show the serum insulin levels at 0, 3, and 30 min following the administration of an intraperitoneal glucose bolus (3 g/kg) in mice at 5 months (A, WT n = 6 and Glo1KD n = 4) and 10 months of age (B, n = 6). Bar graphs on the right side of panels show the IAUC monitored during the insulin secretion test in Glo1KD and WT mice.

- A
Pancreatic sections (20× magnification) from 10‐month‐old WT and Glo1KD mice stained with hematoxylin and eosin (H&E), anti‐insulin, anti‐glucagon, and anti‐F4/80 antibodies are representative of sections from 7 mice each group.
- B, C
Insular inflammatory infiltration indicated as incidence (% of infiltrated islets) (B) and severity score (C). Severity of infiltration has been graded as follows: absent (0), low (1), moderate (2), and high (3) (n = 7 mice for each genotype).
- D–G
Morphometric analysis of islets indicated as the number of islets per sections (D) and the size of islets, calculated as the area (E), the major diameter (F), and the minor diameter (G) of the islets per mouse (n = 7 mice for each genotype).
- H–J
Insulin and glucagon IS, calculated as the intensity score multiplied with percentage of positive cells (H, I) and the percentage of islets area stained with F4/80 (J) (n = 7 mice for each genotype).
- K, L
Quantification of insulin (K) and glucagon (L) content in islet extracts by immunoenzymatic assay (n = 7 WT mice vs. n = 10 Glo1KD mice).
- M
MGO content in pancreatic lysates by LC‐MS/MS (n = 6 mice for each genotype).

- A–C
Data distribution of the absolute quantification of Adgre1 (A), Cd68 (B), and Glo1 (C) gene expression measured by qPCR in pancreatic tissue from WT and Glo1KD mice at 5 (upper panels, WT n = 9, Glo1KD n = 7 in A, C and n = 8 in B) and 10 months of age (lower panels, WT n = 7, Glo1KD n = 9 in A, B and n = 10 in C).
- D, E
Data distribution of the absolute quantification of Adgre1 (D) and Cd68 (E) gene expression measured by qPCR in the isolated islets from WT and Glo1KD mice at 5 (upper panels, WT n = 7 in D and 6 in E, Glo1KD n = 7) and 10 months of age (lower panels, WT n = 7, Glo1KD n = 7 in D and 6 in E). Cyclophilin A was used as reference gene. Gene expression is shown as the ratio of Adgre1, Cd68, or Glo1 to Cyclophilin A copy number (AU).
- F, G
Ex vivo GSIS showed as fold of increase (F) and as insulin concentration released into the secretion media (G) in response to the basal condition at 2.8 mM glucose and to the stimulated condition at 16.7 mM glucose, of pancreatic islets from WT (n = 8) and Glo1KD mice (n = 9) at 10 months of age. Insulin concentration was normalized on DNA islets content.
- A, B
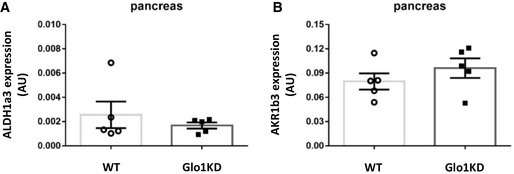
Data distribution of the absolute quantification of Aldh1a3 (A) and Akr1b3 (B) gene expression measured by qRT–PCR in the pancreas of WT and Glo1KD mice (n = 5). Cyclophilin A was used as reference gene. Gene expression is shown as the ratio of Aldh1a3 or Akr1b3 to Cyclophilin A copy number (AU).

- A, B
Data distribution of the absolute quantification of Itgax gene expression measured by qPCR in the isolated islets from WT and Glo1KD mice at 5 (A, WT n = 6 and Glo1KD n = 8) and 10 months of age (B, WT n = 7 and Glo1KD n = 6).

- A–C
Data distribution of the absolute quantification of Adgre1 gene expression measured by qRT–PCR in liver (A), white adipose tissue (WAT, perigonadal fat) (B), and skeletal muscle (C) of WT (n = 7 in A, C and n = 6 in B) and Glo1KD mice (n = 7) at 10 months of age. Cyclophilin A was used as reference gene.

- A–C
Data distribution of the absolute quantification of IL‐1β (A), MCP‐1 (B), and TNF‐α gene expression measured by qRT–PCR in the islets isolated from WT and Glo1KD mice (n = 6).

- A–H
Data distribution of the absolute quantification of Trp53 (A, B), Cdkn1a (C, D), Igf1r (E, F), and Fgfr1 (G, H) gene expression measured by qPCR in pancreatic islets of WT and Glo1KD mice at 5 months (A, C, E, and G; WT n = 7, Glo1KD n = 7 in C and n = 8 in A, E and G) and 10 months of age (B, D, F, and H; WT n = 6 in D and n = 8 in B, F, and H, Glo1KD n = 6). β‐Actin was used as reference gene. Gene expression is shown as the ratio of Trp53, Cdkn1a, Igf1r, or Fgfr1 to β‐Actin copy number (AU).

- A, B
mRNA levels of Trp53 and Cdkn1a in INS‐1 832/13 cells treated with MGO 0.05 mM for 48 h or with MGO plus 24 h of dasatinib 31 nM and quercetin 6 μM (D/Q) (n = 6 biological replicates for each group). Gene expression is measured by qPCR as relative quantification to Cyclophilin A, used as reference gene.
- C
Whole cell protein lysates of INS‐1 832/13 β‐cells analyzed by Western Blot with anti‐p53 and anti‐p21 antibodies; anti‐vinculin antibody was used as loading control (n = 9 biological replicates for each treatment group).
- D
Nuclear protein lysates of INS‐1 832/13 β‐cells analyzed by Western Blot with anti‐HMGB1 antibody; anti‐histone H3 antibody was used as loading control (n = 5 biological replicates for each treatment group).
- E
Proportion of β‐Gal+ β‐cells analyzed by a fluorescence‐based assay using flow cytometry (n = 4 biological replicates for each treatment group).
- F
Cytokine levels measured in the β‐cell culture medium by a multiplex immunoassay are shown as fold increase over not‐treated control cells (n = 6 biological replicates for each treatment group).
- G
GSIS measured in the β‐cell culture medium by an ELISA assay. Insulin concentration is reported at basal condition (2.5 mM glucose) and in response to glucose stimulation (16.7 mM) (n = 4 biological replicates for each treatment group).

Quantitative RT–PCR detection of mtDNA content relative to nuclear DNA (nucDNA) in INS832/13 β‐cells exposed or not to MGO (n = 10 biological replicates for each group).
Quantitative RT–PCR detection of mtTFA expression levels in INS832/13 β‐cells exposed or not to MGO. Gene expression data are shown as relative to Cyclophilin A, used as reference gene (n = 7 biological replicates for each group).

- A–C
Data distribution of the absolute quantification of Adgre1 (A), CD68 (B), and Itgax (C) gene expression measured by qPCR in the isolated islets from WT mice at 5 (n = 7 in A and n = 6 in B, C) and 10 months (n = 7) of age.
References
-
- Bierhaus A, Fleming T, Stoyanov S, Leffler A, Babes A, Neacsu C, Sauer SK, Eberhardt M, Schnölzer M, Lasitschka F et al (2012) Methylglyoxal modification of Nav1.8 facilitates nociceptive neuron firing and causes hyperalgesia in diabetic neuropathy. Nat Med 18: 926–933 - PubMed
-
- Bierhaus A, Schiekofer S, Schwaninger M, Andrassy M, Humpert PM, Chen J, Hong M, Luther T, Henle T, Kloting I et al (2001) Diabetes‐associated sustained activation of the transcription factor nuclear factor‐kappaB. Diabetes 50: 2792–2808 - PubMed
Publication types
MeSH terms
Substances
LinkOut - more resources
Full Text Sources
Medical
Molecular Biology Databases
Research Materials
Miscellaneous
