. 2022 Sep;31(9):1431-1442.
doi: 10.1111/exd.14615. Epub 2022 Jun 6.

T-cell activation and bacterial infection in skin wounds of recessive dystrophic epidermolysis bullosa patients

Affiliations

T-cell activation and bacterial infection in skin wounds of recessive dystrophic epidermolysis bullosa patients

Vitali Alexeev et al. Exp Dermatol. 2022 Sep.

Abstract

Recessive dystrophic epidermolysis bullosa (RDEB) patients develop poorly healing skin wounds that are frequently colonized with microbiota. Because T cells play an important role in clearing such pathogens, we aimed to define the status of adaptive T cell-mediated immunity in RDEB wounds. Using a non-invasive approach for sampling of wound-associated constituents, we evaluated microbial contaminants in cellular fraction and exudates obtained from RDED wounds. Infectivity and intracellular trafficking of inactivated Staphylococcus aureus was accessed in RDEB keratinocytes. S. aureus and microbial antigen-specific activation of RDEB wound-derived T cells were investigated by fluorescence-activated cell sorting-based immune-phenotyping and T-cell functional assays. We found that RDEB wounds and epithelial cells are most frequently infected with Staphylococcus sp. and Pseudomonas sp. and that S. aureus essentially infects more RDEB keratinocytes and RDEB-derived squamous cell carcinoma cells than keratinocytes from healthy donors. The RDEB wound-associated T cells contain populations of CD4+ and CD8+ peripheral memory T cells that respond to soluble microbial antigens by proliferating and secreting interferon gamma (IFNγ). Moreover, CD8+ cytotoxic T lymphocytes recognize S. aureus-infected RDEB keratinocytes and respond by producing interleukin-2 (IL-2) and IFNγ and degranulating and cytotoxically killing infected cells. Prolonged exposure of RDEB-derived T cells to microbial antigens in vitro does not trigger PD-1-mediated T-cell exhaustion but induces differentiation of the CD4high population into CD4high CD25+ FoxP3+ regulatory T cells. Our data demonstrated that adaptive T cell-mediated immunity could clear infected cells from wound sites, but these effects might be inhibited by PD-1/Treg-mediated immuno-suppression in RDEB.

Keywords: RDEB; T-cell immunity; infection; wound healing.


Conflict of interest statement

The authors declare no conflict of interest.

Figures

FIGURE 1
FIGURE 1
Analysis of bacterial infection in RDEB wounds and keratinocytes. (A) Analysis of most common bacterial contaminants and (B) relative percentage of contamination of RDEB wound exudates (n = 57) detected by bacteria‐specific PCR. Data are presented as percent of bacteria‐positive samples assessed in triplicate independent measurements ± SD. (C) Pie charts illustrating ratio of intracellular and extracellular S. aureus in analysed samples (n = 37; top chart) and in a group of samples (n = 17) of bandage‐recovered cells in tissue culture conditions. In the bottom chart, outer circle—extracellular fraction (culture media); inner circle—cellular fraction. Positive and negative samples are shown in the key to the chart. (D) Representative micrographs depicting infectivity of a monolayer culture (90% confluence) of human primary keratinocytes (HPK), primary RDEB keratinocytes and primary keratinocytes from RDEB squamous cell carcinoma (RDEB SCC) with fluorescently‐labelled S. aureus (red). Quantitation of fluorescent signals (mean fluorescence intensity [MFI] was done on 5 independent microscopic fields and presented on a column chart as fold difference between MFI average in control and RDEB cells, as indicated. Fluorescence intensity was normalized by the level of background fluorescence. Scale bar‐100 μm. Single channel images are presented in Figure S1
FIGURE 2
FIGURE 2
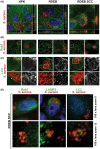
Analyses of the infectivity and the intracellular trafficking of the S. aureus in control and RDEB keratinocytes. (A) Images of confocal scanning microscopy of Vibrant DiO‐labelled (green) human primary keratinocytes (HPK; control), RDEB keratinocytes and RDEB SCC keratinocytes infected with S. aureus (red) at 5 μm Z‐position illustrating intracellular location of S. aureus in cells after overnight infection. (B, C) Micrographs illustrating co‐localization of the intracellular S. aureus (red) with Rab7+ (B) and LC3+ (C) endosomes (green) in control and RDEB keratinocytes (indicated above the micrographs) after overnight infection. Detected antigens are colour‐coded and shown to the left of the panels. Areas with typical co‐localization are shown on magnified fields. Yellow arrowheads point to representative S. aureus + endosomes (B&W images, green channel). (D) Representative magnified confocal images (5 μm Z‐position) of S. aureus (red) routed from Rab7+ endosomes to LAMP2+ phagolysosomes and LC3+ autophagosomes (green) in RDEB‐SCC keratinocytes. Magnification is shown to the right of the micrographs. Detected antigens are colour‐coded and shown above the micrographs. Blue‐DAPI nuclear staining. In all images, co‐localization is detected as overlapping red/green signals (yellow). All images are representative. Single channel images are presented in Figure S2
FIGURE 3
FIGURE 3
Analysis of T‐cell responses to pooled RDEB wound‐derived microbial antigens. (A) Density plots illustrating FACS‐based evaluation of CD4+ and CD8+ T cells (outlined populations) recovered from RDEB wounds. Percentages are shown above the plots. (B) Micrographs of control and RDEB wound‐derived T cells illustrating clonogenic proliferation of RDEB cells after 48 h of exposure to pooled microbial antigens. (C) Representative FASC profiles depicting T‐cell proliferation defined by CFSE dilution assay. Time of exposure to microbial antigens is shown above the profiles. Percentages of proliferating and non‐proliferating cells are indicated on plots. Experimental conditions are shown to the left of the plots. Positive control—T cells activated with anti‐CD3/CD28 in the presence of IL‐2. (D) Density plots showing induction of the IL‐2 and IFNγ in RDEB‐derived T cells after 5 h of exposure to microbial antigens. Conditions are shown above the plots. Detected antigens are shown on x‐ and y‐axes. Population of CD8+ IFNγ+CD107a+ T cells is outlined. (E) Graph showing ELISA‐based quantitation of IFNγ secretion from T cells exposed to microbial antigens, as indicated in the key. (F) Quantitation of IL‐2 and IFNγ induction in T cells exposed to microbial antigens, as indicated in the key. Data are presented as an average of percentages of cytokine‐positive cells from 3 independent measurements ± SD. Detected cytokines are shown below the columns
FIGURE 4
FIGURE 4
Analysis of T‐cell activity against S. aureus‐infected keratinocytes. (A) Quantitation and representative images of IFNγ spot forming cells exposed to S. aureus‐infected keratinocytes (KC) and S. aureus pooled antigens, as indicated in the key. T cells used for analysis are shown below the columns. Activation of T cells (IFNγ SFC) from early, established and chronic RDEB wounds (Effectors; indicated in the key) exposed to infected keratinocytes were evaluated separately. Data are presented as mean ± SD. (B) Box and whiskers plots showing induction of IL‐2 and IFNγ expression along with degranulation (CD107a+) in RDEB T cells incubated with RDEB keratinocytes (KC), infected RDEB KC and S. aureus, as shown in the key. Mean values and SD are shown on plots. (C) Column chart illustrating cytotoxic activity of RDEB wound‐derived T cells exposed to uninfected and S. aureus‐infected KC, as indicated in the key. Data is presented as an average cytotoxicity (%) at fixed effector: target (E:T) ratio 50:1 ± SD. Data was acquired in 5 independent experiments using HLA‐A02+ and HLA‐A03+ (as indicated) RDEB KC (n = 3) as targets and RDEB T cells (n = 5) as effectors. (D) Column chart illustrating changes in cytokines and chemokines (shown above the columns) secreted by RDEB and control T cells (indicated below the charts) 72 and 120 h of exposure to S. aureus pooled antigens (indicated in the key). Data are presented as an average fold‐difference to levels in control media (collected from control cells, indicated by dotted line) ± SD. Significance is indicated by asterisk
FIGURE 5
FIGURE 5
Analysis of RDEB‐associated putative microbial infection‐induced T‐cell impairment mechanisms. (A–D) Representative dot plot flow cytometry analysis of PD‐1, CD57 and CD69 expression (as indicated) in control and RDEB‐derived CD4 and CD8 T cells illustrating T‐cell responses to RDEB wound‐derived pooled microbial antigens (A, B), pooled S. aureus antigen (C) and S. aureus‐infected RDEB keratinocytes (D). In all plots, detected T‐cell markers are shown along y‐ and x‐axes, percentages of double‐positive T cells are shown in a top right quadrant. Days of sample collection after exposure to the indicated microbial antigens (Ag) are shown above the plots. In (C), middle plots illustrate differentiation of CD4+ population into 2 distinct CD+ (blue) and CD4high (green) populations. Far right plots show expression of PD‐1 in CD4+ and CD4high T‐cell populations. (E) Indirect immunofluorescence and Western blot (WB) analyses of PD‐L1 (green) expression in S. aureus (red)‐infected and non‐infected RDEB keratinocytes (KC; as indicated). Representative micrographs and WB illustrate no PD‐L1 induction in infected control, RDEB and RDEB SCC KC. WB shows that PD‐L1 expression did not depend on either infection or T cells presence. Accumulation of PD‐L1 on the membrane was observed after infection. Yellow arrowheads on micrographs point to the cells exemplifying this effect. (F) Representative flow cytometry plots illustrating differentiation of CD4+CD25+FoxP3+ Treg cells 6 days after exposure to pooled microbial Ag, S. aureus Ag, and S. aureus‐infected RDEB KC (as indicated to the right of the plots). Plots in the middle depict typical differentiating of the T cells into CD4+ and CD4high populations 6 days after exposure to microbial and S. aureus Ag, and a lack of such differentiation after exposure of T cells to infected KC. Plots to the right illustrate that the majority of Treg cells are present in the CD4high population. In all plots, percentages of specific populations are shown in quadrants, and detected T‐cell markers are indicated on x‐ and y‐axes. (G) Column chart summarizing all analyses and showing statistically significant differences (p < 0.05, indicated by asterisk) between different T‐cell populations (as indicated). Days of exposure and antigens are shown below the columns. Types of T cells and antigens are colour‐coded as shown in the key. Single channel images are presented in Figure S3

References

    1. Has C, Nystrom A, Saeidian AH, Bruckner‐Tuderman L, Uitto J. Epidermolysis bullosa: molecular pathology of connective tissue components in the cutaneous basement membrane zone. Matrix Biol. 2018;71‐72:313‐329. - PubMed
    1. Grice EA. The skin microbiome: potential for novel diagnostic and therapeutic approaches to cutaneous disease. Semin Cutan Med Surg. 2014;33(2):98‐103. - PMC - PubMed
    1. Mellerio J.E., Infection and colonization in epidermolysis bullosa, Dermatol Clin. 28(2) (2010) 267–9, ix. - PubMed
    1. Huitema L, Phillips T, Alexeev V, Tomic‐Canic M, Pastar I, Igoucheva O. Intracellular escape strategies of Staphylococcus aureus in persistent cutaneous infections. Exp Dermatol. 2020;30:1428‐1439. - PMC - PubMed
    1. Phillips T, Huitema L, Cepeda R, et al. Aberrant recruitment of leukocytes defines poor wound healing in patients with recessive dystrophic epidermolysis bullosa. J Dermatol Sci. 2020;100(3):209‐216. - PubMed