. 2022 May 12;13(5):453.
doi: 10.3390/insects13050453.

Temporal Expression Profiles Reveal Potential Targets during Postembryonic Development of Forensically Important Sarcophaga peregrina (Diptera: Sarcophagidae)

Affiliations

Temporal Expression Profiles Reveal Potential Targets during Postembryonic Development of Forensically Important Sarcophaga peregrina (Diptera: Sarcophagidae)

Lipin Ren et al. Insects. .

Abstract

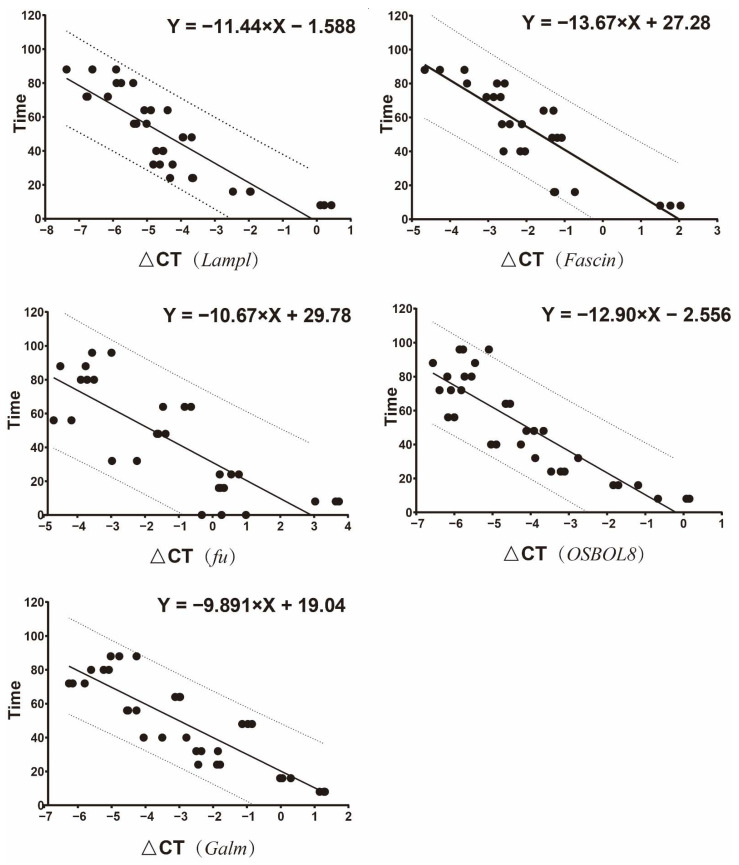
Sarcophaga peregrina (Robineau-Desvoidy, 1830) is a species of medical and forensic importance. In order to investigate the molecular mechanism during postembryonic development and identify specific genes that may serve as potential targets, transcriptome analysis was used to investigate its gene expression dynamics from the larval to pupal stages, based on our previous de novo-assembled genome of S. peregrina. Totals of 2457, 3656, 3764, and 2554 differentially expressed genes were identified. The specific genes encoding the structural constituent of cuticle were significantly differentially expressed, suggesting that degradation and synthesis of cuticle-related proteins might actively occur during metamorphosis. Molting (20-hydroxyecdysone, 20E) and juvenile (JH) hormone pathways were significantly enriched, and gene expression levels changed in a dynamic pattern during the developmental stages. In addition, the genes in the oxidative phosphorylation pathway were significantly expressed at a high level during the larval stage, and down-regulated from the wandering to pupal stages. Weighted gene co-expression correlation network analysis (WGCNA) further demonstrated the potential regulation mechanism of tyrosine metabolism in the process of puparium tanning. Moreover, 10 consistently up-regulated genes were further validated by qRT-PCR. The utility of the models was then examined in a blind study, indicating the ability to predict larval development. The developmental, stage-specific gene profiles suggest novel molecular markers for age prediction of forensically important flies.

Keywords: Sarcophaga peregrina; age estimation; gene expression; metamorphosis.


Conflict of interest statement

The authors declare no conflict of interest.

Figures

Figure 1
Figure 1
Development-associated transcriptomic profiles across the postembryonic development from the first larval instar to pupa of S. peregrina. In relation to the numbers of differentially expressed genes (DEGs), the up-regulated genes were represented by a red dot, and the down-regulated genes were represented by a blue dot. (a) B2 vs. O, (b) B3 vs. B2, (c) B4 vs. B3, (d) B5 vs. B4.
Figure 2
Figure 2
A Venn diagram showing the shared and unique genes between different groups.
Figure 3
Figure 3
Series test of cluster (STC) analysis of DEGs during postembryonic development. The DEGs clustered into 12 major groups, based on patterns of gene expression during the five developmental stages using the STEM clustering method. The black line shows the average log2 FPKM to visualize the expression trend of each cluster. The same color indicates similar gene expression patterns. The X axis shows the five developmental stages. O: hatched first instar larvae, B2: second instar larvae, B3: third instar larvae, B4: wandering larvae and B5: pupae.
Figure 4
Figure 4
Expression of the selected 10 continually up-regulated DEGs by qRT-PCR. The data are shown as mean ± SE of three replications. O: the hatched first instar larvae, B2: the second instar larvae, B3: the third instar larvae, B4: the wandering larvae and B5: pupae. The left side of the dotted line shares the left Y axis, and the right side shares the right Y axis.
Figure 5
Figure 5
The linear regression equation between the relative expression levels of five target genes (Fascin, Galm, Lamp1, OSBPL8, and fu) and developmental time of larval stage. Y axis: sampling time (h); X axis: cycle threshold (CT) values of the target genes–the internal reference genes. The solid line is the linear regression equation, which denotes the predicted versus true development time, and the dotted lines denote predictions within 10% of true.
Figure 6
Figure 6
GSEA was performed to analyze the gene sets during postembryonic development. (a) GO terms showed that the structural constituent of cuticle was significantly up-regulated in the third instar (B4 vs. B3). (b) Expression profiles of genes associated with the structural constituent of cuticle. The color bar on the right shows the FPKM values from red (high) to green (low).
Figure 7
Figure 7
Hierarchical clustering dendrogram for modules identified by WGCNA. (a) Functional modules were shown with different colors. In total, 7206 genes were divided into 18 modules, which were assigned different colors. (b) Module-trait relationships. Each row corresponds to a module. Each column corresponds to a different developmental stage. The number of each cell at the row–column intersection indicates the correlation coefficient between the module and developmental stages; “.” indicates a p value greater than 0.1, “*” indicates a p value less than 0.1, “**” indicates a p value less than 0.01, “***” indicates a p value less than 0.001. The color bar on the right shows the correlation coefficient between traits and modular characteristic genes from red (high) to blue (low). (c) Weighted co-expression network for genes in the plum1 module. Yellow circles show top 50 hub genes in this module. Pink circles represent genes encoding cuticular proteins (CPs). Lines represent the weight of connectivity between genes.
Figure 8
Figure 8
Gene expression profiles of the 20E and JH pathways. (a) Genes related to 20E synthesis. (b) Genes related to JH synthesis, degradation, and transport. The color scale on the right shows the FPKM values for each developmental stage from red (high) to green (low), standardized by min–max normalization.
Figure 9
Figure 9
Expression profiles of genes in chitin-related pathway. The color scale on the right shows the FPKM values for each developmental stage from red (high) to green (low), standardized by min–max normalization.
Figure 10
Figure 10
Expression profiles of cuticular protein genes, including the families encoding cuticle protein, larval cuticle protein, pupal cuticle protein, adult-specific cuticular protein, and endocuticle structural glycoprotein. The color scale on the right shows the FPKM values for each developmental stage from red (high) to green (low), standardized by min–max normalization.

References

    1. Tomberlin J.K., Mohr R., Benbow M.E., Tarone A.M., VanLaerhoven S. A roadmap for bridging basic and applied research in forensic entomology. Annu. Rev. Entomol. 2011;56:401–421. doi: 10.1146/annurev-ento-051710-103143. - DOI - PubMed
    1. Grassberger M., Reiter C. Effect of temperature on Lucilia sericata (Diptera: Calliphoridae) development with special reference to the isomegalen- and isomorphen-diagram. Forensic Sci. Int. 2001;120:32–36. doi: 10.1016/S0379-0738(01)00413-3. - DOI - PubMed
    1. Wang Y., Wang J.F., Zhang Y.N., Tao L.Y., Wang M. Forensically important Sarcophaga peregrina (Diptera: Sarcophagidae) in China: Development pattern and significance for estimating postmortem interval. J. Med. Entomol. 2017;54:1491–1497. doi: 10.1093/jme/tjx139. - DOI - PubMed
    1. Baqué M., Filmann N., Verhoff M.A., Amendt J. Establishment of developmental charts for the larvae of the blow fly Calliphora vicina using quantile regression. Forensic Sci. Int. 2015;248:1–9. doi: 10.1016/j.forsciint.2014.12.020. - DOI - PubMed
    1. Charabidze D., Hedouin V. Temperature: The weak point of forensic entomology. Int J. Leg. Med. 2019;133:633–639. doi: 10.1007/s00414-018-1898-1. - DOI - PubMed

LinkOut - more resources