The Perivascular Fat Attenuation Index Improves the Diagnostic Performance for Functional Coronary Stenosis
- PMID: 35621839
- PMCID: PMC9145749
- DOI: 10.3390/jcdd9050128
The Perivascular Fat Attenuation Index Improves the Diagnostic Performance for Functional Coronary Stenosis
Abstract
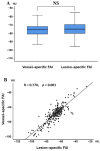
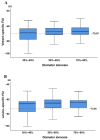
Background: Coronary computed tomography angiography (CCTA) is an established first-line test in the investigation of patients with suspected coronary artery disease (CAD), while the perivascular fat attenuation index (FAI) derived from CT seems to be a feasible and efficient tool for the identification of ischemia. The association between the FAI and lesion-specific ischemia as assessed by fractional flow reserve (FFR) remains unclear. Methods: In a total of 261 patients, 294 vessels were assessed for CCTA stenosis, vessel-specific FAI, lesion-specific FAI, and plaque characteristics. The diagnostic accuracies of each parameter and the combined approach were analyzed via the receiver operating characteristic curve (ROC) with FFR as the reference standard. The determinants of FAI were statistically analyzed. Results: The cutoff values of vessel-specific FAI and lesion-specific FAI scores calculated according to the Youden index were −70.97 and −73.95 HU, respectively. No significant differences were noted between them; however, they exhibited a strong correlation. No significant differences were noted between the area under the curve (AUC) scores of vessel-specific FAI (0.677), lesion-specific FAI (0.665), and CCTA (0.607) (p > 0.05 for all) results. The addition of two FAI measures to the CCTA showed improvements in the discrimination (AUC) and reclassification ability (relative integrated discrimination improvement (IDI) and category-free net reclassification index (NRI)), vessel-specific FAI (AUC, 0.696; NRI, 49.6%; IDI, 5.9%), and lesion-specific FAI scores (AUC, 0.676; NRI, 43.3%; IDI, 5.4%); (p < 0.01 for all). Multivariate analysis revealed that low-attenuation plaque (LAP) volume was an independent predictor of two FAI measures. Conclusion: The combined approach of adding vessel-specific FAI or lesion-specific FAI scores could improve the identification of ischemia compared with CCTA alone. The LAP volume was the independent risk factor for both tools.
Keywords: coronary artery disease; coronary computed tomography angiography; fat attenuation index; ischemia.
Conflict of interest statement
All authors have no conflict of interest.
Figures


Similar articles
-
Pericoronary fat attenuation index and coronary plaque quantified from coronary computed tomography angiography identify ischemia-causing lesions.Int J Cardiol. 2022 Jun 15;357:8-13. doi: 10.1016/j.ijcard.2022.03.033. Epub 2022 Mar 16. Int J Cardiol. 2022. PMID: 35306030
-
Peri-coronary inflammation is associated with findings on coronary computed tomography angiography and fractional flow reserve.J Cardiovasc Comput Tomogr. 2020 Nov-Dec;14(6):483-489. doi: 10.1016/j.jcct.2020.02.002. Epub 2020 Feb 6. J Cardiovasc Comput Tomogr. 2020. PMID: 32057707
-
Diffuse coronary artery disease among other atherosclerotic plaque characteristics by coronary computed tomography angiography for predicting coronary vessel-specific ischemia by fractional flow reserve.Atherosclerosis. 2017 Mar;258:145-151. doi: 10.1016/j.atherosclerosis.2017.01.018. Epub 2017 Jan 16. Atherosclerosis. 2017. PMID: 28168977 Free PMC article.
-
Computed tomography angiography-derived fractional flow reserve (CT-FFR) for the detection of myocardial ischemia with invasive fractional flow reserve as reference: systematic review and meta-analysis.Eur Radiol. 2020 Feb;30(2):712-725. doi: 10.1007/s00330-019-06470-8. Epub 2019 Nov 6. Eur Radiol. 2020. PMID: 31696294
-
Perivascular fat attenuation index (FAI) on computed tomography coronary angiography reclassifies individual cardiovascular risk estimation.Int J Cardiol Cardiovasc Risk Prev. 2024 Dec 18;24:200360. doi: 10.1016/j.ijcrp.2024.200360. eCollection 2025 Mar. Int J Cardiol Cardiovasc Risk Prev. 2024. PMID: 39811144 Free PMC article. Review.
Cited by
-
A cloud-based medical device for predicting cardiac risk in suspected coronary artery disease: a rapid review and conceptual economic model.Health Technol Assess. 2024 Jul;28(31):1-105. doi: 10.3310/WYGC4096. Health Technol Assess. 2024. PMID: 39023142 Free PMC article. Review.
-
Coronary Computed Tomography Angiography-Derived Modified Duke Index Is Associated with Peri-Coronary Fat Attenuation Index and Predicts Severity of Coronary Inflammation.Medicina (Kaunas). 2024 May 6;60(5):765. doi: 10.3390/medicina60050765. Medicina (Kaunas). 2024. PMID: 38792949 Free PMC article.
-
Correlation Between Fat Attenuation Index and Plaque Parameters in Coronary CT Angiography: An Observational Study in Stable Coronary Artery Disease.Clin Appl Thromb Hemost. 2025 Jan-Dec;31:10760296241313459. doi: 10.1177/10760296241313459. Epub 2025 May 5. Clin Appl Thromb Hemost. 2025. PMID: 40325857 Free PMC article.
-
Assessment of myocardial bridging and the pericoronary fat attenuation index on coronary computed tomography angiography: predicting coronary artery disease risk.BMC Cardiovasc Disord. 2023 Mar 22;23(1):145. doi: 10.1186/s12872-023-03146-6. BMC Cardiovasc Disord. 2023. PMID: 36949394 Free PMC article.
-
Association between coronary plaque vulnerability features and multiparametric pericoronary fat indices on coronary computed tomography angiography: a cross-sectional study.Quant Imaging Med Surg. 2025 Aug 1;15(8):6897-6909. doi: 10.21037/qims-24-1002. Epub 2025 Jul 28. Quant Imaging Med Surg. 2025. PMID: 40785932 Free PMC article.
References
-
- WHO . Disease Burden and Mortality Estimates. WHO; Geneva, Switzerland: 2018.
-
- Meijboom W.B., Meijs M.F., Schuijf J., Cramer M.J., Mollet N.R., van Mieghem C.A., Nieman K., van Werkhoven J.M., Pundziute G., Weustink A.C., et al. Diagnostic Accuracy of 64-Slice Computed Tomography Coronary Angiography: A Prospective, Multicenter, Multivendor Study. J. Am. Coll. Cardiol. 2008;52:2135–2144. doi: 10.1016/j.jacc.2008.08.058. - DOI - PubMed
-
- Budoff M.J., Dowe D., Jollis J.G., Gitter M., Sutherland J., Halamert E., Scherer M., Bellinger R., Martin A., Benton R., et al. Diagnostic performance of 64-multidetector row coronary computed tomographic angiography for evaluation of coronary artery stenosis in individuals without known coronary artery disease: Results from the prospective multicenter ACCURACY (Assessment by Coronary Computed Tomographic Angiography of Individuals Un-dergoing Invasive Coronary Angiography) trial. J. Am. Coll. Cardiol. 2008;52:1724–1732. - PubMed
-
- Meijboom W.B., Van Mieghem C.A.G., van Pelt N., Weustink A., Pugliese F., Mollet N.R., Boersma E., Regar E., van Geuns R.J., de Jaegere P.J., et al. Comprehensive assessment of coronary artery stenoses: Computed tomography coronary angiography versus conventional coronary angiography and correlation with fractional flow reserve in patients with stable angina. J. Am. Coll. Cardiol. 2008;52:636–643. doi: 10.1016/j.jacc.2008.05.024. - DOI - PubMed
Grants and funding
LinkOut - more resources
Full Text Sources
Research Materials
Miscellaneous

