

Acute Toxicity of Major Geochemical Ions to Fathead Minnows (Pimephales Promelas): Part A-Observed Relationships for Individual Salts and Salt Mixtures
- PMID: 35622012
- PMCID: PMC9533472
- DOI: 10.1002/etc.5390
Acute Toxicity of Major Geochemical Ions to Fathead Minnows (Pimephales Promelas): Part A-Observed Relationships for Individual Salts and Salt Mixtures
Abstract
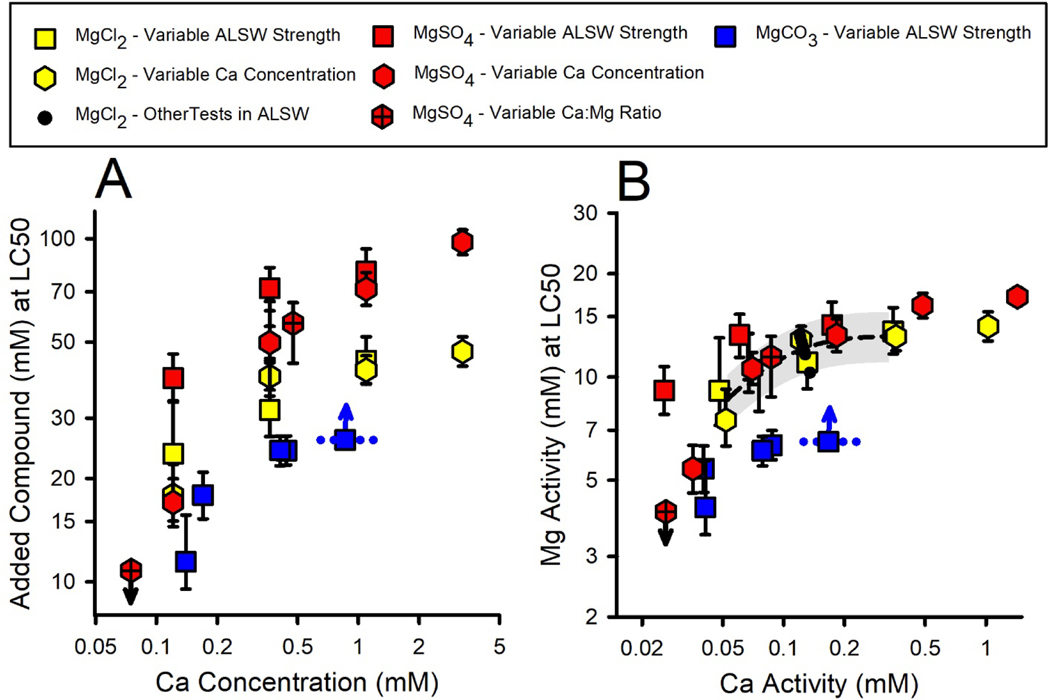
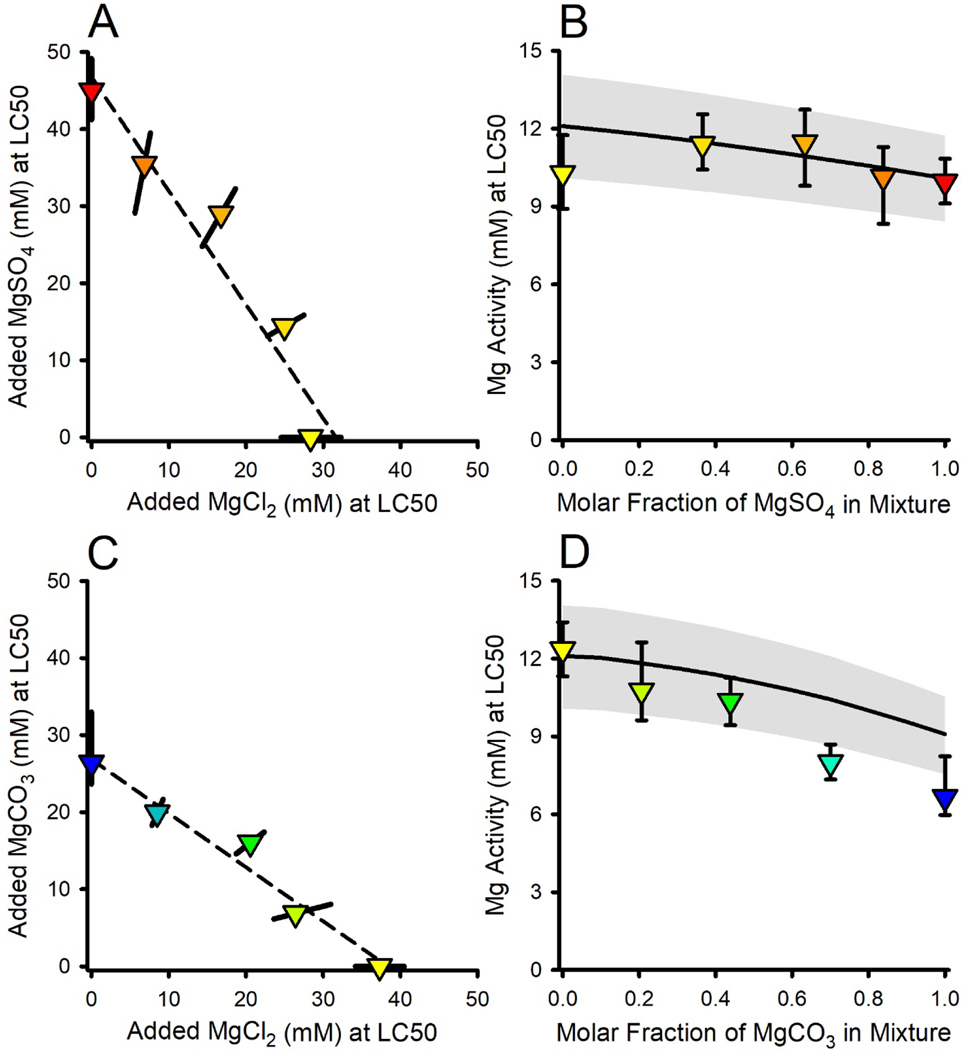
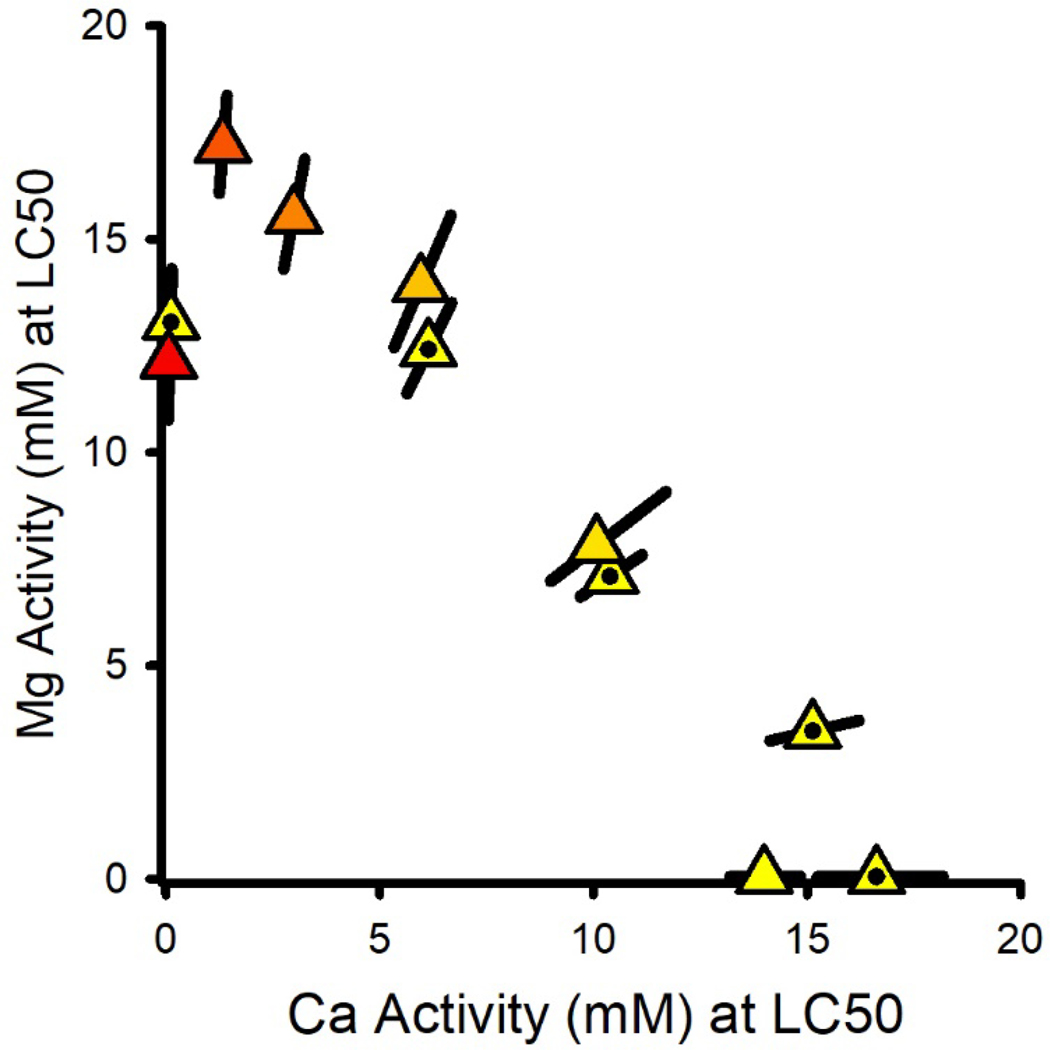
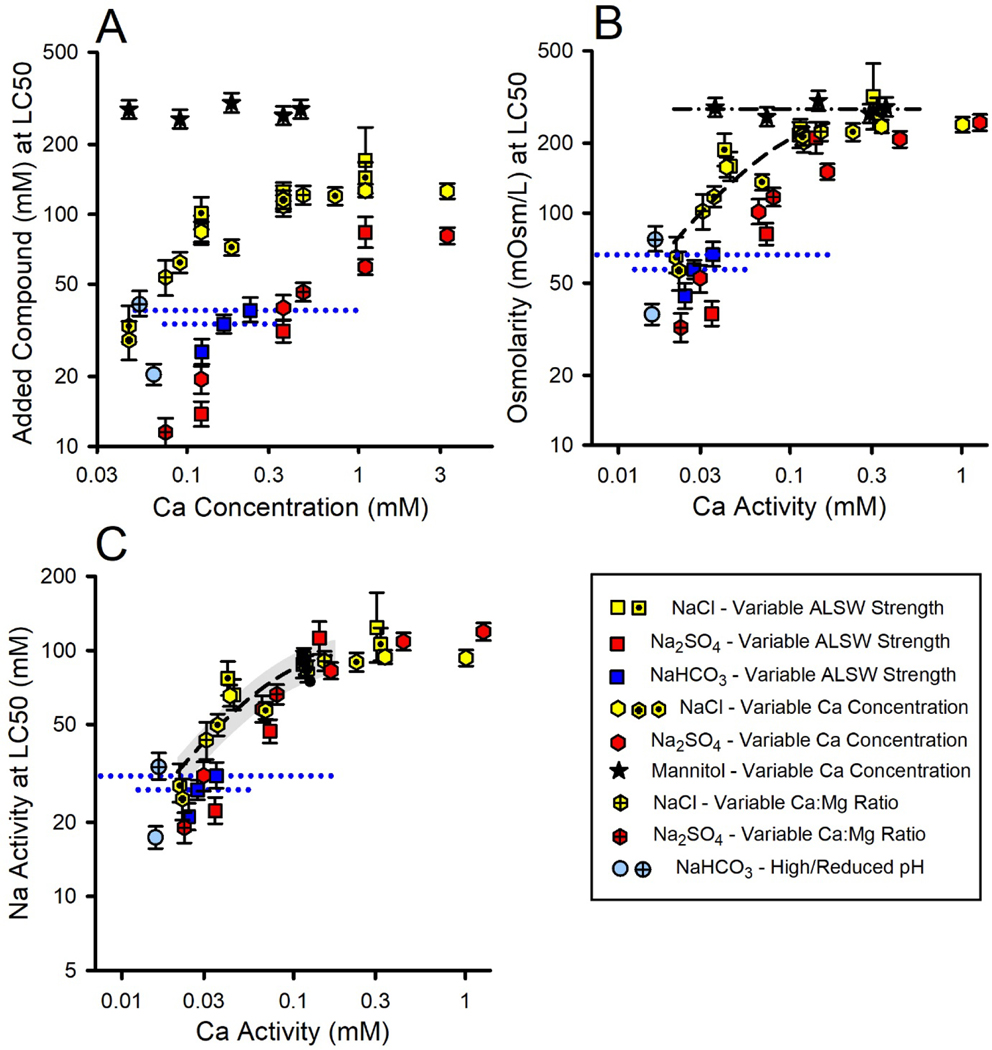
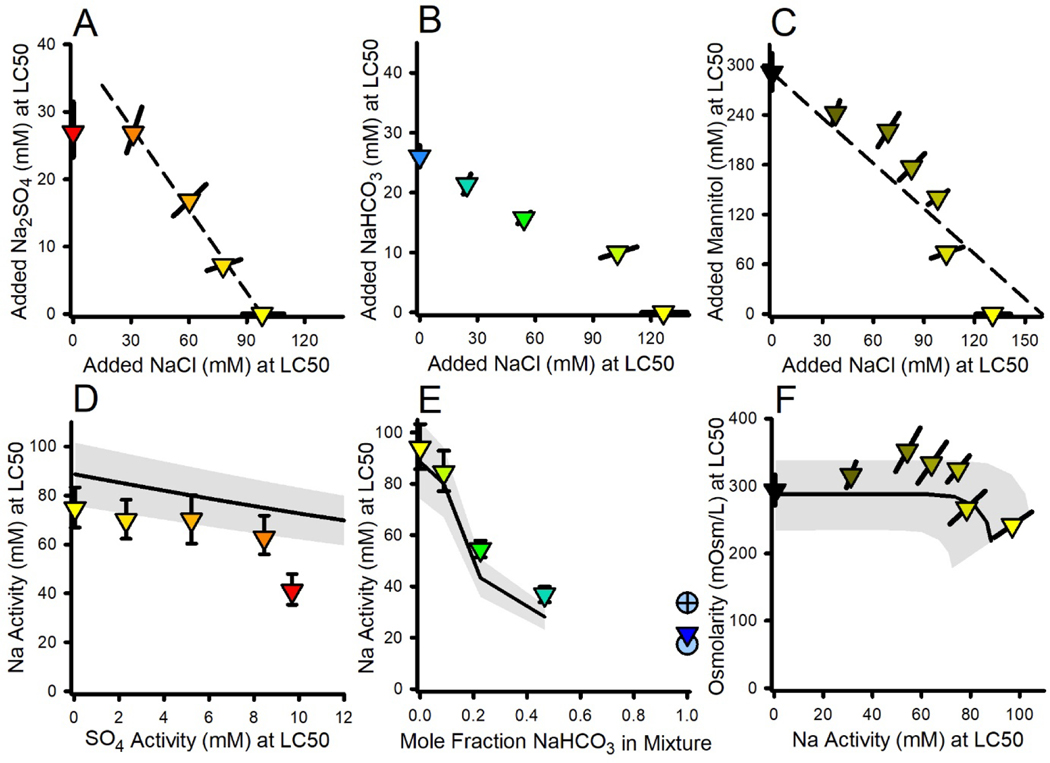
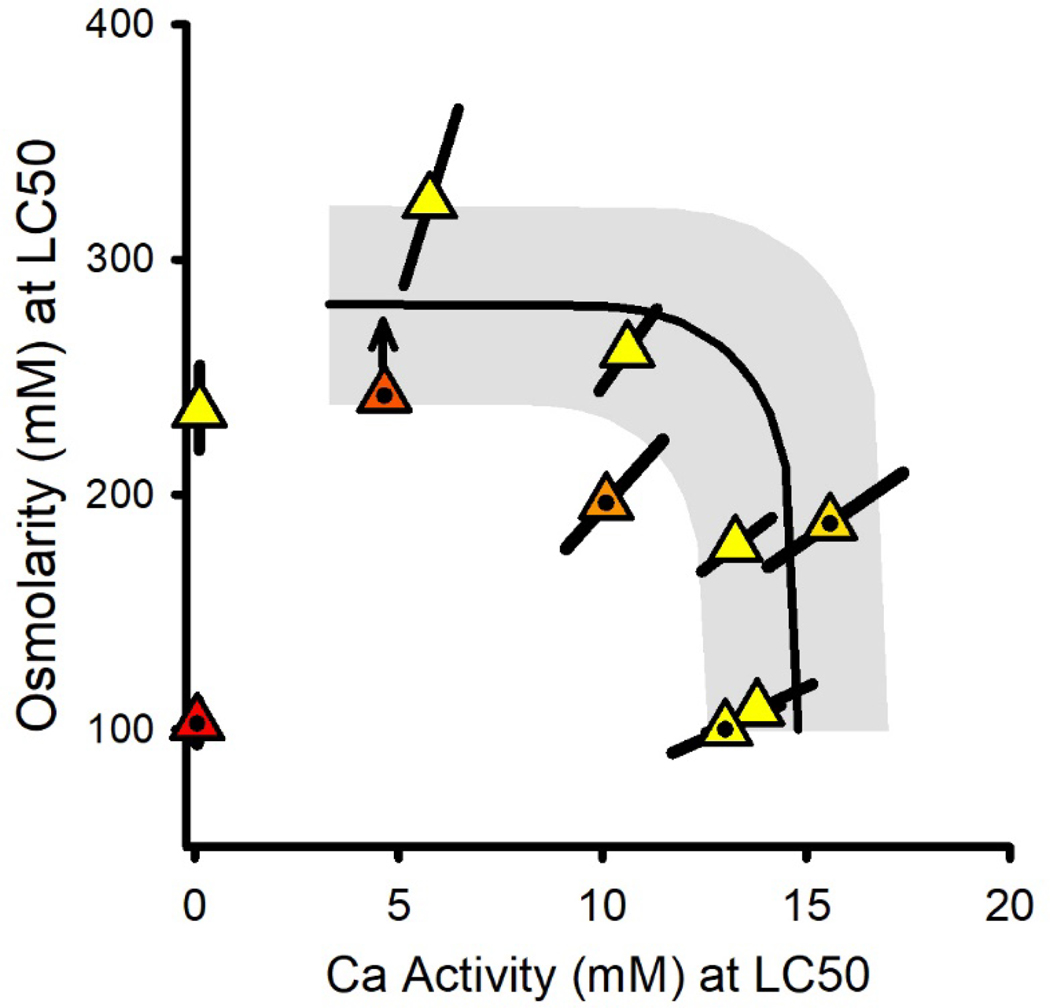
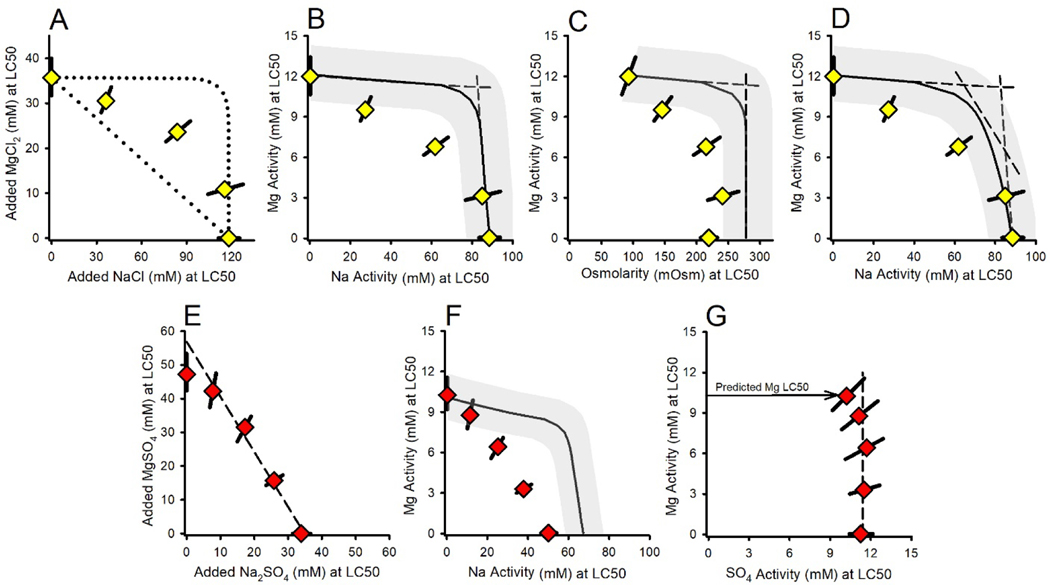
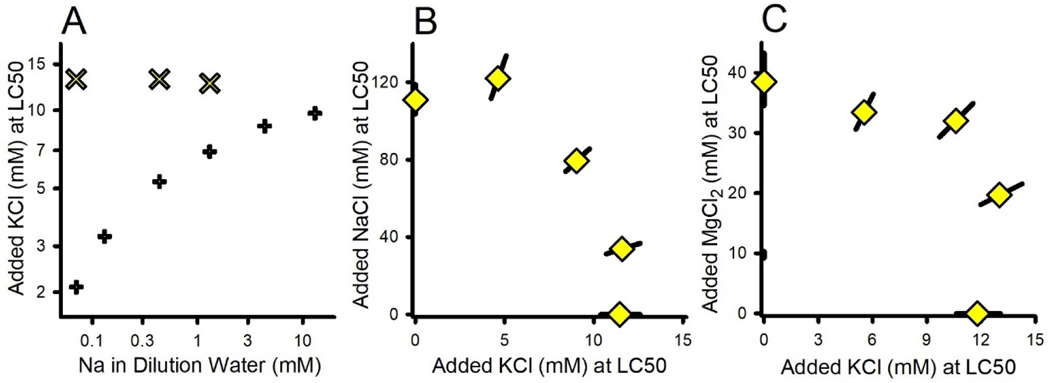
The results of a series of experiments on the acute toxicity of major geochemical ions (Na+ , K+ , Ca2+ , Mg2+ , Cl- , SO4 2- , HCO3 - /CO3 2- ) to fathead minnows (Pimephales promelas) are reported. Tests of individual major ion salts in various dilution waters demonstrated that the toxicities of Na, Mg, and K salts decrease as the overall ion content of the dilution water increases. For Na and Mg salts, this is attributable to Ca content as previously reported for Ceriodaphnia dubia. For K salts, the cause is unclear, but it is not due to Na as reported for C. dubia. In an unregulated test at high pH (9.3), NaHCO3 was also found to be twice as toxic compared to when the pH was reduced to 8.4. Experiments with binary salt mixtures indicated the existence of multiple independent mechanisms of action. These include K-specific toxicity and Ca/Mg-specific toxicity previously reported for C. dubia, but also apparent toxicities related to SO4 and to high pH/alkalinity in CO3 /HCO3 -dominated exposures. Previous work with C. dubia also suggested a general ion toxicity involving all ions that was correlated with osmolarity. For fathead minnow, similar correlations were observed, but multiple mechanisms were indicated. At higher Ca, this general toxicity could be attributable to osmotic effects, but at lower Ca, osmolarity may be more a covariate than a cause, with this toxicity being related to a combined effect of ions other than via osmolarity. Environ Toxicol Chem 2022;41:2078-2094. © 2022 SETAC. This article has been contributed to by U.S. Government employees and their work is in the public domain in the USA.
Keywords: Aquatic toxicology; Fathead minnow; Major geochemical ions; Mixture toxicity; Pimephales promelas; Toxicity mechanisms.
© 2022 SETAC. This article has been contributed to by U.S. Government employees and their work is in the public domain in the USA.
Figures
Similar articles
-
Acute Toxicity of Major Geochemical Ions to Fathead Minnows (Pimephales promelas): Part B-Modeling Ion Toxicity.Environ Toxicol Chem. 2022 Sep;41(9):2095-2106. doi: 10.1002/etc.5389. Epub 2022 Aug 3. Environ Toxicol Chem. 2022. PMID: 35665535 Free PMC article.
-
The acute toxicity of major ion salts to Ceriodaphnia dubia. II. Empirical relationships in binary salt mixtures.Environ Toxicol Chem. 2017 Jun;36(6):1525-1537. doi: 10.1002/etc.3669. Epub 2016 Dec 16. Environ Toxicol Chem. 2017. PMID: 27800634 Free PMC article.
-
Chronic toxicity of major ion salts and their mixtures to Ceriodaphnia dubia.Environ Toxicol Chem. 2019 Apr;38(4):769-783. doi: 10.1002/etc.4346. Epub 2019 Feb 20. Environ Toxicol Chem. 2019. PMID: 30569525 Free PMC article.
-
The acute toxicity of major ion salts to Ceriodaphnia dubia: I. influence of background water chemistry.Environ Toxicol Chem. 2016 Dec;35(12):3039-3057. doi: 10.1002/etc.3487. Epub 2016 Aug 2. Environ Toxicol Chem. 2016. PMID: 27167636 Free PMC article.
-
The acute toxicity of major ion salts to Ceriodaphnia dubia. III. Mathematical models for mixture toxicity.Environ Toxicol Chem. 2018 Jan;37(1):247-259. doi: 10.1002/etc.3953. Epub 2017 Nov 30. Environ Toxicol Chem. 2018. PMID: 28833416 Free PMC article.
Cited by
-
Acute Toxicity of Major Geochemical Ions to Fathead Minnows (Pimephales promelas): Part B-Modeling Ion Toxicity.Environ Toxicol Chem. 2022 Sep;41(9):2095-2106. doi: 10.1002/etc.5389. Epub 2022 Aug 3. Environ Toxicol Chem. 2022. PMID: 35665535 Free PMC article.
-
Using Single-Species and Whole Community Stream Mesocosm Exposures for Identifying Major Ion Effects in Doses Mimicking Resource Extraction Wastewaters.Water (Basel). 2023 Jan 6;15(2):1-26. doi: 10.3390/w15020249. Water (Basel). 2023. PMID: 38269364 Free PMC article.
-
The Acute Toxicity of Salinity in Onshore Unconventional Gas Waters to Freshwater Invertebrates in Receiving Environments: A Systematic Review.Environ Toxicol Chem. 2022 Dec;41(12):2928-2949. doi: 10.1002/etc.5492. Epub 2022 Nov 10. Environ Toxicol Chem. 2022. PMID: 36193756 Free PMC article.
References
-
- Adelman IR, Smith LL Jr., Siesennop GD. 1976. Acute toxicity of sodium chloride, pentachlorophenol, guthion, and hexavalent chromium to fathead minnows (Pimephales promelas) and goldfish (Carassius auratus). J Fish Res Board Can 33:203–208. 10.1139/f76-030 - DOI
-
- ASTM. 2002. Standard Guide for Conducting Acute Toxicity Tests on Test Materials with Fishes, Macroinvertebrates, and Amphibians, Standard E729–96 (Reapproved 2002). ASTM International, West Conshohocken, PA. 22 pp.
-
- Birge WJ, Black JA, Westerman AG, Short TM, Taylor SB, Bruser DM, Wallingford ED. 1985. Recommendations on numerical values for regulating iron and chloride concentrations for the purpose of protecting warmwater species of aquatic life in the Commonwealth of Kentucky. Report, School of Biological Sciences and Graduate Center for Toxicology, University of Kentucky, Lexington, KY, for Memorandum of Agreement 5429 with Kentucky Natural Resources and Environmental Protection Cabinet.
-
- Cañedo-Argüelles M. 2020. A review of recent advances and future challenges in freshwater salinization. Limnetica 39(1):185–211. 10.23818/limn.39.13 - DOI
MeSH terms
Substances
Grants and funding
LinkOut - more resources
Full Text Sources
Miscellaneous
