. 2022 Jul 1;323(1):H146-H164.
doi: 10.1152/ajpheart.00105.2022. Epub 2022 May 27.

Metabolic signatures of pregnancy-induced cardiac growth

Affiliations

Metabolic signatures of pregnancy-induced cardiac growth

Kyle L Fulghum et al. Am J Physiol Heart Circ Physiol. .

Abstract

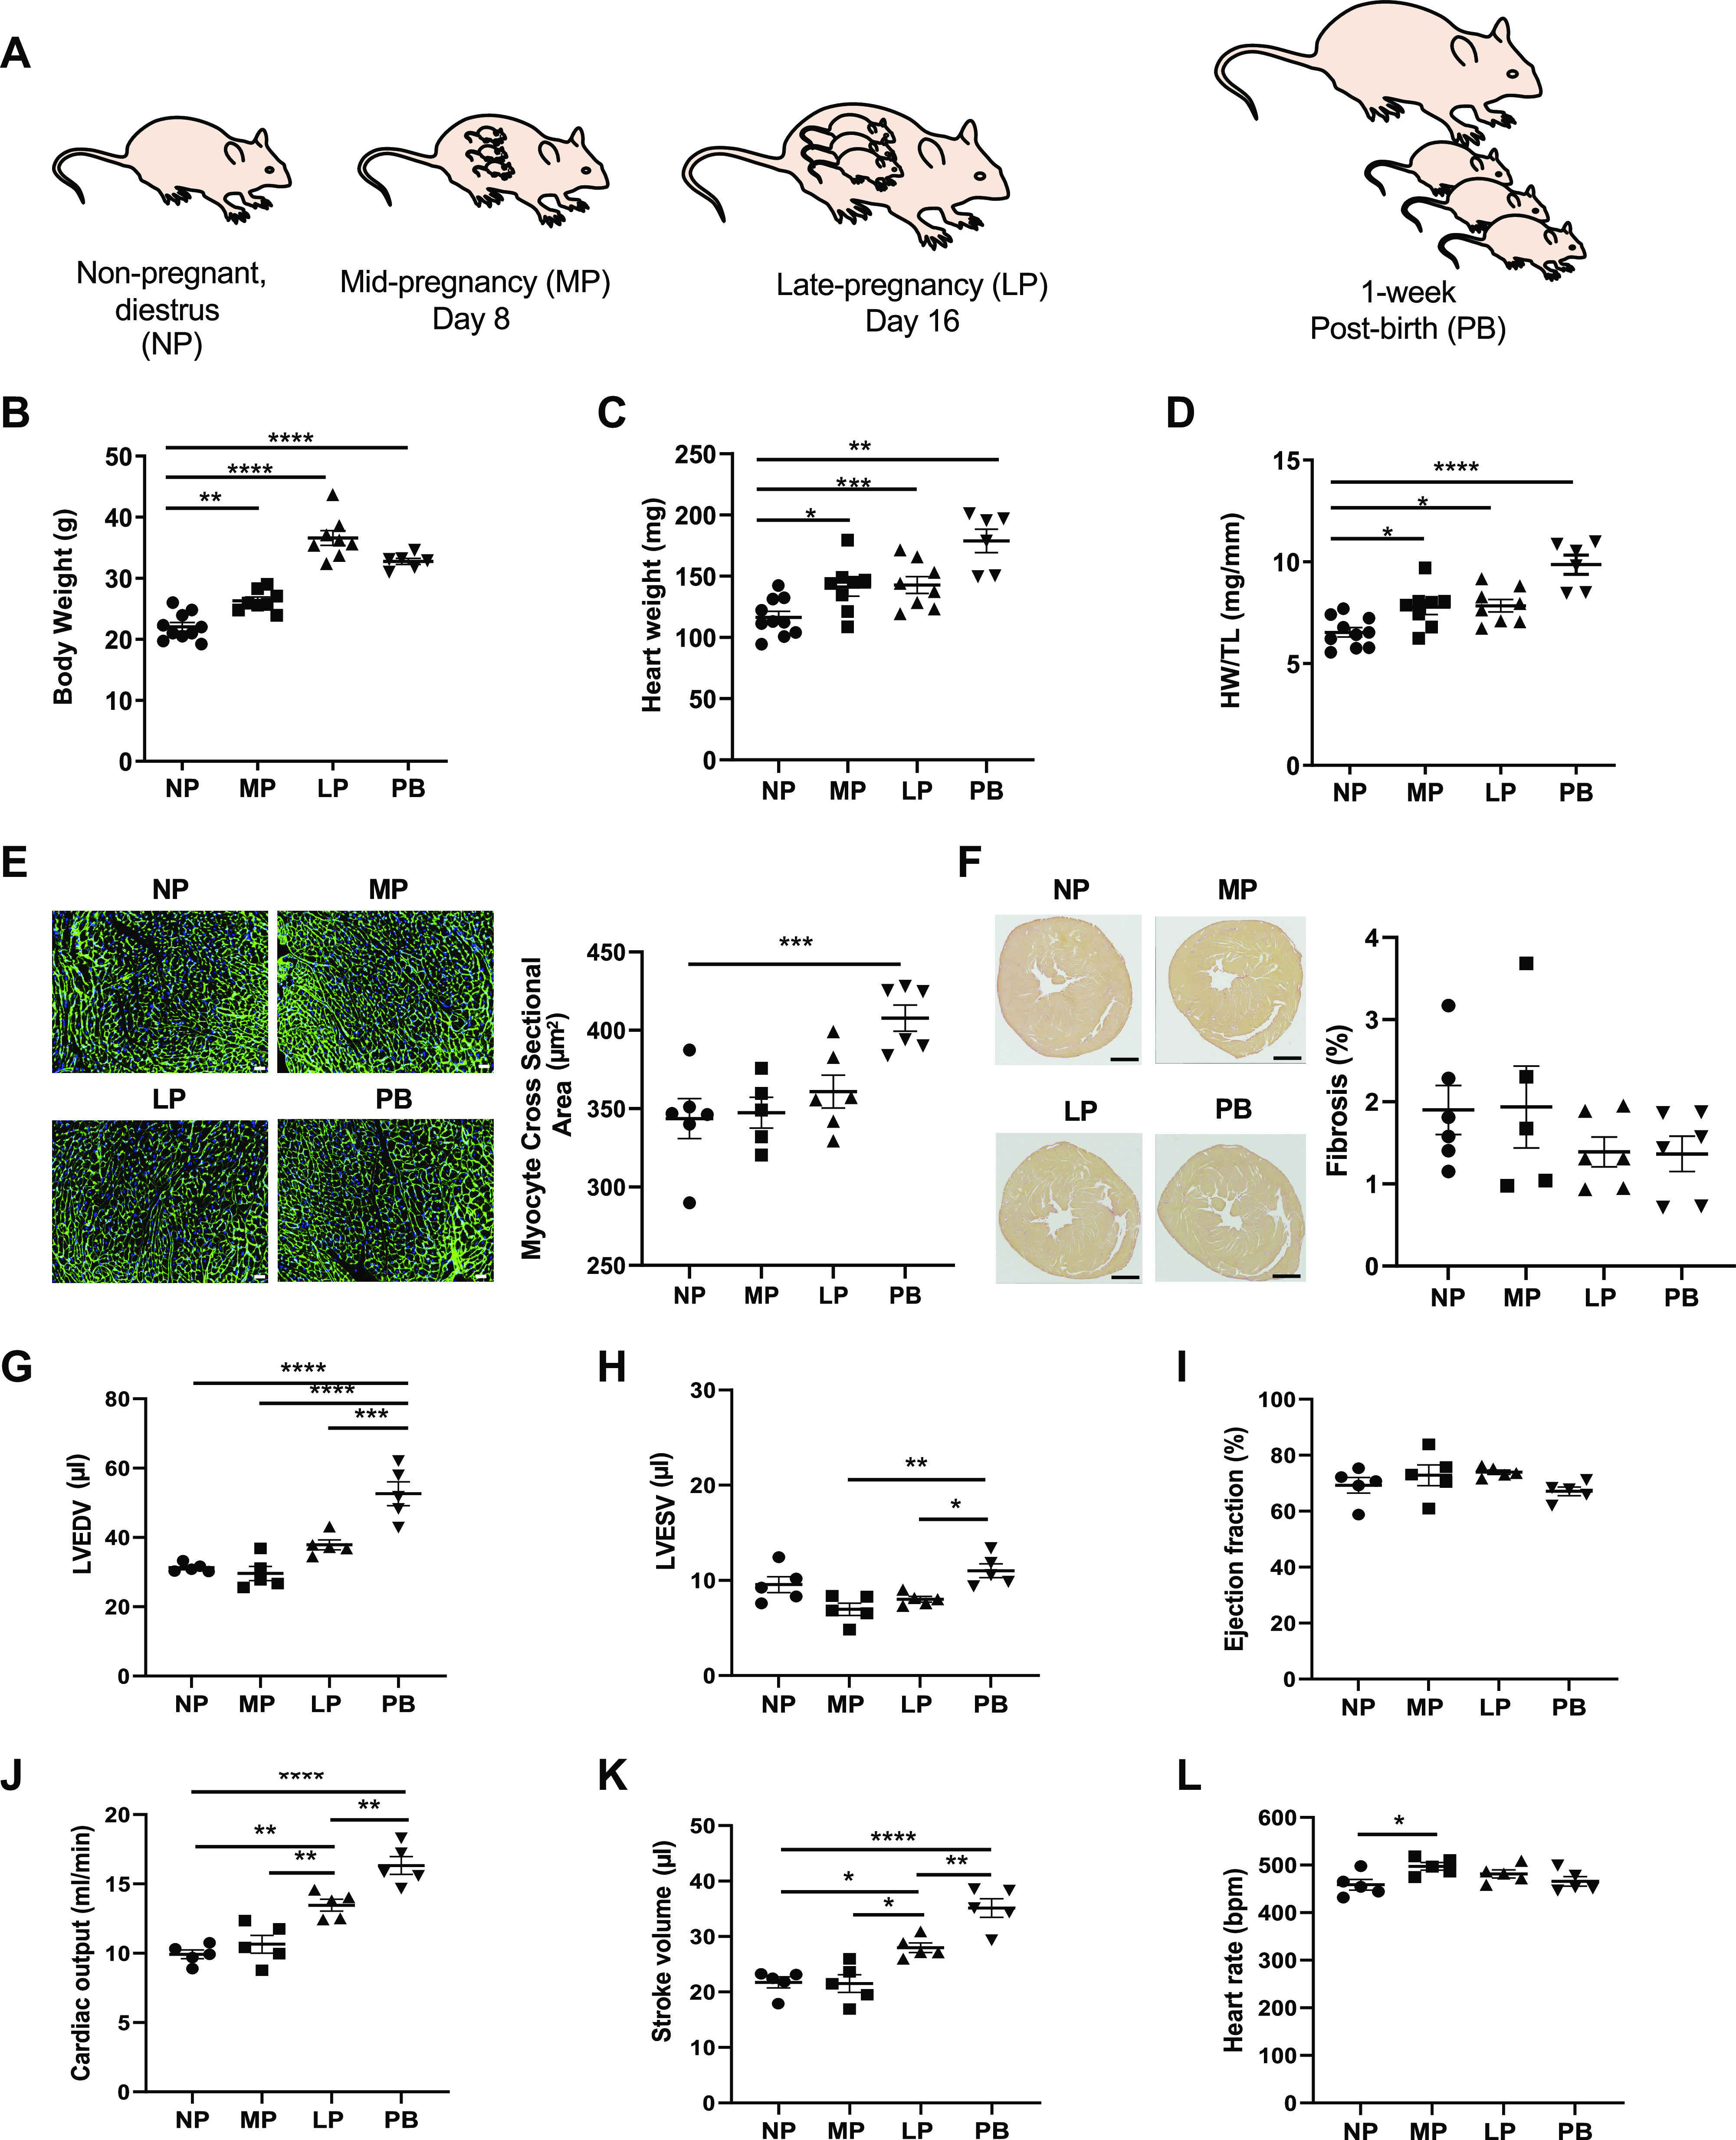
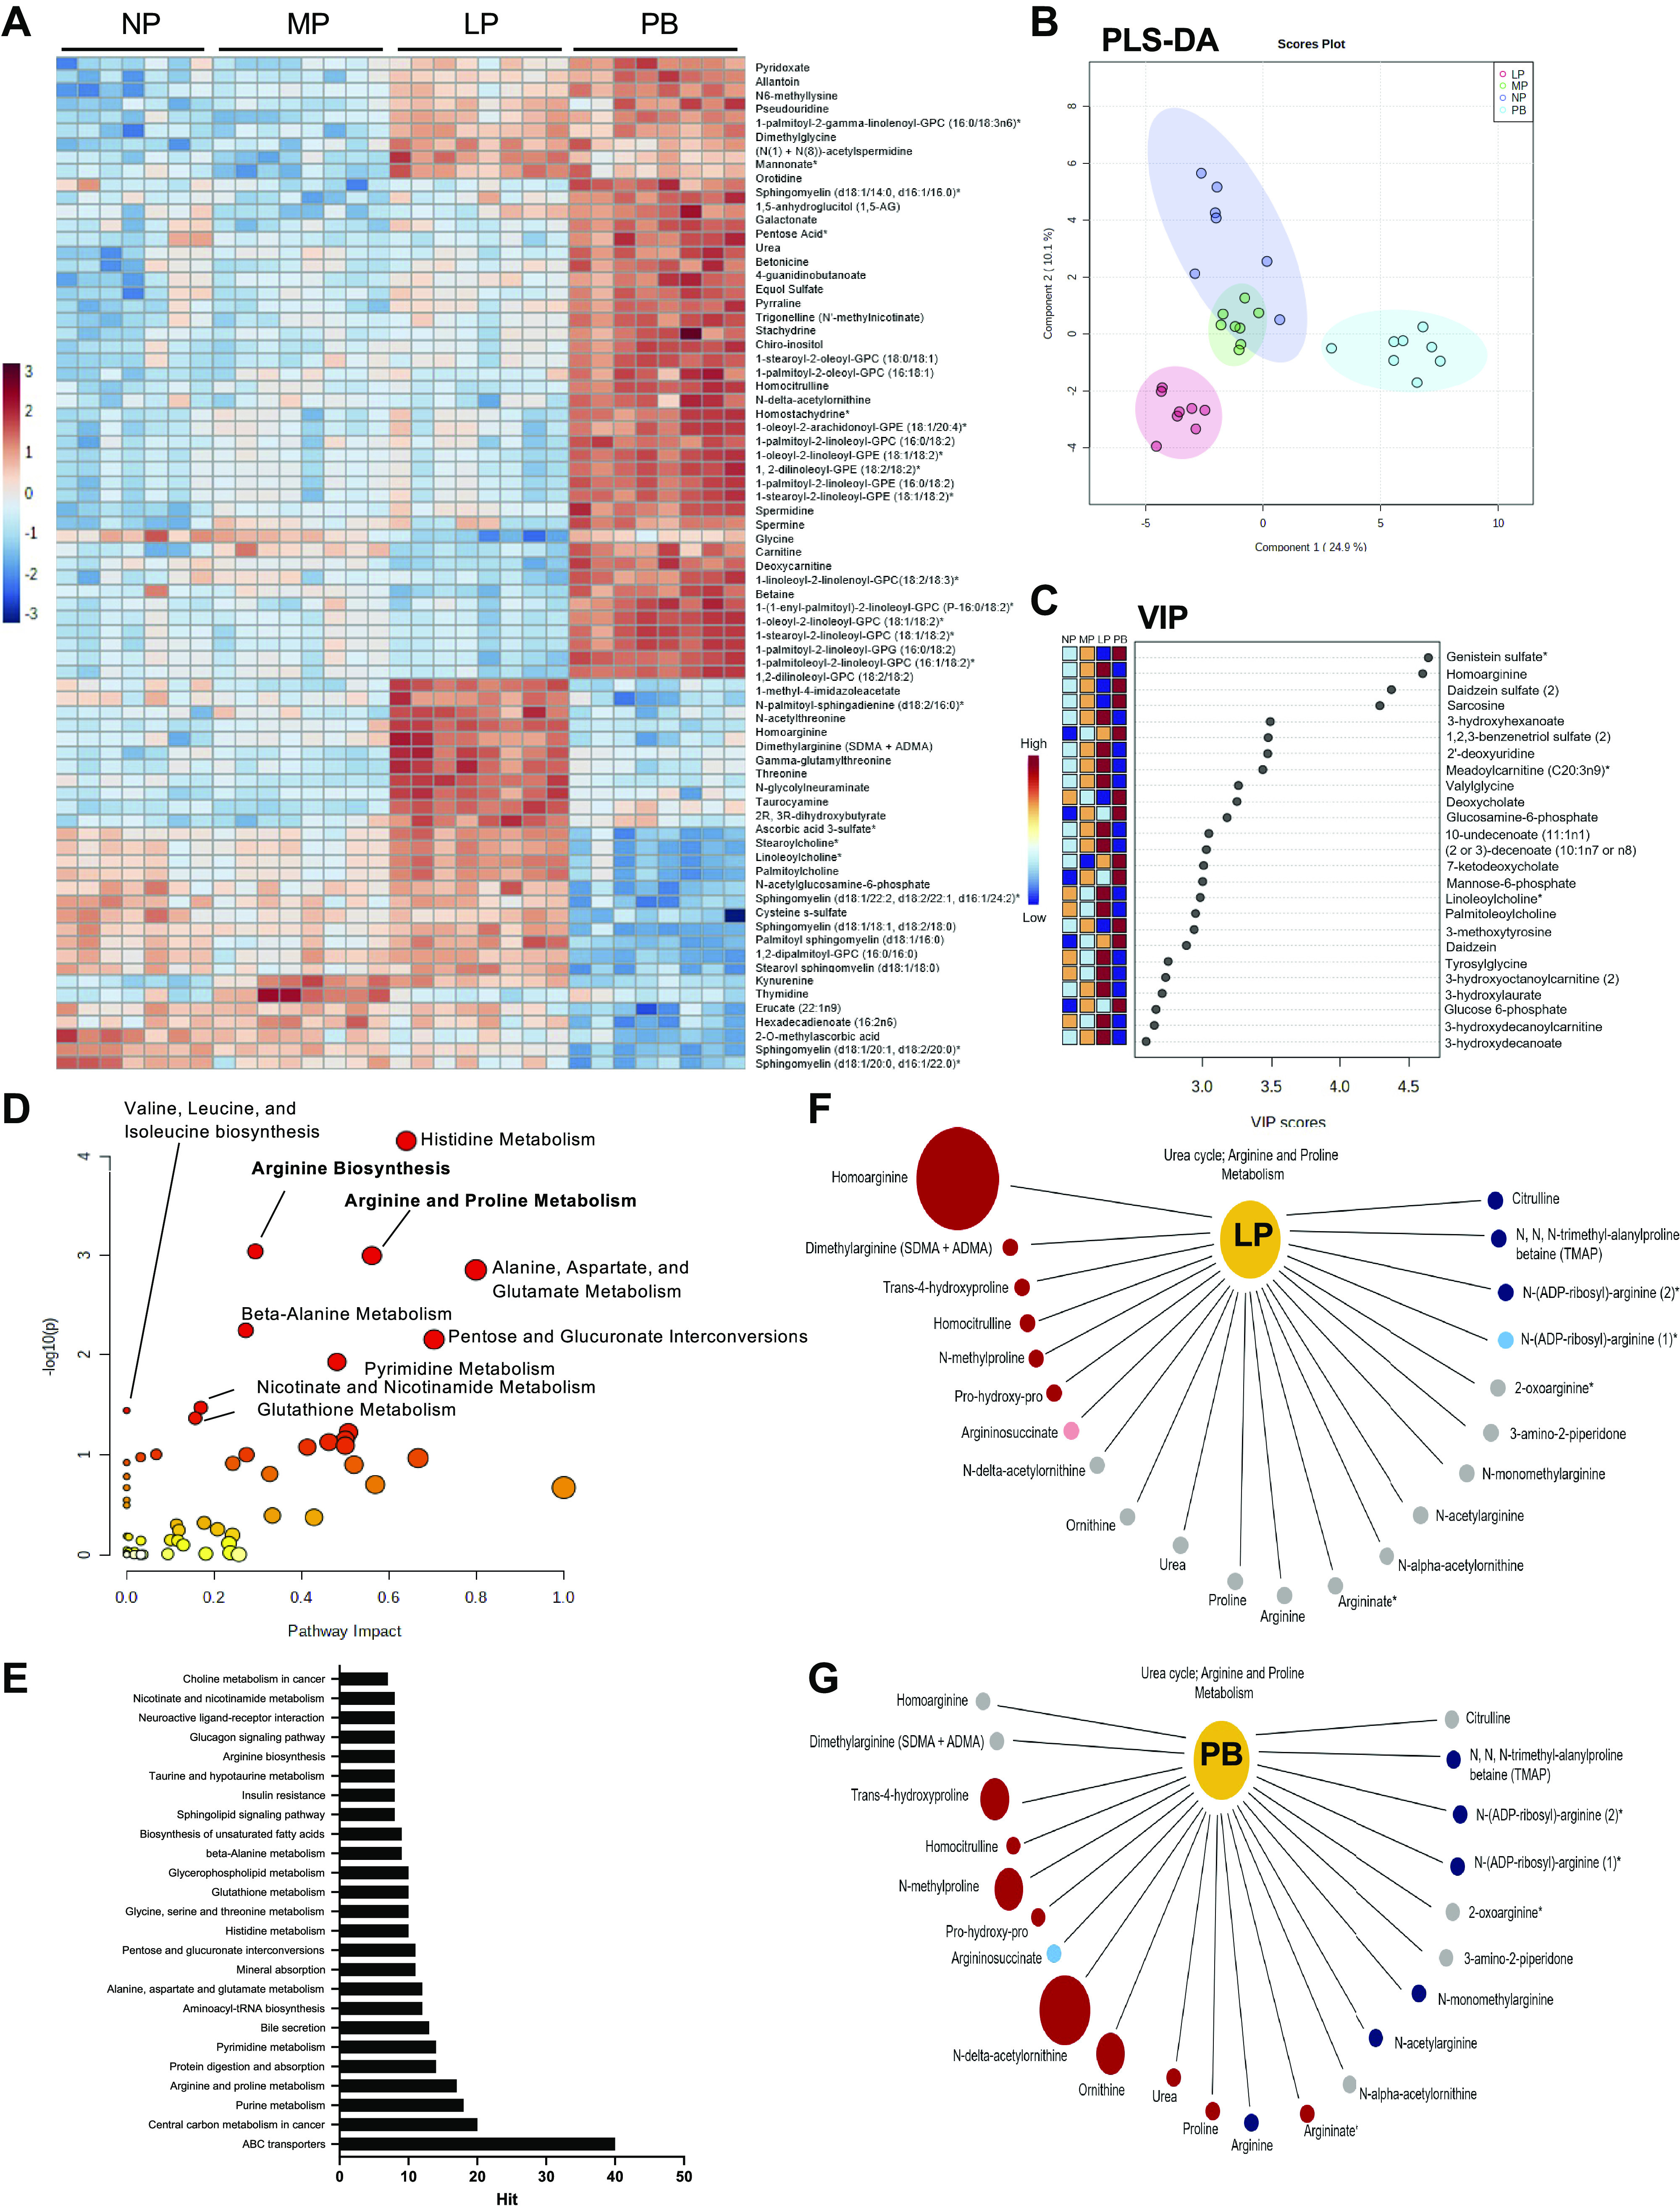
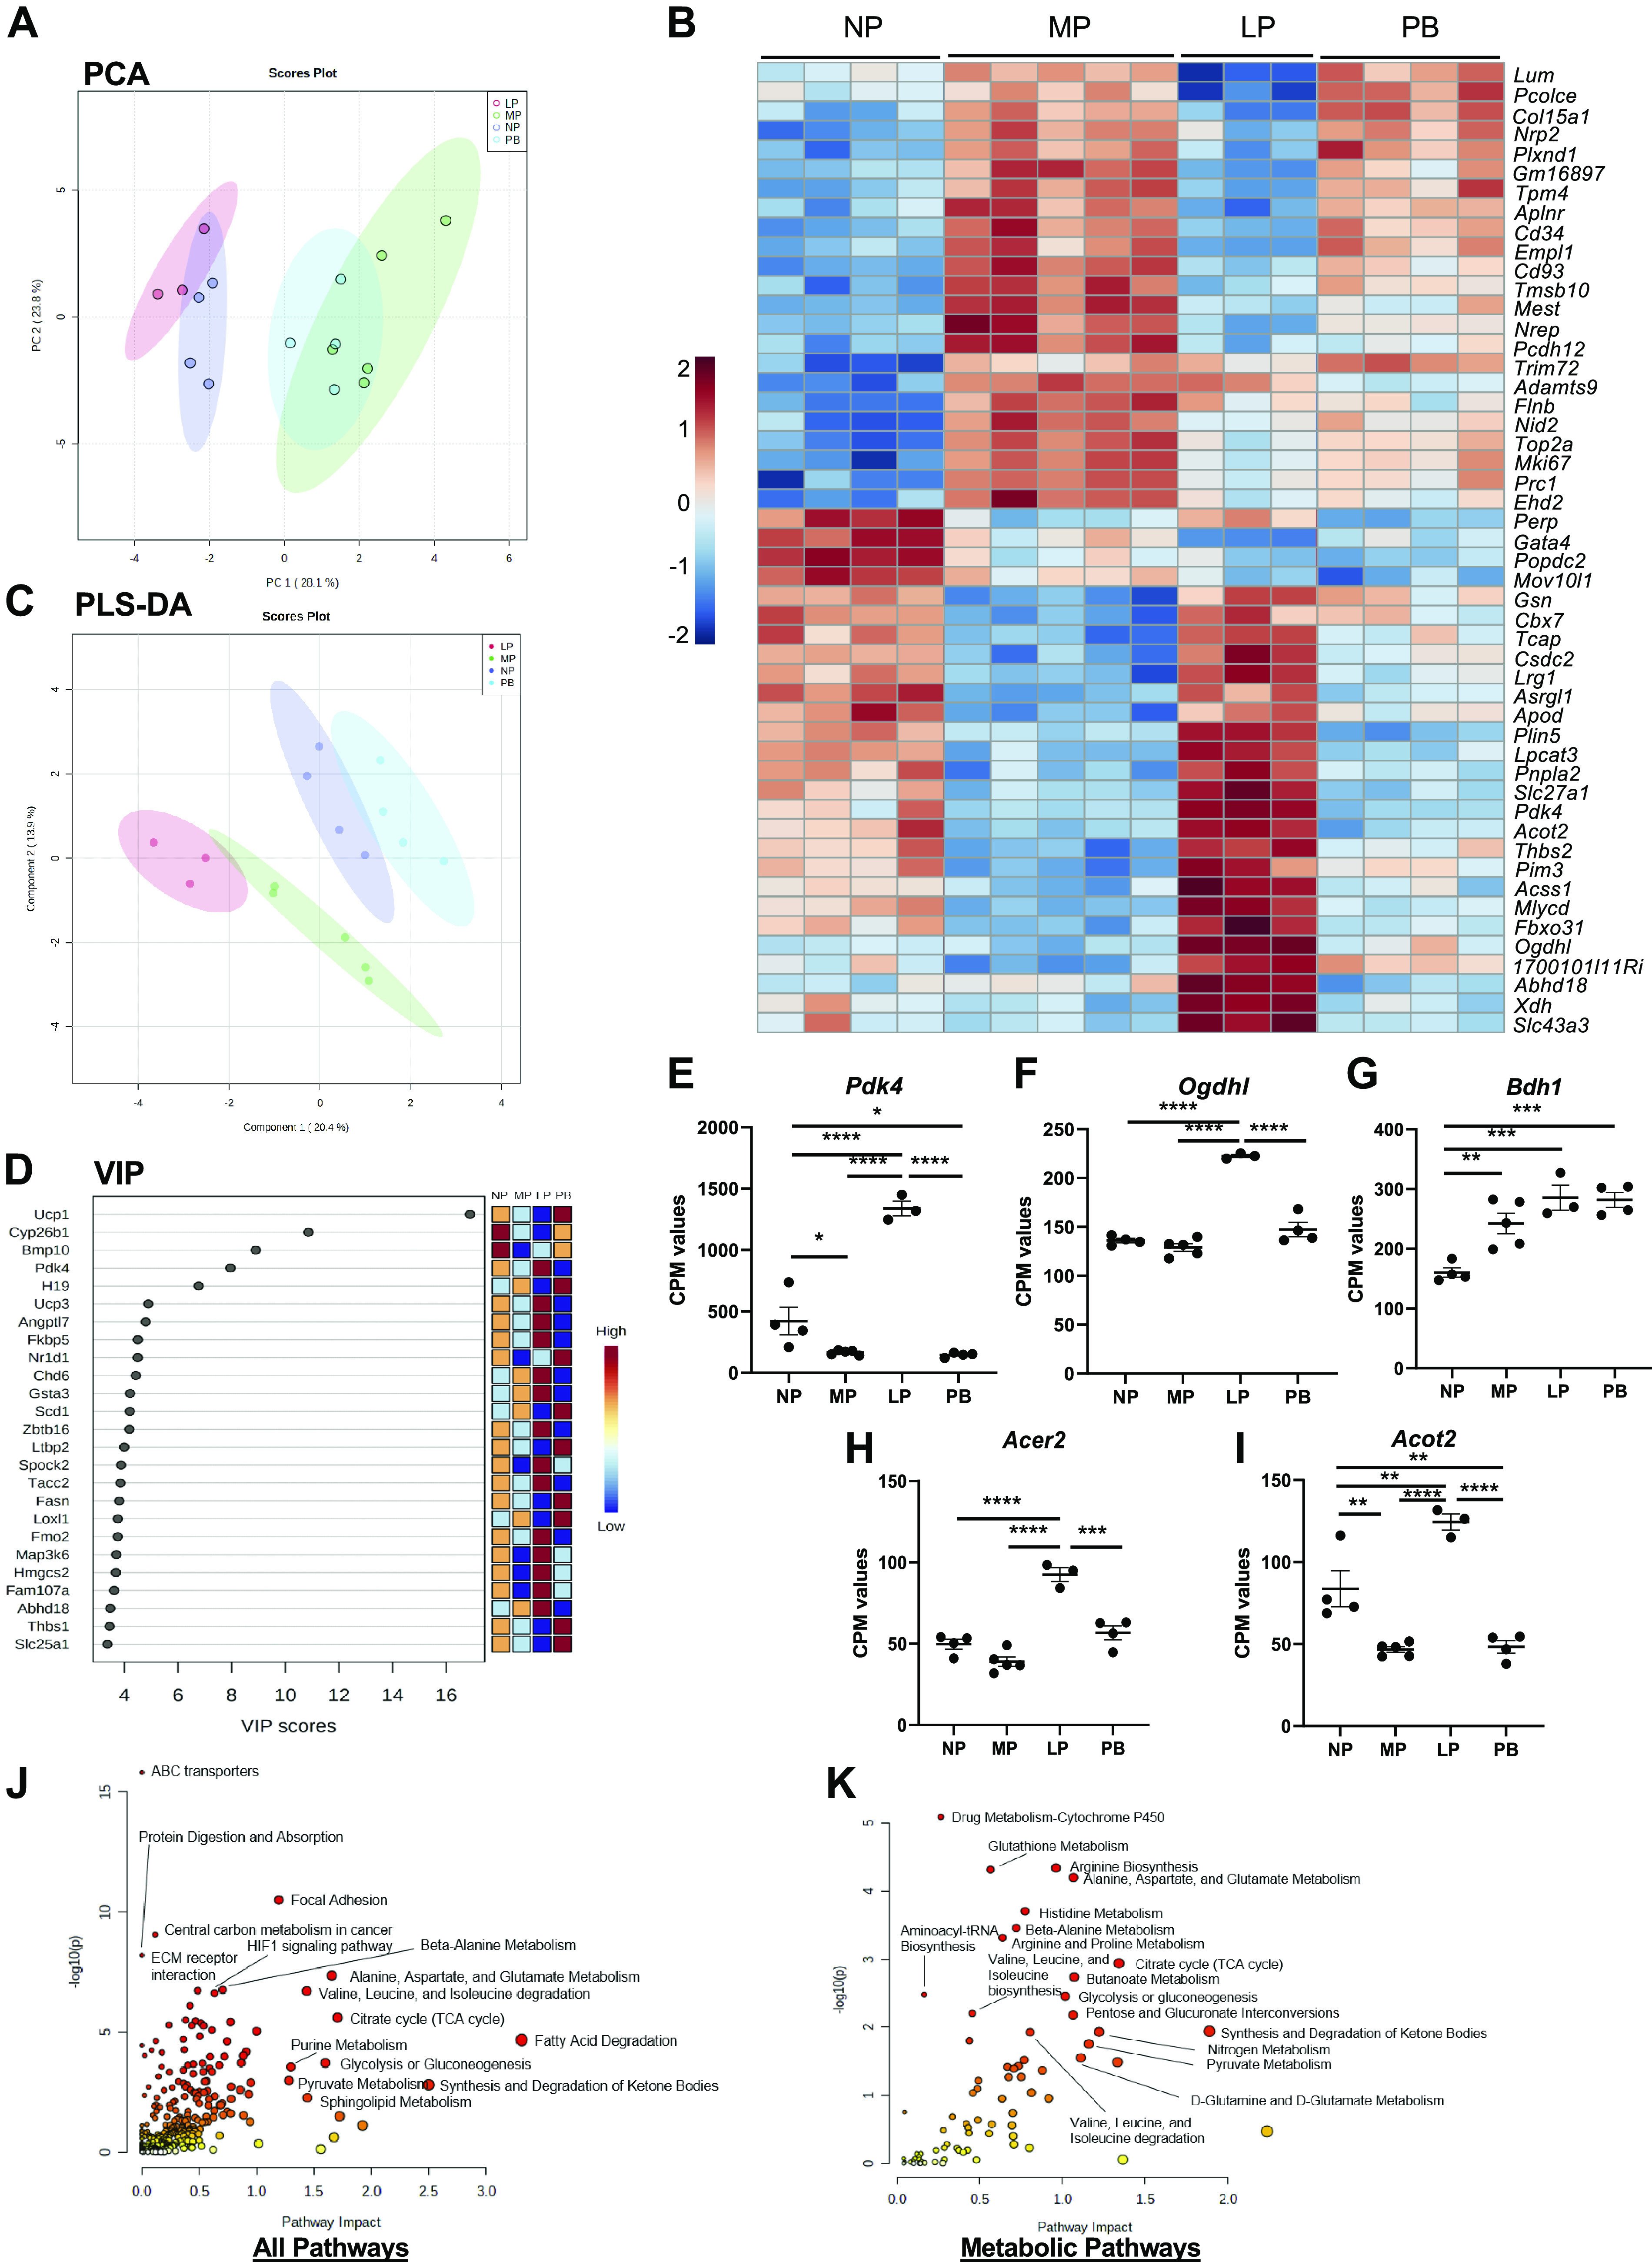
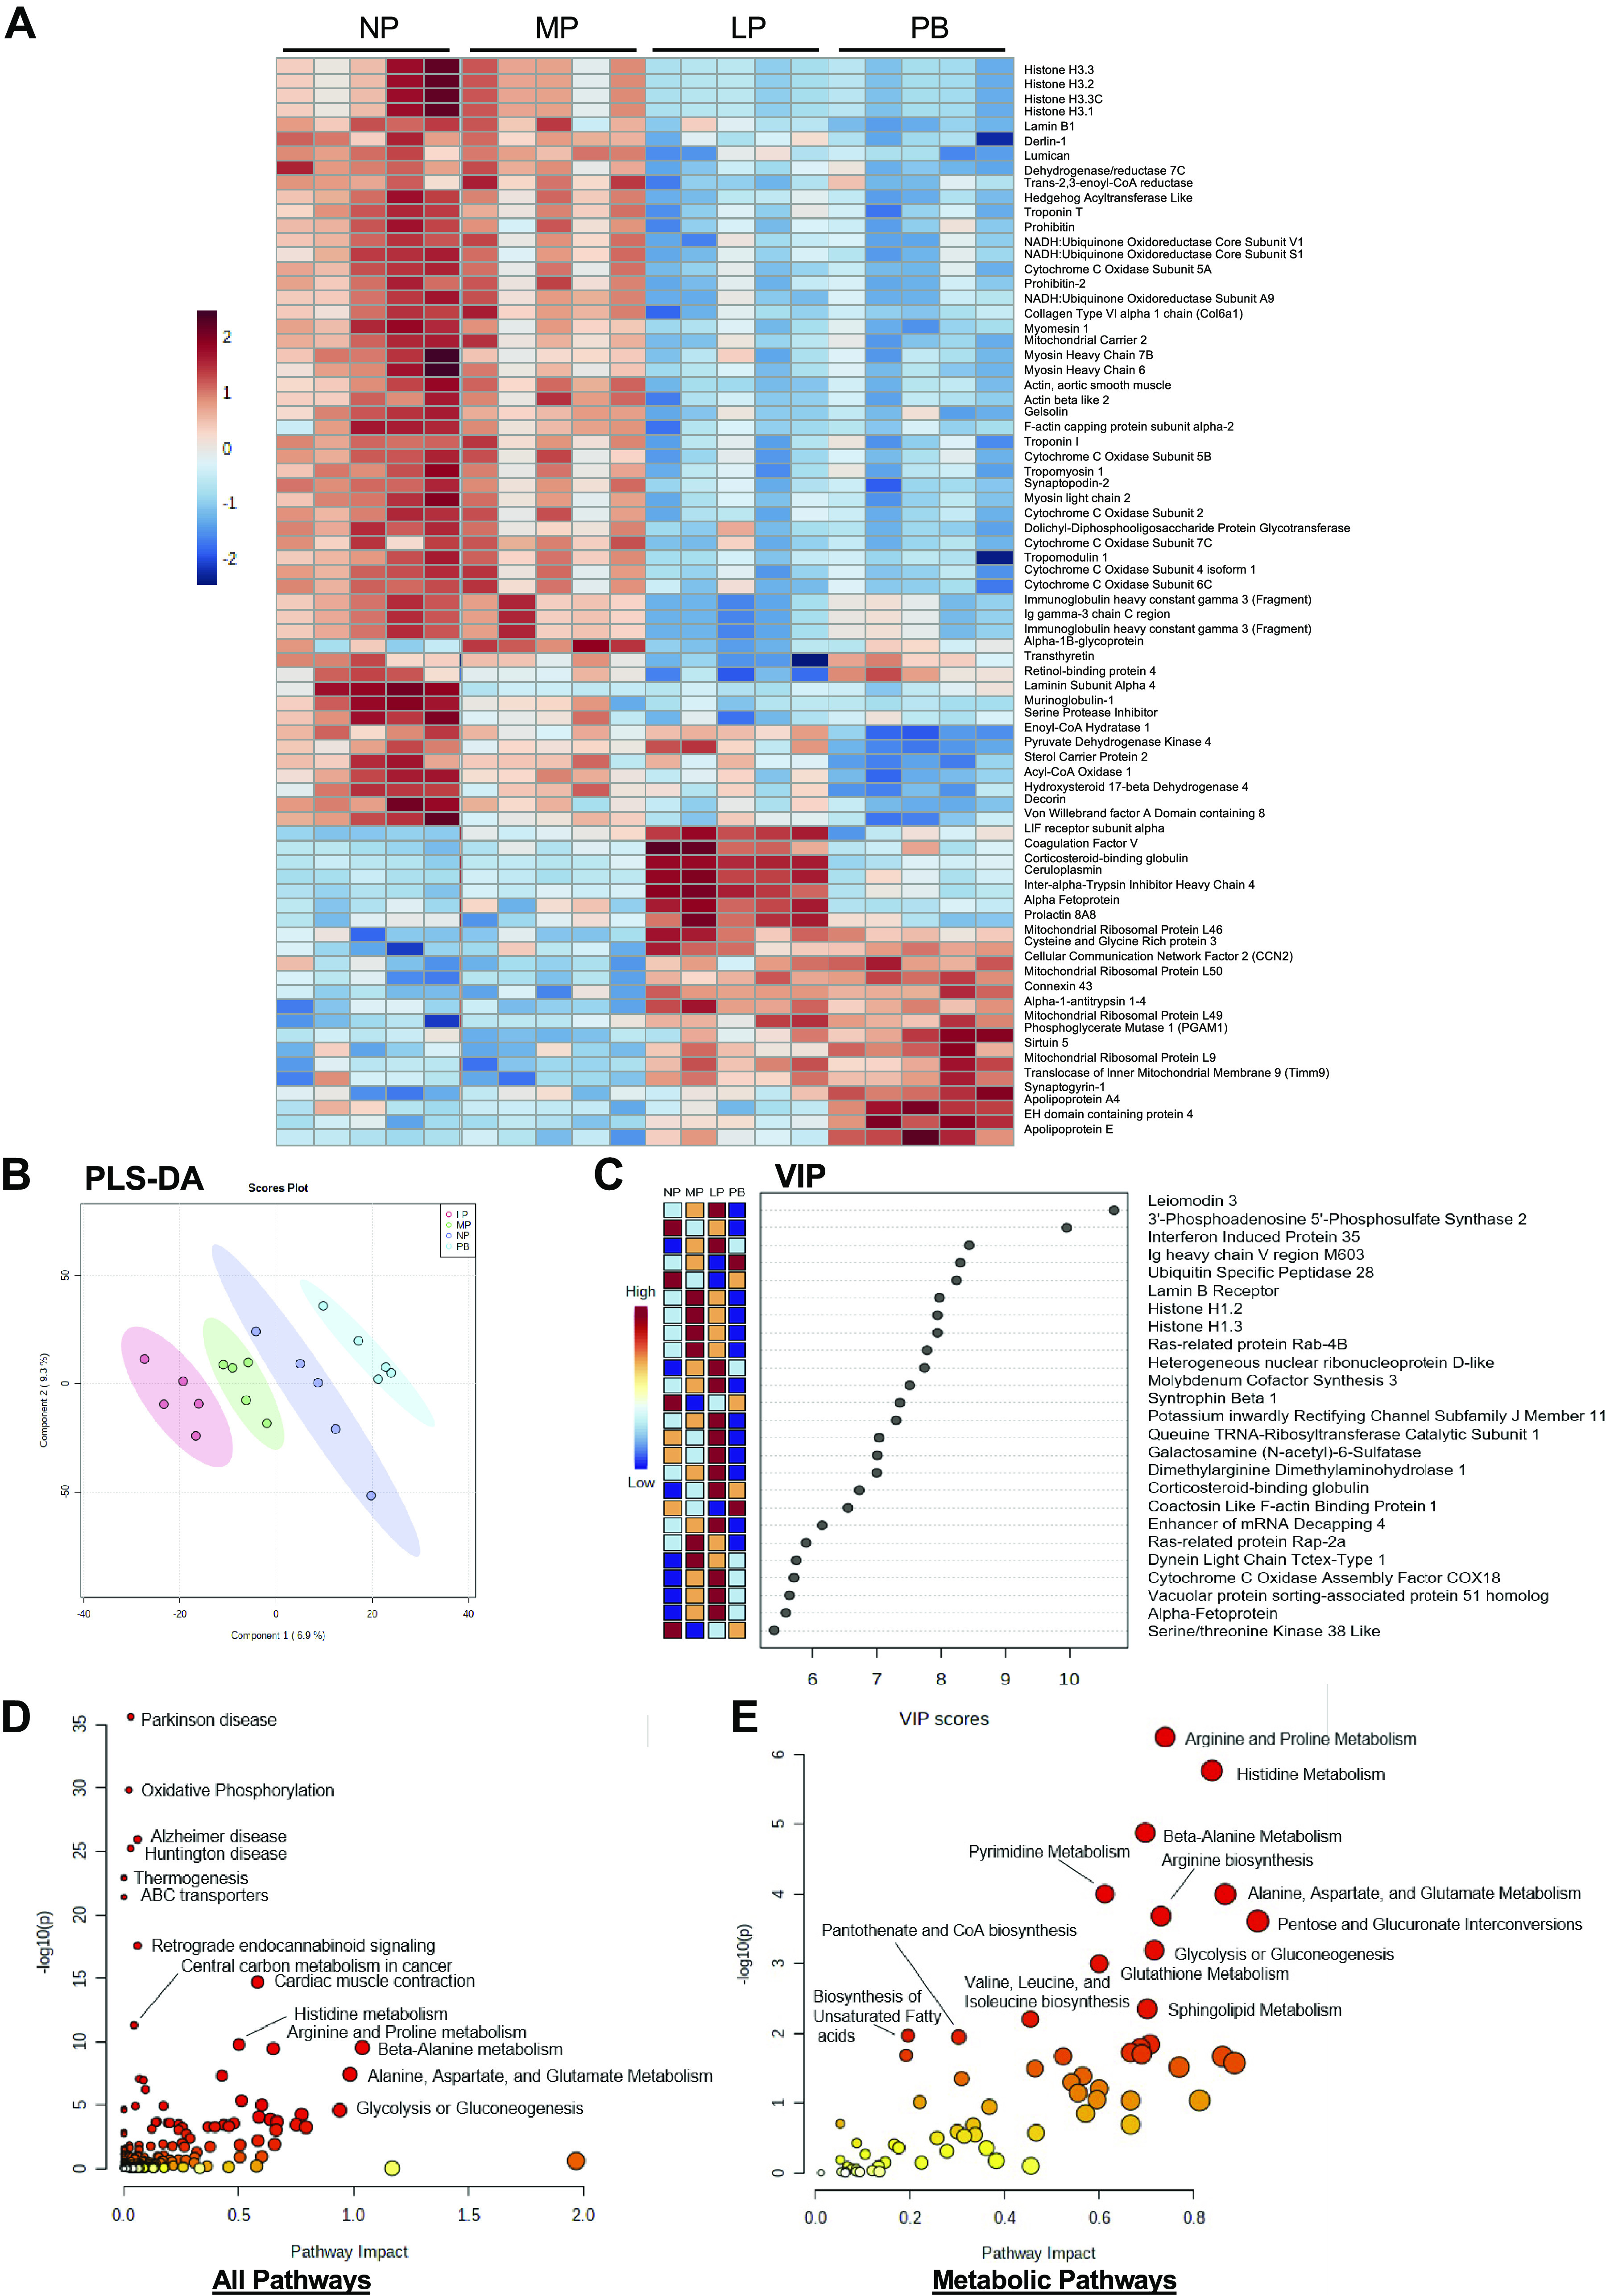
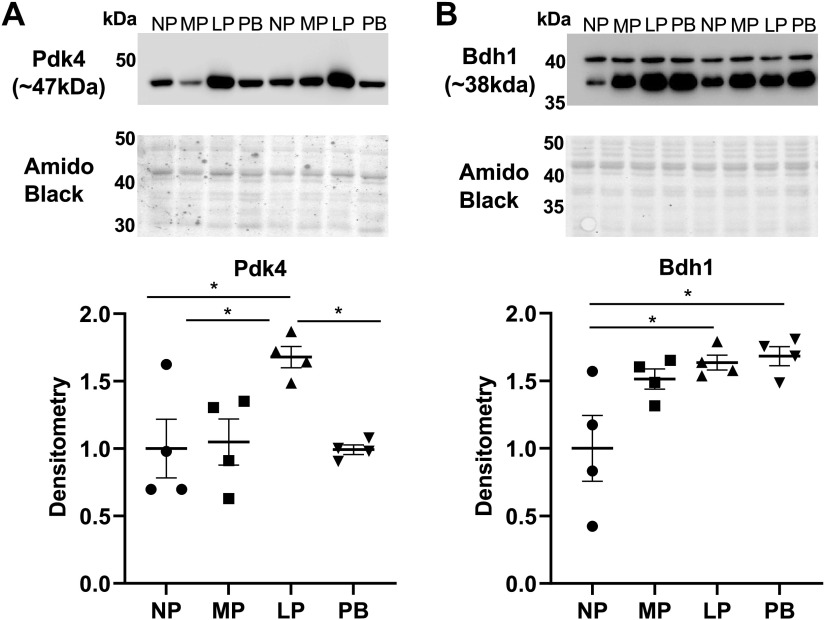
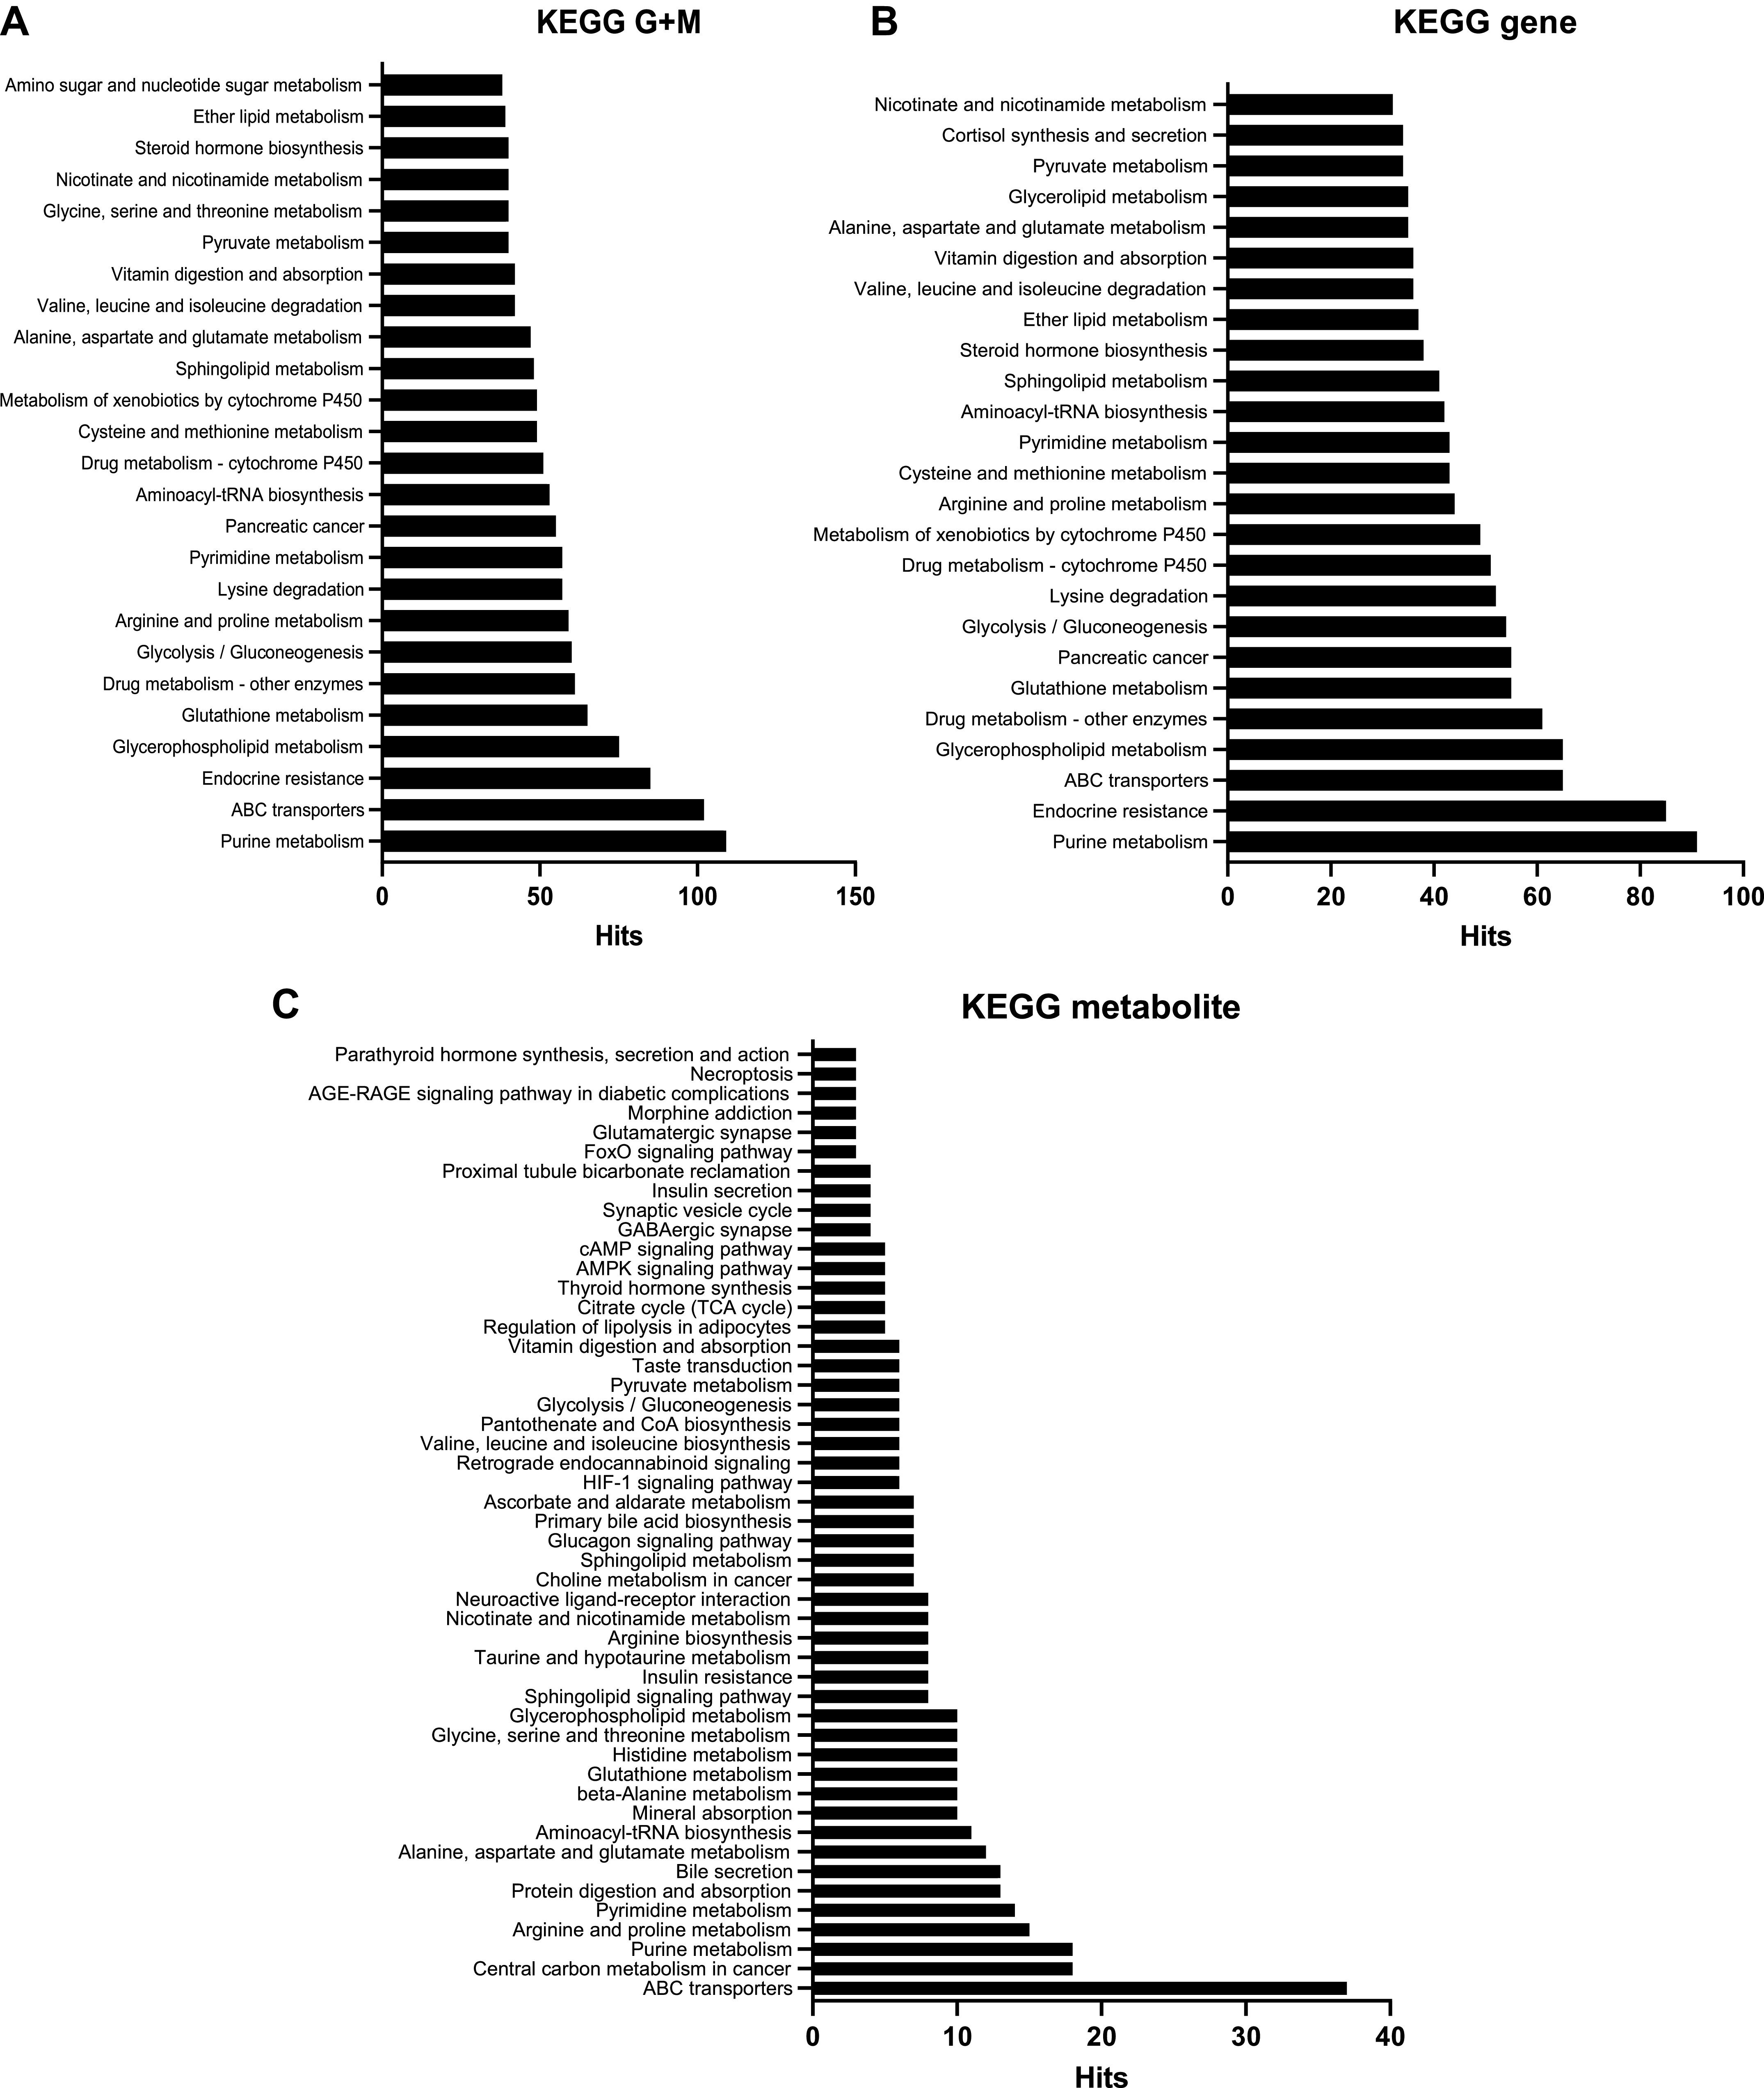
The goal of this study was to develop an atlas of the metabolic, transcriptional, and proteomic changes that occur with pregnancy in the maternal heart. Timed pregnancy studies in FVB/NJ mice revealed a significant increase in heart size by day 8 of pregnancy (midpregnancy; MP), which was sustained throughout the rest of the term compared with nonpregnant control mice. Cardiac hypertrophy and myocyte cross-sectional area were highest 7 days after birth (postbirth; PB) and were associated with significant increases in end-diastolic and end-systolic left ventricular volumes and higher cardiac output. Metabolomics analyses revealed that by day 16 of pregnancy (late pregnancy; LP) metabolites associated with nitric oxide production as well as acylcholines, sphingomyelins, and fatty acid species were elevated, which coincided with a lower activation state of phosphofructokinase and higher levels of pyruvate dehydrogenase kinase 4 (Pdk4) and β-hydroxybutyrate dehydrogenase 1 (Bdh1). In the postpartum period, urea cycle metabolites, polyamines, and phospholipid levels were markedly elevated in the maternal heart. Cardiac transcriptomics in LP revealed significant increases in not only Pdk4 and Bdh1 but also genes that regulate glutamate and ketone body oxidation, which were preceded in MP by higher expression of transcripts controlling cell proliferation and angiogenesis. Proteomics analysis of the maternal heart in LP and PB revealed significant reductions in several contractile filament and mitochondrial subunit complex proteins. Collectively, these findings describe the coordinated molecular changes that occur in the maternal heart during and after pregnancy.NEW & NOTEWORTHY Little is known of the underlying molecular and cellular mechanisms that contribute to pregnancy-induced cardiac growth. Several lines of evidence suggest that changes in cardiac metabolism may contribute. Here, we provide a comprehensive metabolic atlas of the metabolomic, proteomic, and transcriptomic changes occurring in the maternal heart. We show that pregnancy-induced cardiac growth is associated with changes in glycerophospholipid, nucleotide, and amino acid metabolism, with reductions in cardiac glucose catabolism. Collectively, these results suggest that substantial metabolic changes occur in the maternal heart during and after pregnancy.

Keywords: hypertrophy; metabolomics; pregnancy; proteomics; transcriptomics.


Conflict of interest statement

No conflicts of interest, financial or otherwise, are declared by the authors.

Figures

Figure 1.
Figure 1.
Pregnancy and postpartum period are associated with structural and functional remodeling of the maternal heart. A: schematic of study design showing the time points analyzed, which include nonpregnant, diestrus (NP), midpregnant (MP; day 8 of pregnancy), late pregnant (LP; day 16 of pregnancy), and 1-wk postbirth with lactation (PB). B–D: gravimetric measurements of body weight (B), heart weight (C), and heart weight-to-tibia length ratio (HW/TL; D) in NP, MP, LP, and PB female mice (n = 6–10 per group). E: representative images of wheat germ agglutinin and quantification of myocyte cross section. Scale bars, 200 μm. F: representative images of Sirius Red staining and quantification of % fibrosis from NP, MP, LP, and PB female mice (n = 6 per group). G–L: echocardiographic measurements of left ventricular end-diastolic volume (LVEDV; G), left ventricular end-systolic volume (LVESV; H), ejection fraction (I), cardiac output (J), stroke volume (K), and heart rate (L) from NP, MP, LP, and PB female mice (n = 5 per group). The respective n numbers in this figure correspond to 3 parallel groups of mice. *P < 0.05, **P < 0.01, ***P < 0.001, ****P < 0.0001, ANOVA with Tukey’s post hoc test.
Figure 2.
Figure 2.
Distinct changes in the cardiac metabolome during pregnancy and postpartum period. Unsupervised and supervised metabolomics analyses from hearts extracted from nonpregnant, diestrus (NP), midpregnant (MP; day 8 of pregnancy), late pregnant (LP; day 16 of pregnancy), and 1 wk postbirth (PB) female mice (n = 7–8 per group). A: unsupervised analysis was performed and a heatmap generated showing the top 75 most changed metabolites in hearts from NP, MP, LP, and PB female mice. Red indicates increased abundance, and blue indicates reduced abundance. Intensity of color indicates increased significance. B: supervised analysis showing partial least squares discriminant analysis (PLS-DA) highlighting group separation. C: the variable importance in projection plot (VIP) of the top 25 metabolites contributing to the group separation observed in the PLS-DA plot. D: Kyoto Encyclopedia of Genes and Genomes (KEGG) pathway impact analysis of the significantly changed cardiac metabolites between NP, MP, LP, and PB female mice. E: KEGG metabolite analysis of changed pathways during pregnancy and postpartum period. F and G: pathway analysis of urea cycle metabolites during LP (F) and PB (G). Red indicates significantly increased metabolite abundance, blue indicates reduced metabolite abundance, and gray indicates no change. The size of the circles indicates the degree of significance and importance of the increase in abundance (e.g., larger refers to greater significance and importance).
Figure 3.
Figure 3.
Transcriptomic analysis of the maternal heart during pregnancy and postpartum. Analyses of transcriptional changes in hearts extracted from nonpregnant, diestrus (NP), midpregnant (MP; day 8 of pregnancy), late pregnant (LP; day 16 of pregnancy), and 1 wk postbirth (PB) female mice (n = 3–5 per group). A: principal component analysis (PCA) was performed to examine group separation during analysis of differentially expressed genes. B: heatmap showing the top 75 differentially expressed transcripts in hearts from NP, MP, LP, and PB female mice. C: analysis showing partial least squares discriminant analysis (PLS-DA) highlighting group separation based on differentially expressed transcripts. D: the variable importance in projection plot (VIP) of the top 25 transcripts contributing to the group separation observed in the PLS-DA plot. E–I: counts per million (CPM) values for transcript expression of Pdk4 (E), Ogdhl1 (F), Bdh1 (G), Acer2 (H), and Acot2 (I). ANOVA analysis was performed to identify significantly expressed cardiac metabolite and transcript abundances [P <0.05; false discovery rate (FDR) 0.05] across all time points (NP, MP, LP, and PB). Human Metabolome Database (HMDB) and official gene names of those significantly expressed targets were added to the joint pathway analysis tool in Metaboanalyst 5.0. J and K: joint pathway analysis was performed with Fisher’s exact test with degree centrality topology applied and these data integrated based on pathway level combined P values for all pathways (J) and metabolic pathways (K). *P < 0.05, **P <0.01, ***P < 0.001, ****P < 0.0001, ANOVA with Tukey’s post hoc test.
Figure 4.
Figure 4.
Changes in the cardiac proteome during pregnancy and postpartum period. Proteomics analyses from hearts extracted from nonpregnant, diestrus (NP), midpregnant (MP; day 8 of pregnancy), late pregnant (LP; day 16 of pregnancy), and 1 wk postbirth (PB) female mice (n = 5 per group). A: unsupervised analysis was performed and a heatmap generated showing the top 75 differentially expressed proteins in hearts from NP, MP, LP, and PB female mice. Red indicates increased abundance, and blue indicates reduced abundance. Intensity of color indicates increased significance. B: supervised analysis showing partial least squares discriminant analysis (PLS-DA) highlighting group separation. C: the variable importance in projection plot (VIP) of the top 25 proteins contributing to the group separation observed in the PLS-DA plot. ANOVA analysis was performed to identify significantly expressed cardiac metabolite and protein abundances [P < 0.05; false discovery rate (FDR) 0.05] across all time points (NP, MP, LP, and PB). Human Metabolome Database (HMDB) and Uniprot IDs of those significantly expressed targets were added to the joint pathway analysis tool in Metaboanalyst 5.0., which corresponded to 493 changed metabolites and 350 changed proteins across all 4 time points. D and E: joint pathway analysis was performed with Fisher’s exact test with degree centrality topology applied and these data integrated based on pathway level combined P values for all pathways (D) and metabolic pathways (E).
Figure 5.
Figure 5.
Validation of transcriptomic and proteomic changes in the cardiac expression of metabolism markers during pregnancy and postpartum. A: immunoblot and densitometric analysis of Pdk4 protein expression levels in hearts from nonpregnant, diestrus (NP), midpregnant (MP; day 8 of pregnancy), late pregnant (LP; day 16 of pregnancy), and 1 wk postbirth (PB) female mice. B: immunoblot and densitometric analysis of Bdh1 protein expression levels in hearts from NP, MP, LP, and PB female mice. Protein expression levels of target proteins were normalized to total protein levels with Amido Black staining. *P <0.05 vs. age-matched control (ANOVA with Tukey’s post hoc test); n = 4 per group.
Figure 6.
Figure 6.
Tri-omics analysis of significant changes in the cardiac transcriptome, metabolome and proteome changes in during pregnancy. ANOVA analysis was performed to identify significantly expressed cardiac transcripts, metabolites and protein abundances [P <0.05; false discovery rate (FDR) 0.05] across all time points [nonpregnant, diestrus (NP), midpregnant (MP; day 8 of pregnancy), late pregnant (LP; day 16 of pregnancy), and 1 wk postbirth with lactation (PB)]. Official gene names and Human Metabolome Database (HMDB) and Uniprot IDs of those significantly expressed targets were added to the tri-omics analysis software OmicsNet. Kyoto Encyclopedia of Genes and Genomes (KEGG) pathway analysis was performed to analyze significantly impacted pathways using KEGG gene + metabolite (G+M; A), KEGG gene (B), and KEGG metabolite (C).

References

    1. Schannwell CM, Zimmermann T, Schneppenheim M, Plehn G, Marx R, Strauer BE. Left ventricular hypertrophy and diastolic dysfunction in healthy pregnant women. Cardiology 97: 73–78, 2002. doi:10.1159/000057675. - DOI - PubMed
    1. Hunter S, Robson SC. Adaptation of the maternal heart in pregnancy. Br Heart J 68: 540–543, 1992. doi:10.1136/hrt.68.12.540. - DOI - PMC - PubMed
    1. Chung E, Yeung F, Leinwand LA. Akt and MAPK signaling mediate pregnancy-induced cardiac adaptation. J Appl Physiol (1985) 112: 1564–1575, 2012. doi:10.1152/japplphysiol.00027.2012. - DOI - PMC - PubMed
    1. Burwell CS. Observations on the output of the heart and the pressure in the veins of pregnant women. Trans Am Clin Climatol Assoc 50: 46–49, 1934. - PMC - PubMed
    1. Hamilton HF. The cardiac output in normal pregnancy; as determined by the Cournand right catheterization technique. J Obstet Gynaecol Br Emp 56: 548–552, 1949. doi:10.1111/j.1471-0528.1949.tb07124.x. - DOI - PubMed

Publication types

LinkOut - more resources