. 2022 Apr 22;14(5):297.
doi: 10.3390/toxins14050297.

Clinical and Evolutionary Implications of Dynamic Coagulotoxicity Divergences in Bothrops (Lancehead Pit Viper) Venoms

Affiliations

Clinical and Evolutionary Implications of Dynamic Coagulotoxicity Divergences in Bothrops (Lancehead Pit Viper) Venoms

Lachlan Allan Bourke et al. Toxins (Basel). .

Abstract

Despite coagulotoxicity being a primary weapon for prey capture by Bothrops species (lancehead pit vipers) and coagulopathy being a major lethal clinical effect, a genus-wide comparison has not been undertaken. To fill this knowledge gap, we used thromboelastography to compare 37 venoms, from across the full range of geography, taxonomy, and ecology, for their action upon whole plasma and isolated fibrinogen. Potent procoagulant toxicity was shown to be the main venom effect of most of the species tested. However, the most basal species (B. pictus) was strongly anticoagulant; this is consistent with procoagulant toxicity being a novel trait that evolved within Bothrops subsequent to their split from anticoagulant American pit vipers. Intriguingly, two of the arboreal species studied (B. bilineatus and B. taeniatus) lacked procoagulant venom, suggesting differential evolutionary selection pressures. Notably, some terrestrial species have secondarily lost the procoagulant venom trait: the Mogi Mirim, Brazil locality of B. alternatus; San Andres, Mexico locality of B. asper; B. diporus; and the São Roque of B. jararaca. Direct action on fibrinogen was extremely variable; this is consistent with previous hypotheses regarding it being evolutionary decoupled due to procoagulant toxicity being the primary prey-capture weapon. However, human patients live long enough for fibrinogen depletion to be clinically significant. The extreme variability may be reflective of antivenom variability, with these results thereby providing a foundation for such future work of clinical relevance. Similarly, the venom diversification trends relative to ecological niche will also be useful for integration with natural history data, to reconstruct the evolutionary pressures shaping the venoms of these fascinating snakes.

Keywords: Bothrops; anticoagulant; coagulopathy; fibrinogen; procoagulant; venom evolution.


Conflict of interest statement

The authors declare no conflict of interest.

Figures
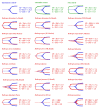
Figure 1
Figure 1
Thromboelastography traces showing the action of Bothrops venoms (red traces) on human plasma. A total of 18 representatives (red traces) of the 37 venoms examined (Table 1) are overlaid on top of the spontaneous control (blue traces) and ordered in the figure alphabetically. Three controls were performed: a negative control (spontaneous clotting time of plasma, blue traces), and two positive controls (thrombin control and FXa control, green traces). Three clotting parameters are shown: SP (split point—time until tracing splits, representing start of clotting), R (reaction time—time until amplitude = 2 mm, representing time until detectable clot), and A (Amplitude—width of tracing at latest time point, representing clot strength at latest time point). All values are mean ± standard deviation (n = 3). Each test lasted 1800 s, so > 1800 s indicates that the parameter was not recorded in this time. The spontaneous clotting control of human plasma (negative control) had an SP of 778.3 ± 51.1 s, R of 861.7 ± 33.3 s, and A of 26.0 ± 1.8 mm. Locality details for locality abbreviations used in this figure can be found in Table 1.
Figure 2
Figure 2
Ancestral state reconstructions of Bothrops venom clotting parameters from thromboelastography on human plasma. The parameters R (reaction time—time until amplitude = 2 mm, representing time until detectable clot in seconds) (left) and A (amplitude—width of tracing at latest time point, representing clot strength at latest time point in mm) (right) are shown. All values are mean ± standard deviation (n = 3) and spontaneous clotting control values are shown below each phylogeny. The colour gradient ranges from violet to black, with violet representing faster clotting times (left hand side) and stronger clots (right hand side). Note: due to the high dynamicity of venom evolution, the node bar ranges quickly become broad as one moves down the tree. The phylogeny was produced using timetree.org and updated with information from Alencar et al. [71], Carrasco et al. [72], and Fenwick et al. [73]. Each test lasted 1800 s, so R >1800 s indicates that R was not recorded in this time. Note: although B. alternatus (MM, Brazil) has an R > 1800 s, a weak clot was still observed (A = 1.7 ± 0.1) (R is only recorded if A > 2 mm). The spontaneous clotting control of human plasma (negative control) had a reaction time (R) of 861.7 ± 33.3 and amplitude (A) of 26.0 ± 1.8 mm. Locality details for locality abbreviations used in this figure can be found in Table 1.
Figure 3
Figure 3
Thromboelastography traces showing the action of Bothrops venoms (red traces) on human fibrinogen. A total of 18 representatives (red traces) of the 37 venoms examined (Table 1) are overlaid on top of the thrombin control (blue traces) and ordered in the figure alphabetically. Three clotting parameters are shown: SP (split point—time until tracing splits, representing start of clotting), R (reaction time—time until amplitude = 2 mm, representing time until detectable clot), and A (amplitude—width of tracing at latest time point, representing clot strength at latest time point). All values are mean ± standard deviation (n = 3). Each test lasted 1800 s, so >1800 s indicates that the parameter was not recorded in this time. The thrombin control had an SP of 25.0 ± 5.0 s, R of 31.7 ± 2.9 s, and A of 12.6 ± 0.5 mm. Locality details for locality abbreviations used in this figure can be found in Table 1.
Figure 4
Figure 4
Ancestral state reconstructions of Bothrops venom clotting parameters from thromboelastography on human fibrinogen. The parameters R (reaction time—time until amplitude = 2 mm, representing time until detectable clot in seconds; left) and A (amplitude—width of tracing at latest time point, representing clot strength at latest time point in mm; right) are shown. All values are mean +/− standard deviation (n = 3) and thrombin control values are shown below each phylogeny. The colour gradient ranges from violet to black, with violet representing faster clotting times (left hand side) and stronger clots (right hand side). Note: due to the high dynamicity of venom evolution, the node bar ranges quickly become broad as one moves down the tree. Each test lasted 1800 s, so R > 1800 s indicates that R was not recorded in this time. Bold species names indicate no R parameter was recorded in the test time; thus, R = >1800, and the A parameter = 0 mm (no clot observed, TEG trace flatlined). Note: although Bothrops barnetti (Peru) and B. oligolepis (MM, Brazil) have an R > 1800 s, a weak clot was still observed (A = 1.6 ± 0.1 and 1.7 ± 0.2, respectively; R is only record if A > 2 mm). The phylogeny was produced using timetree.org and updated with information from Alencar et al. [71], Carrasco et al. [72], and Fenwick et al. [73]. The thrombin control had an R of 31.7 ± 2.9 s and A of 12.6 ± 0.5 mm. Locality details for locality abbreviations used in this figure can be found in Table 1.
Figure 5
Figure 5
Thromboelastography traces showing the action of Bothrops venoms that did not clot fibrinogen (8/37 venoms) in a fibrinogen destruction assay. Venoms are ordered alphabetically in the figure. For each test, fibrinogen was incubated with venom for 30 min before the addition of thrombin in a Claussian protocol. The green trace represents the trace of each sample after 30 min incubation (no clot formed). The positive control (thrombin control) is shown in blue and venom samples (red traces) are overlaid on top of the thrombin control (blue traces). Three clotting parameters are shown: SP (split point—time until tracing splits, representing start of clotting), R (reaction time—time until amplitude = 2 mm, representing time until detectable clot), and A (amplitude—width of tracing at latest time point, representing clot strength at latest time point). All values are mean ± standard deviation (n = 3). Each test lasted 1800 s, so >1800 s indicates that the parameter was not recorded in this time. The thrombin control had an SP of 30.0 ± 5.0 s, R of 38.3 ± 2.9 s, and A of 15.2 ± 0.3 mm. Locality details for locality abbreviations used in this figure can be found in Table 1.

References

    1. Kini R.M. Serine proteases affecting blood coagulation and fibrinolysis from snake venoms. Pathophysiol. Haemost. Thromb. 2005;34:200–204. doi: 10.1159/000092424. - DOI - PubMed
    1. Kini R.M. The intriguing world of prothrombin activators from snake venom. Toxicon. 2005;45:1133–1145. doi: 10.1016/j.toxicon.2005.02.019. - DOI - PubMed
    1. Kini R.M. Anticoagulant proteins from snake venoms: Structure, function and mechanism. Biochem. J. 2006;397:377. doi: 10.1042/BJ20060302. - DOI - PMC - PubMed
    1. Kini R.M., Koh C.Y. Metalloproteases affecting blood coagulation, fibrinolysis and platelet aggregation from snake venoms: Definition and nomenclature of interaction sites. Toxins. 2016;8:284. doi: 10.3390/toxins8100284. - DOI - PMC - PubMed
    1. Kini R.M., Rao V.S., Joseph J.S. Procoagulant proteins from snake venoms. Pathophysiol. Haemost. Thromb. 2001;31:218–224. doi: 10.1159/000048066. - DOI - PubMed

Publication types

LinkOut - more resources