. 2022 May 3;10(5):233.
doi: 10.3390/toxics10050233.

Environmental Occurrence and Predicted Pharmacological Risk to Freshwater Fish of over 200 Neuroactive Pharmaceuticals in Widespread Use

Affiliations

Environmental Occurrence and Predicted Pharmacological Risk to Freshwater Fish of over 200 Neuroactive Pharmaceuticals in Widespread Use

John P Sumpter et al. Toxics. .

Abstract

There is a growing concern that neuroactive chemicals released into the environment can perturb wildlife behaviour. Among these chemicals, pharmaceuticals such as antidepressants and anxiolytics have been receiving increasing attention, as they are specifically prescribed to modify behavioural responses. Many laboratory studies have demonstrated that some of these compounds can affect various aspects of the behaviour of a range of aquatic organisms; however, these investigations are focused on a very small set of neuroactive pharmaceuticals, and they often consider one compound at a time. In this study, to better understand the environmental and toxicological dimension of the problem, we considered all pharmaceuticals explicitly intended to modulate the central nervous system (CNS), and we hypothesised that these compounds have higher probability of perturbing animal behaviour. Based on this hypothesis, we used the classification of pharmaceuticals provided by the British National Formulary (based on their clinical applications) and identified 210 different CNS-acting pharmaceuticals prescribed in the UK to treat a variety of CNS-related conditions, including mental health and sleep disorders, dementia, epilepsy, nausea, and pain. The analysis of existing databases revealed that 84 of these compounds were already detected in surface waters worldwide. Using a biological read-across approach based on the extrapolation of clinical data, we predicted that the concentration of 32 of these neuroactive pharmaceuticals in surface waters in England may be high enough to elicit pharmacological effects in wild fish. The ecotoxicological effects of the vast majority of these compounds are currently uncharacterised. Overall, these results highlight the importance of addressing this environmental challenge from a mixture toxicology and systems perspective. The knowledge platform developed in the present study can guide future region-specific prioritisation efforts, inform the design of mixture studies, and foster interdisciplinary efforts aimed at identifying novel approaches to predict and interpret the ecological implications of chemical-induced behaviour disruption.

Keywords: behaviour; ecotoxicology; environmental risk assessment; fish; mixture toxicology; pharmaceuticals in the environment; pollution; predictive toxicology.


Conflict of interest statement

The authors declare no conflict of interest.

Figures

Figure 1
Figure 1
Top 50 neuroactive pharmaceuticals dispensed in England and their concentrations in surface waters worldwide. (Left panel) Measured concentrations of neuroactive pharmaceuticals in surface waters worldwide (μg/L). The range of concentrations is visualised as box plots, where the limits indicate the 5th and 95th percentiles of the data distribution. Data points outside this range are visualised as individual dots. The vertical line in each box indicates the median value. The data were extracted from the PHARMS-UBA database curated by the German Environment Agency (Umweltbundesamt–UBA) and represent only the values generated by scientific reports classified as “good literature credibility” by the database curators. For each pharmaceutical, the figure indicates the number of available datapoints in the database (first column), the percentage of data above the limit of detection (second column), and the percentage of data below the limit of detection (third column). (Right panel) Top 50 neuroactive pharmaceuticals prescribed in England in 2019 and ranked by dispensed amount (kg). The data were generated by analysing the Prescription Cost Analysis (PCA) report (year 2019) provided by the National Health Services (NHS) of England (United Kingdom) and published by the NHS Business Services Authority.
Figure 2
Figure 2
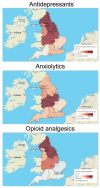
Regional differences in the prescription volumes of three selected classes of neuroactive pharmaceuticals (antidepressants, anxiolytics, opioid analgesics) in England in April 2021. The maps and related data were generated using the OpenPrescribing database (https://openprescribing.net/, accessed on 1 February 2022). The volume of each class of pharmaceuticals is expressed as number of items dispensed in April 2021.
Figure 3
Figure 3
Predicted pharmacological risk to freshwater fish of neuroactive pharmaceuticals. The pharmacological risk of the 210 neuroactive pharmaceuticals identified in the present study was estimated by comparing the predicted concentrations of pharmaceuticals in fish plasma (FSSPC, ng/mL) and the human therapeutic plasma concentrations (HTPC) expressed as Cmax (ng/mL). Considering the ratio FSSPC/HTPC, values ≥ 1 were classified as “high risk”, values between 1 and 0.1 as “medium risk”, and values < 0.1 as “low risk”. The figure displays all neuroactive pharmaceuticals predicted to have medium and high risk, based on the use of LogKOW for the prediction of drug uptake (red dots). To understand the impact of the use of different partitioning factors on the overall pharmacological risk, the same prediction was also performed using Log D7.4 (green dots).
Figure 4
Figure 4
Comparison between predicted and measured concentrations of neuroactive pharmaceuticals in surface waters in the United Kingdom. Measured concentrations of neuroactive pharmaceuticals in UK surface waters (MECs)—extracted from the PHARMS-UBA database—were available for 21 compounds. (A) This panel displays the range of UK MECs reported for each compound and their average value (i.e., green dots). It is important to note that the latter is not a “true” average MEC, but only the average of the values available in the database, which include single measurements as well as average, minimum, and maximum values. England-specific PECs are indicated by purple squares. (B) This panel displays the ratio between PECEngland and the average MECUnited Kingdom and provides an estimation of the discrepancy between predicted and measured values. To facilitate the interpretation of the data, the vertical dotted lines indicate the level of maximum accuracy (i.e., Ratio PEC/MEC = 1) and the +10-fold and −10-fold range. The red areas indicate when a PEC value overestimates or underestimates the average MEC by more than 10-fold.

References

    1. Wilson M.W., Ridlon A.D., Gaynor K.M., Gaines S.D., Stier A.C., Halpern B.S. Ecological impacts of human-induced animal behaviour change. Ecol. Lett. 2020;23:1522–1536. doi: 10.1111/ele.13571. - DOI - PubMed
    1. Doherty T.S., Hays G.C., Driscoll D.A. Human disturbance causes widespread disruption of animal movement. Nat. Ecol. Evol. 2021;5:513–519. doi: 10.1038/s41559-020-01380-1. - DOI - PubMed
    1. Shannon G., McKenna M.F., Angeloni L.M., Crooks K.R., Fristrup K.M., Brown E., Warner K.A., Nelson M.D., White C., Briggs J., et al. A synthesis of two decades of research documenting the effects of noise on wildlife. Biol. Rev. 2016;91:982–1005. doi: 10.1111/brv.12207. - DOI - PubMed
    1. Sprogis K.R., Videsen S., Madsen P.T. Vessel noise levels drive behavioural responses of humpback whales with implications for whale-watching. eLife. 2020;9:e56760. doi: 10.7554/eLife.56760. - DOI - PMC - PubMed
    1. Kamrowski R.L., Limpus C., Jones R., Anderson S., Hamann M. Temporal changes in artificial light exposure of marine turtle nesting areas. Glob. Chang. Biol. 2014;20:2437–2449. doi: 10.1111/gcb.12503. - DOI - PubMed

LinkOut - more resources