. 2022 May 27;18(5):e1010072.
doi: 10.1371/journal.pcbi.1010072. eCollection 2022 May.

Discovering sparse control strategies in neural activity

Affiliations

Discovering sparse control strategies in neural activity

Edward D Lee et al. PLoS Comput Biol. .

Abstract

Biological circuits such as neural or gene regulation networks use internal states to map sensory input to an adaptive repertoire of behavior. Characterizing this mapping is a major challenge for systems biology. Though experiments that probe internal states are developing rapidly, organismal complexity presents a fundamental obstacle given the many possible ways internal states could map to behavior. Using C. elegans as an example, we propose a protocol for systematic perturbation of neural states that limits experimental complexity and could eventually help characterize collective aspects of the neural-behavioral map. We consider experimentally motivated small perturbations-ones that are most likely to preserve natural dynamics and are closer to internal control mechanisms-to neural states and their impact on collective neural activity. Then, we connect such perturbations to the local information geometry of collective statistics, which can be fully characterized using pairwise perturbations. Applying the protocol to a minimal model of C. elegans neural activity, we find that collective neural statistics are most sensitive to a few principal perturbative modes. Dominant eigenvalues decay initially as a power law, unveiling a hierarchy that arises from variation in individual neural activity and pairwise interactions. Highest-ranking modes tend to be dominated by a few, "pivotal" neurons that account for most of the system's sensitivity, suggesting a sparse mechanism of collective control.


Conflict of interest statement

The authors have declared that no competing interests exist.

Figures

Fig 1
Fig 1. Four possibilities for sparse sensitivity.
When collective activity shows sloppy structure, the local information geometry is elongated along sloppy, insensitive directions. With dense collective encoding, multiple components each matter equally. Starred combination with sloppy, sparse combinations of neurons aligns with centralized control.
Fig 2
Fig 2. Pairwise maxent model of anterior neural activity from reference [59] (see Fig B in S1 Text for another experiment).
(A) Pairwise correlations between subset of N = 50 neurons. Average individual neuron rk=−1(sm) shown along diagonal. (B) Inferred biases hm,k=−1 along diagonal and matrix of couplings Jmt off the diagonal. (C) Coarse collective synchrony, probability that a plurality of n neurons coincide ϕcoarse(n), for data, pairwise maxent model, independent model, and shuffled couplings. Inset compares pairwise correlations for data with maxent model. Error bars show one standard deviation over bootstrapped samples. (D) Fine-grained synchrony ϕfine in the independent vs. pairwise maxent model. This is the probability of set sizes, the number of neurons in each of the three states when ordered n1n2n3 such that n1 corresponds to the size of the plurality and n3 the smaller minority. Error bars show one standard error.
Fig 3
Fig 3
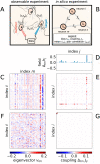
(A) Perturbation thought experiment consists of clamping matcher neuron m to the state of target neuron t with some small probability ϵ when indicated by a random number generator (RNG). We draw electrodes controlling membrane voltage, but optogenetic protocols are more elegant. (B) Perturbation corresponds to modifying fields and couplings in a pairwise maxent model. (C) Principal eigenmatrix for fine-grained synchrony mapped to change in (D) biases {hi}, shown only for the “down” state, and (E) couplings {Jij} for ϵ = 10−4. (F) Diffuse observable perturbation using replacement rule from Eq 4 corresponds to (G) localized “natural” perturbation to one coupling (note nonzero values in the top left corner).
Fig 4
Fig 4
(A) FIM eigenvalue spectrum for pairwise maxent, independent (indpt.) and shuffled couplings null models. Results are averaged over M Monte Carlo samples (M = 10 for maxent model and random shuffles, M = 4 for indpt. and canonical). For comparison, we show response to canonical perturbation to couplings. Insets on left show example eigenmatrices of rank 1 and 50, but only the first displays strong vertical striations. Inset on right shows full eigenvalue spectrum. Error bars show standard error of the mean. (B) Eigenmatrix column and row uniformity. Error bars represent a standard deviation across Monte Carlo samples. (C) Rescaled sensitivity. Principal FIM eigenvalues but for neuron subsamples as a function of subsample size. Normalized by the average maximum eigenvalue for the maxent model. Error bars represent standard deviation around means of Monte Carlo samples. Points have been offset for visibility along the x-axis. Compare with Fig P in S1 Text.
Fig 5
Fig 5
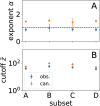
(A) Power law exponent from fitting FIM eigenvalue spectra comparing observable and canonical perturbations. (B) Exponential tail cutoff z¯. See Fig F in S1 Text for another experiment.
Fig 6
Fig 6. Fraction of times out of 10 Monte Carlo samples that neuron column uniformity exceeds 99% and 99.9% percentile cutoffs out of column uniformities over all neurons and eigenmatrices.
See also Fig S in S1 Text.

References

    1. Goh KI, Cusick ME, Valle D, Childs B, Vidal M, Barabasi AL. The Human Disease Network. Proc Natl Acad Sci USA. 2007;104(21):8685–8690. doi: 10.1073/pnas.0701361104 - DOI - PMC - PubMed
    1. Vidal M, Cusick ME, Barabási AL. Interactome Networks and Human Disease. Cell. 2011;144:986–998. doi: 10.1016/j.cell.2011.02.016 - DOI - PMC - PubMed
    1. Zhang B, Gaiteri C, Bodea LG, Wang Z, McElwee J, Podtelezhnikov AA, et al.. Integrated Systems Approach Identifies Genetic Nodes and Networks in Late-Onset Alzheimer’s Disease. Cell. 2013;153(3):707–720. doi: 10.1016/j.cell.2013.03.030 - DOI - PMC - PubMed
    1. Hallinen KM, Dempsey R, Scholz M, Yu X, Linder A, Randi F, et al.. Decoding Locomotion from Population Neural Activity in Moving C. Elegans. eLife. 2021;10:e66135. doi: 10.7554/eLife.66135 - DOI - PMC - PubMed
    1. Morone F, Makse HA. Symmetry Group Factorization Reveals the Structure-Function Relation in the Neural Connectome of Caenorhabditis Elegans. Nat Commun. 2019;10(1):4961. doi: 10.1038/s41467-019-12675-8 - DOI - PMC - PubMed

Publication types