. 2022 May 27;18(5):e1010158.
doi: 10.1371/journal.pcbi.1010158. eCollection 2022 May.

Assessing the impact of lateral flow testing strategies on within-school SARS-CoV-2 transmission and absences: A modelling study

Affiliations

Assessing the impact of lateral flow testing strategies on within-school SARS-CoV-2 transmission and absences: A modelling study

Trystan Leng et al. PLoS Comput Biol. .

Abstract

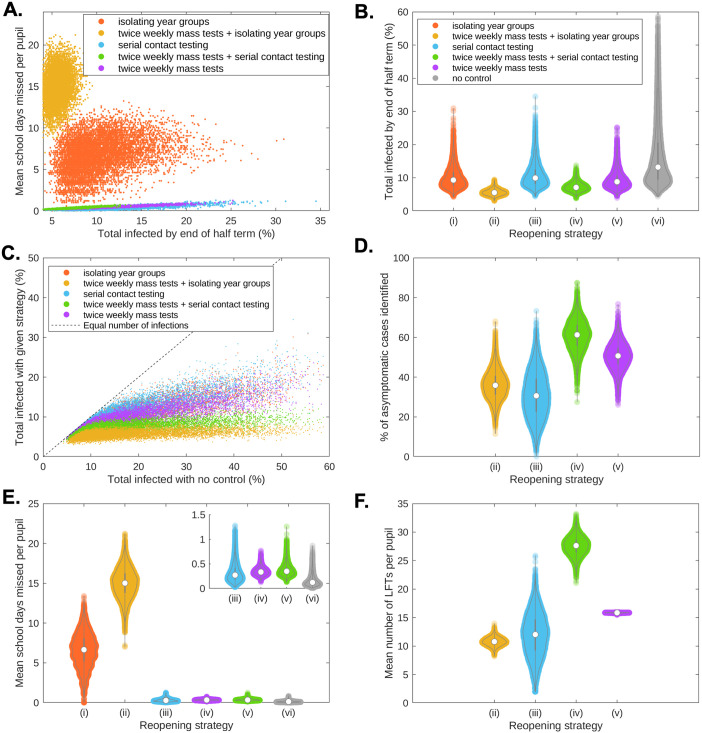
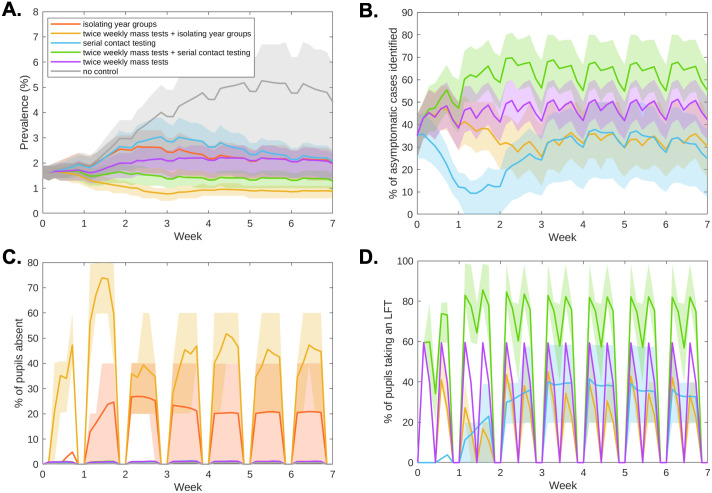
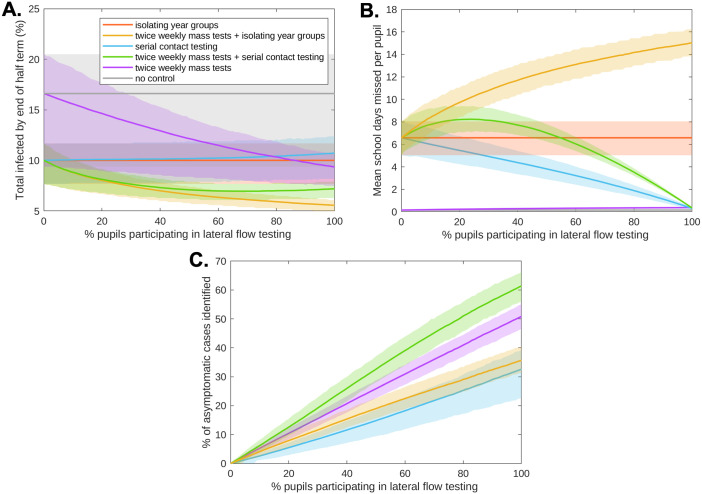
Rapid testing strategies that replace the isolation of close contacts through the use of lateral flow device tests (LFTs) have been suggested as a way of controlling SARS-CoV-2 transmission within schools that maintain low levels of pupil absences. We developed an individual-based model of a secondary school formed of exclusive year group bubbles (five year groups, with 200 pupils per year) to assess the likely impact of strategies using LFTs in secondary schools over the course of a seven-week half-term on transmission, absences, and testing volume, compared to a policy of isolating year group bubbles upon a pupil returning a positive polymerase chain reaction (PCR) test. We also considered the sensitivity of results to levels of participation in rapid testing and underlying model assumptions. While repeated testing of year group bubbles following case detection is less effective at reducing infections than a policy of isolating year group bubbles, strategies involving twice weekly mass testing can reduce infections to lower levels than would occur under year group isolation. By combining regular testing with serial contact testing or isolation, infection levels can be reduced further still. At high levels of pupil participation in lateral flow testing, strategies replacing the isolation of year group bubbles with testing substantially reduce absences, but require a high volume of testing. Our results highlight the conflict between the goals of minimising within-school transmission, minimising absences and minimising testing burden. While rapid testing strategies can reduce school transmission and absences, they may lead to a large number of daily tests.


Conflict of interest statement

The authors have declared that no competing interests exist.

Figures

Fig 1
Fig 1. The trade-off between transmission, absences, and testing volume.
(a) Relationship between total infections and school days missed for an isolation of year group bubbles strategy (orange), twice weekly mass testing combined with isolation of year group bubbles (yellow), serial contact testing (blue), twice weekly mass testing combined with serial contact testing (green), and twice weekly mass testing alone (purple). (b) Percentage of school pupils infected during the course of the half-term.(c) Comparison of the total number of infections by the end of the half-term by the five considered control strategies (y-axis) against the total number of infections by the end of the half-term with no infection control measures (x-axis). The dashed line corresponds to parity in the total amount of infection using no infection controls and the given control strategy. (d) For rapid testing strategies, the percentage of asymptomatic cases that had been identified through rapid testing by the end of the half term. (e) Violin plots of the mean number of school days missed per pupil within simulated schools. The inset plot shows strategies (iii)-(vi). (f) For rapid testing strategies, violin plots of the mean number of LFTs taken per pupil within simulated schools. Results produced from 10,000 simulations. In all violin plots, the circle marker denotes the median and the black bars the 50% prediction intervals.
Fig 2
Fig 2. Infection, absences, and testing over the duration of the school half-term.
We display timeseries of (a) prevalence, (b) the percentage of currently infectious asymptomatic individuals identified for reopening strategies involving within-school testing. We display timeseries of (c) the percentage of pupils absent and (d) percentage of pupils tested throughout the half-term. Solid line traces correspond to the mean value attained on each daily timestep and shaded envelopes represent the 50% prediction intervals (these regions contain 50% of all simulations at each timepoint). The strategies displayed are: no control (grey), twice weekly mass testing (purple), serial contact testing (blue), isolating year group bubbles strategy (orange), combined twice weekly mass testing and serial contact testing (green), combined twice weekly mass testing and isolation of year group bubbles (yellow). Results produced from 10,000 simulations.
Fig 3
Fig 3. The impact of pupil participation in lateral flow testing on infections and absences.
We varied the percentage of pupils who agreed to participate in lateral flow testing (0% to 100%, with 1% increments). (a) Total number of pupils infected by the end of the half-term. (b) Mean school days missed per pupil within a school over the course of the half-term. (c) For rapid testing strategies, the percentage of asymptomatic cases that had been identified through rapid testing by the end of the half term. In each panel, solid line traces correspond to the mean value attained from 2,000 simulations and shaded envelopes represent the 50% prediction intervals (these regions contain 50% of all simulations at each timepoint). The strategies displayed are: no control (grey), twice weekly mass testing (purple), serial contact testing (blue), isolating year group bubbles (orange), combined twice weekly mass testing and serial contact testing (green), combined twice weekly mass testing and isolation of year group bubbles (yellow).

References

    1. Office for National Statistics. Coronavirus and the social impacts on Great Britain: 29 January 2021; 2021. Available from: https://www.ons.gov.uk/peoplepopulationandcommunity/healthandsocialcare/....
    1. House of Commons Library. Briefing Paper Number 8866, 18 January 2021—Coronavirus: Economic impact; 2021. Available from: https://researchbriefings.files.parliament.uk/documents/CBP-8866/CBP-886....
    1. Bonaccorsi G, Pierri F, Cinelli M, Flori A, Galeazzi A, Porcelli F, et al.. Economic and social consequences of human mobility restrictions under COVID-19. Proceedings of the National Academy of Sciences. 2020;117(27):15530–15535. doi: 10.1073/pnas.2007658117 - DOI - PMC - PubMed
    1. DELVE. Balancing the Risks of Pupils Returning to Schools; 2021. Available from: https://rs-delve.github.io/reports/2020/07/24/balancing-the-risk-of-pupi....
    1. Centre for Education Policy and Equalising Opportunities. Briefing Note: School Absences and Pupil Achievement; 2021. Available from: https://repec-cepeo.ucl.ac.uk/cepeob/cepeobn1.pdf.

Publication types