. 2022 May 27;18(5):e1010542.
doi: 10.1371/journal.ppat.1010542. eCollection 2022 May.

Effector loss drives adaptation of Pseudomonas syringae pv. actinidiae biovar 3 to Actinidia arguta

Affiliations

Effector loss drives adaptation of Pseudomonas syringae pv. actinidiae biovar 3 to Actinidia arguta

Lauren M Hemara et al. PLoS Pathog. .

Abstract

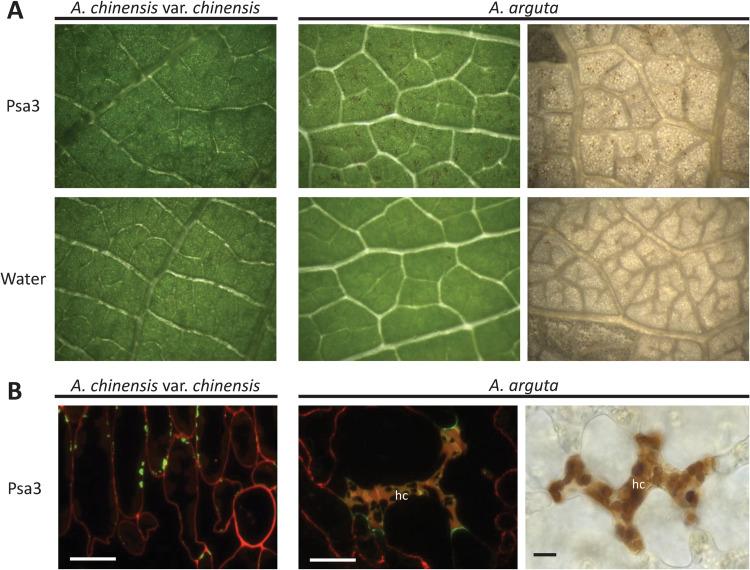
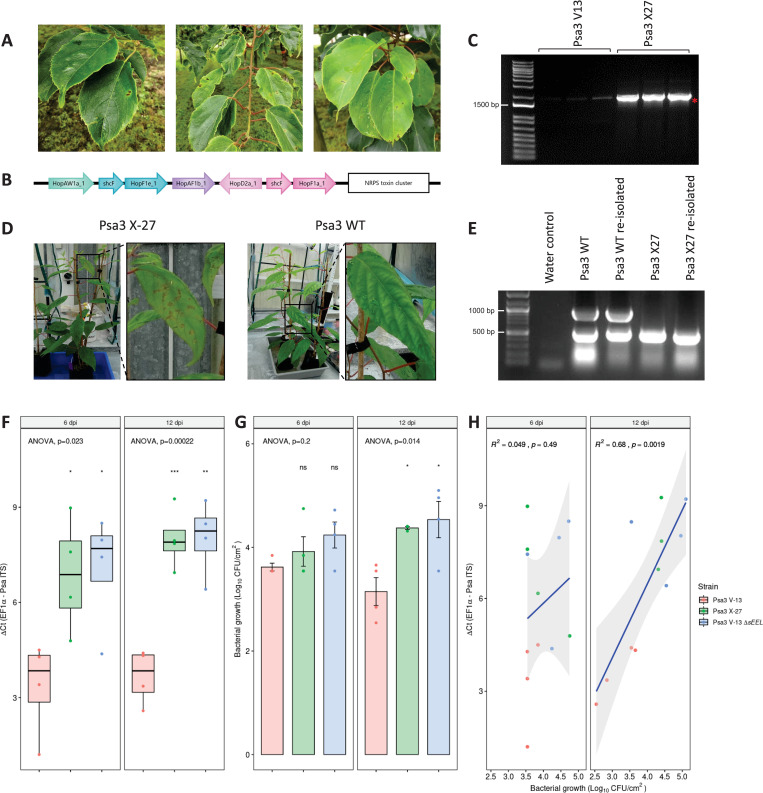
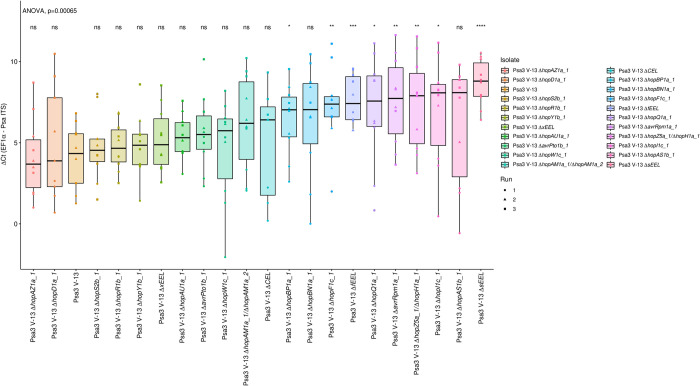
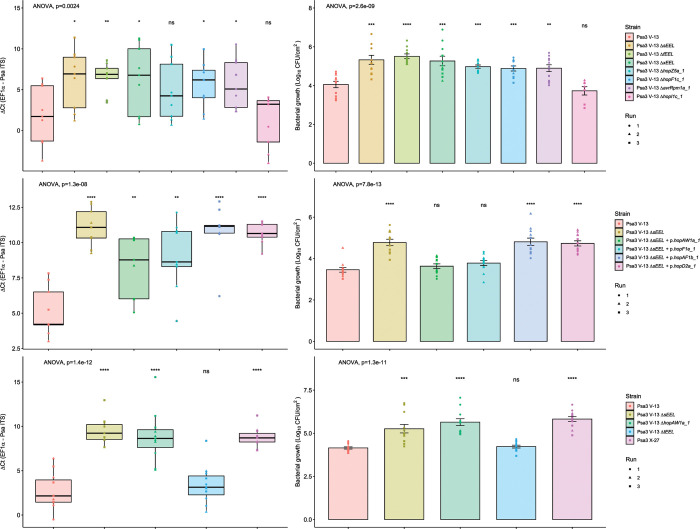
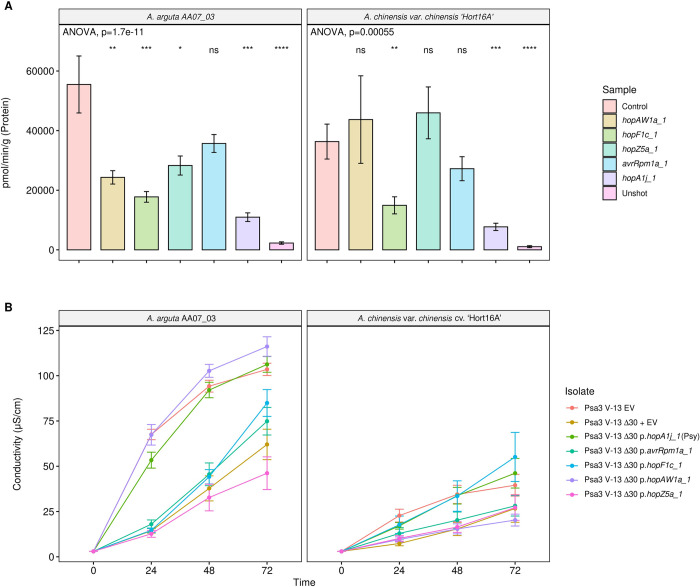
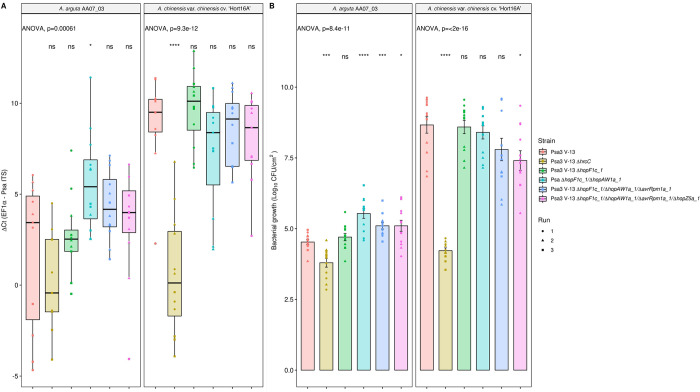
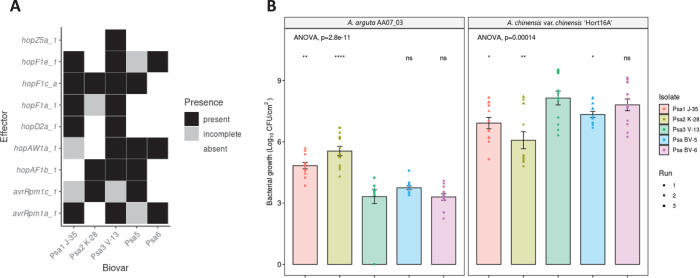
A pandemic isolate of Pseudomonas syringae pv. actinidiae biovar 3 (Psa3) has devastated kiwifruit orchards growing cultivars of Actinidia chinensis. In contrast, A. arguta (kiwiberry) is not a host of Psa3. Resistance is mediated via effector-triggered immunity, as demonstrated by induction of the hypersensitive response in infected A. arguta leaves, observed by microscopy and quantified by ion-leakage assays. Isolates of Psa3 that cause disease in A. arguta have been isolated and analyzed, revealing a 51 kb deletion in the exchangeable effector locus (EEL). This natural EEL-mutant isolate and strains with synthetic knockouts of the EEL were more virulent in A. arguta plantlets than wild-type Psa3. Screening of a complete library of Psa3 effector knockout strains identified increased growth in planta for knockouts of four effectors-AvrRpm1a, HopF1c, HopZ5a, and the EEL effector HopAW1a -suggesting a resistance response in A. arguta. Hypersensitive response (HR) assays indicate that three of these effectors trigger a host species-specific HR. A Psa3 strain with all four effectors knocked out escaped host recognition, but a cumulative increase in bacterial pathogenicity and virulence was not observed. These avirulence effectors can be used in turn to identify the first cognate resistance genes in Actinidia for breeding durable resistance into future kiwifruit cultivars.


Conflict of interest statement

The authors have declared that no competing interests exist.

Figures

Fig 1
Fig 1. Pseudomonas syringae pv. actinidiae biovar3 (Psa3) induces the hypersensitive response in Actinidia arguta.
A. arguta and A. chinensis var. chinensis leaves displaying symptoms following infection with Psa3 V-13 at 1 day post-infection (dpi) in A. arguta and 5 dpi in A. chinensis var. chinensis. (A) Visualization of macroscopically visible localized cell death indicative of a hypersensitive response (HR) in leaves of A. arguta, in contrast to A. chinensis var. chinensis, spray-infected with Psa3 V-13 at 108 cfu/mL or water control (left). A. arguta leaves were cleared in acetic acid:ethanol to better visualize brown phenolic compounds indicating cell death (right; brown speckling in the images). Images were viewed under a binocular microscope at 2x magnification, except for the top right image which was at 4x magnification. (B) Fluorescence microscopy of Psa3 V-13-infected A. arguta and A. chinensis var. chinensis mesophyll tissue. Callose (β1-3-glucan) is immuno-labelled and fluorescence indicated in green; cell wall pectin is immuno-labeled and fluorescence indicated in red; yellow coloring is accumulation of phenolic compounds in cells showing hypersensitive cell death (hc; left) and loss of cell wall integrity. Bright field microscopy of cleared A. arguta leaf in A indicates phenolic compound accumulation in cells showing hypersensitive cell death (hc; right) caused by cell wall breakdown. Scale bars represent 10 μm.
Fig 2
Fig 2. Pseudomonas syringae pv. actinidiae biovar3 (Psa3) isolated from symptomatic Actinidia arguta plants has a deletion in the exchangeable effector locus that escapes host recognition.
(A) Psa leaf spot symptoms on commercial A. arguta ‘HortGem Tahi’ plants in the Plant & Food Research Te Puke Research Orchard. (B) The Psa3 X-27 gene deletion spans the effectors hopAW1a, hopF1e, hopAF1b, hopD2a, hopF1a, and the non-ribosomal peptide synthase (NRPS) toxin cluster. The Psa3 X-27 gene deletion was identified through whole-genome sequencing on an Illumina HiSeq platform and confirmed by PCR. (C) Three colonies of Psa3 ICMP 18884 (V13) or Psa3 X-27 were used as templates for PCR across the deletion boundary Psa-X27 (1804 bp) and the band indicating deletion (red asterisk) confirmed by Sanger sequencing. The weak non-specific band in Psa V13 samples are present in all samples. DNA marker is 1Kb Plus DNA Ladder from Thermo Fisher (NZ) with 1500 bp band indicated. (D) Psa3 X-27 or Psa3 10627 (WT) were sprayed onto potted A. arguta AA07_03 plants and photographs of symptoms taken 6 months post-infection. (E) Psa3 10627 (WT) and Psa3 X-27 re-isolated from infected leaves and confirmed by multiplex PCR for Psa-ompP1 (492 bp) and the EEL effector gene hopF1e (883 bp). DNA ladder is 100bp DNA Marker from Zymo Research (USA) with 1000 bp and 500 bp bands indicated. (F-H) A. arguta AA07_03 plantlets were flood-inoculated with Psa3 V-13, Psa3 X-27, and Psa3 V-13 ΔsEEL at approximately 106 cfu/mL. Bacterial growth was quantified at 6 and 12 days post-inoculation by qPCR ΔCt analysis F and plate count quantification G. (F) Box and whisker plots, with black bars representing the median values for the four pseudobiological replicates and whiskers representing the 1.5 inter-quartile range. (G) Bar height represents the mean number of Log10 cfu/cm2 and error bars represent the standard error of the mean (SEM) between four pseudobiological replicates. (H) Regression analysis comparing the two quantification methods (F and G). The linear regression line is indicated in blue, the grey region indicates a 95% confidence interval, and the r-value represents the correlation coefficient (R2) and its associated p-value. The experiments were repeated three times with similar results. Asterisks indicate the statistically significant difference of Student’s t-test between the indicated strain and wild-type Psa3 V-13, where p≤.05 (*), p≤.01 (**), p≤.001 (***), and p>.05 (ns; not significant).
Fig 3
Fig 3. Pathogenicity assay screen of Psa3 V-13 effector knockout strains in Actinidia arguta identifies four avirulence loci.
A. arguta AA07_03 kiwifruit plantlets were flood-inoculated at approximately 106 cfu/mL. Psa biomass (ITS) was quantified relative to AaEF1α using the ΔCt analysis method for three pseudobiological replicates, per strain, per experimental run. Box and whisker plots, with black bars representing the median values and whiskers representing the 1.5 inter-quartile range. Asterisks indicate the statistically significant difference of Student’s t-test following ANOVA between the indicated strain and wild-type Psa3 V-13, where p ≤.05 (*), p≤.01 (**), p≤.001 (***), p≤.0001 (****), and p>.05 (ns; not significant). This experiment was separately conducted three times (biological replicates) with three batches of independently grown plants and data were stacked to generate the box plots.
Fig 4
Fig 4. Pathogenicity assay of Psa3 V-13 effector knockout strains and complementation confirming four effectors’ recognition in Actinidia arguta.
A. arguta AA07_03 kiwifruit plantlets were flood-inoculated at approximately 106 cfu/mL. Bacterial pathogenicity was quantified relative to Psa3 V-13 using the ΔCt analysis method and box and whisker plots, with black bars representing the median values and whiskers representing the 1.5 inter-quartile range in (A), (C), or (E), or plate count quantification with bar height representing the mean log10 cfu/cm2 and error bars representing the standard error of the mean (SEM) in (B), (C), or (F), for four pseudobiological replicates, per strain, per experimental run. Bacterial growth was quantified 12 days post-inoculation for selected knockout strains (A) and (B), the plasmid-complemented ΔsEEL strains (C) and (D), or the ΔtEEL and ΔhopAW1a strains (E) and (F). Asterisks indicate the statistically significant difference of Student’s t-test between the indicated strain and wild-type Psa3 V-13, where p ≤.05 (*), p≤.01 (**), p≤.001 (***), p≤0.0001 (****), and p>.05 (ns; not significant). This experiment was separately conducted three times (biological replicates) with three batches of independently grown plants and data were stacked to generate the box plots and bar graphs shown.
Fig 5
Fig 5. Reporter eclipse assays demonstrate that HopAW1a, HopZ5a, and AvrRpm1a trigger a host-specific immunity response in Actinidia arguta partially supported by ion leakage assays.
(A) Avirulence effectors cloned in binary vector constructs tagged with GFP, or an empty vector (Control), were co-expressed with a β-glucuronidase (GUS) reporter construct using biolistic bombardment and priming in leaves from A. arguta AA07_03 or A. chinensis var. chinensis ‘Hort16A’ plantlets [35]. The GUS activity was measured 48 hours after DNA bombardment. Error bars represent the standard errors of the means for three independent biological replicates with six technical replicates each (n = 18). HopA1j from Pseudomonas syringae pv. syringae 61 was used as positive control and un-infiltrated leaf tissue (Unshot) as a negative control. Tukey’s HSD indicates treatment groups which are significantly different at α ≤ 0.05 with different letters. (B) Leaf discs from A. arguta AA07_03 and A. chinensis var. chinensis ‘Hort16A’ plantlets were vacuum-infiltrated with P. fluorescens PF0-1 wild-type strain (Pfo(WT)) or P. fluorescens PF0-1 carrying an artificial type III secretion (Pfo(T3S)), carrying empty vector (EV), or a plasmid-borne type III secreted effector (hopAW1a, hopZ5a, avrRpm1a or hopF1c, or positive control hopA1j from P. syringae pv. syringae 61) inoculum at ~5 x 10⁸ cfu/mL. Electrical conductivity due to HR-associated ion leakage was measured at indicated times over 48 hours. The ion leakage curves are faceted by plant species and stacked for three independent runs of this experiment. Error bars represent the standard errors of the means calculated from the five pseudobiological replicates per experiment (n = 15). Leaf discs from A. arguta AA07_03 and A. chinensis var. chinensis ‘Hort16A’ plantlets were vacuum-infiltrated with Psa3 inoculum at ~5 x 10⁸ cfu/mL. Electrical conductivity due to HR-associated ion leakage was measured at selected time points over 48 hours. The ion leakage curves are faceted by plant species and stacked for three independent runs of this experiment. Error bars represent the standard errors of the means calculated from the five pseudobiological replicates per experiment (n = 15).
Fig 6
Fig 6. Pathogenicity assay of Psa3 V-13 multiple avirulence effector knockout strains demonstrates lack of increasing resistance-escape due to a cumulative loss of virulence.
Actinidia arguta AA07_03 and Actinidia chinensis var. chinensis ‘Hort16A’ kiwifruit plantlets were flood-inoculated at approximately 106 cfu/mL. Bacterial growth was quantified at 12 days post-inoculation using qPCR ΔCt analysis A and plate count quantification B. The experiment was conducted three times (biological replicates) with three batches of independently grown plants and data were stacked to generate the box plots and bar graphs shown. Asterisks indicate significant differences from ANOVA followed by a post hoc Student’s t-test between the indicated strain and wild-type Psa3 V-13, where p ≤005 (*), p≤.001 (***), p≤.0001 (****), and p>.05 (ns; not significant). (A) Box and whisker plots, with black bars representing the median values, whiskers representing the 1.5 inter-quartile range, and black dots indicating outliers. (B) Bar height represents the mean number of Log10 cfu/cm2 and error bars represents the standard error of the mean (SEM) between four pseudobiological replicates.
Fig 7
Fig 7. Pathogenicity assay of Pseudomonas syringae pv. actinidiae (Psa) biovars in Actinidia arguta indicates broad recognition across biovars.
(A) Effectors of interest across strains representative of the Psa biovars. Selected effector repertoires collated from McCann et al. [15] and Sawada et al. [69]. Black indicates when an effector is present; grey indicates when an effector is either truncated, disrupted or incomplete; and white indicates when an effector is absent from a given strain. (B) A. arguta AA07_03 and A. chinensis var. chinensis ‘Hort16A’ kiwifruit plantlets were flood-inoculated at approximately 106 cfu/mL with Psa1 J-35, Psa2 K-28, Psa3 V-13, Psa5 MAFF212057, and Psa6 MAFF212134 strains. Bacterial growth was quantified at 12 days post-inoculation using plate count quantification. The experiment was conducted three times (biological replicates) with three batches of independently grown plants and data were stacked to generate the box plots and bar graphs shown. Asterisks indicate significant differences from ANOVA followed by a post hoc Student’s t-test between the indicated strain and wild-type Psa3 V-13, where p≤.05 (*), p≤.01 (**), p≤.001 (***), p≤.0001 (****), and p>.05 (ns; not significant). Bar height represents the mean number of Log10 cfu/cm2 and error bars represents the standard error of the mean (SEM) between four pseudobiological replicates.

References

    1. Bull CT, De Boer S, Denny T, Firrao G, Saux MF-L, Saddler G, et al.. Comprehensive list of names of plant pathogenic bacteria, 1980–2007. J Plant Pathol. 2010:551–92.
    1. Morris CE, Lamichhane JR, Nikolić I, Stanković S, Moury B. The overlapping continuum of host range among strains in the Pseudomonas syringae complex. Phytopathology Research. 2019;1(1):4.
    1. Xin X-F, Kvitko B, He SY. Pseudomonas syringae: what it takes to be a pathogen. Nature Reviews Microbiology. 2018;16(5):316. doi: 10.1038/nrmicro.2018.17 - DOI - PMC - PubMed
    1. Serizawa S, Ichikawa T, Takikawa Y, Tsuyumu S, Goto M. Occurrence of bacterial canker of kiwifruit in Japan. Japanese Journal of Phytopathology. 1989;55(4):427–36.
    1. Takikawa Y, Serizawa S, Ichikawa T, Tsuyumu S, Goto M. Pseudomonas syringae pv. actinidiae pv. nov. the causal bacterium of canker of kiwifruit in Japan. Japanese Journal of Phytopathology. 1989;55(4):437–44.

Publication types