. 2022 May 27;8(21):eabo5083.
doi: 10.1126/sciadv.abo5083. Epub 2022 May 27.

The mechanisms of catalysis and ligand binding for the SARS-CoV-2 NSP3 macrodomain from neutron and x-ray diffraction at room temperature

Affiliations

The mechanisms of catalysis and ligand binding for the SARS-CoV-2 NSP3 macrodomain from neutron and x-ray diffraction at room temperature

Galen J Correy et al. Sci Adv. .

Abstract

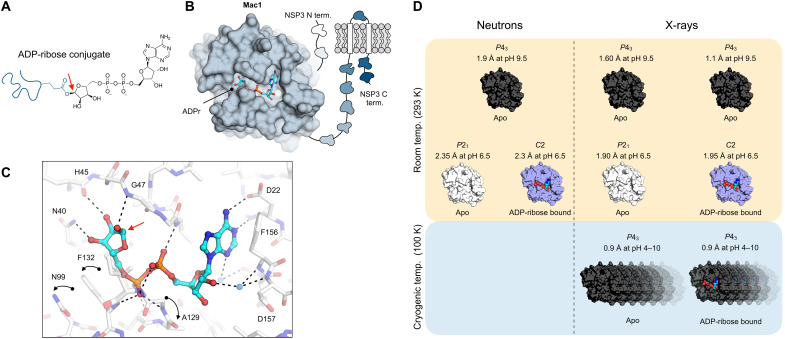
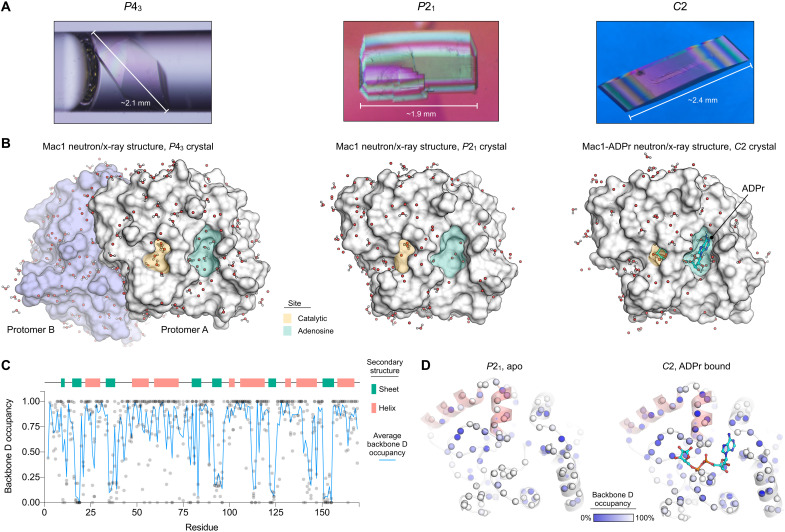
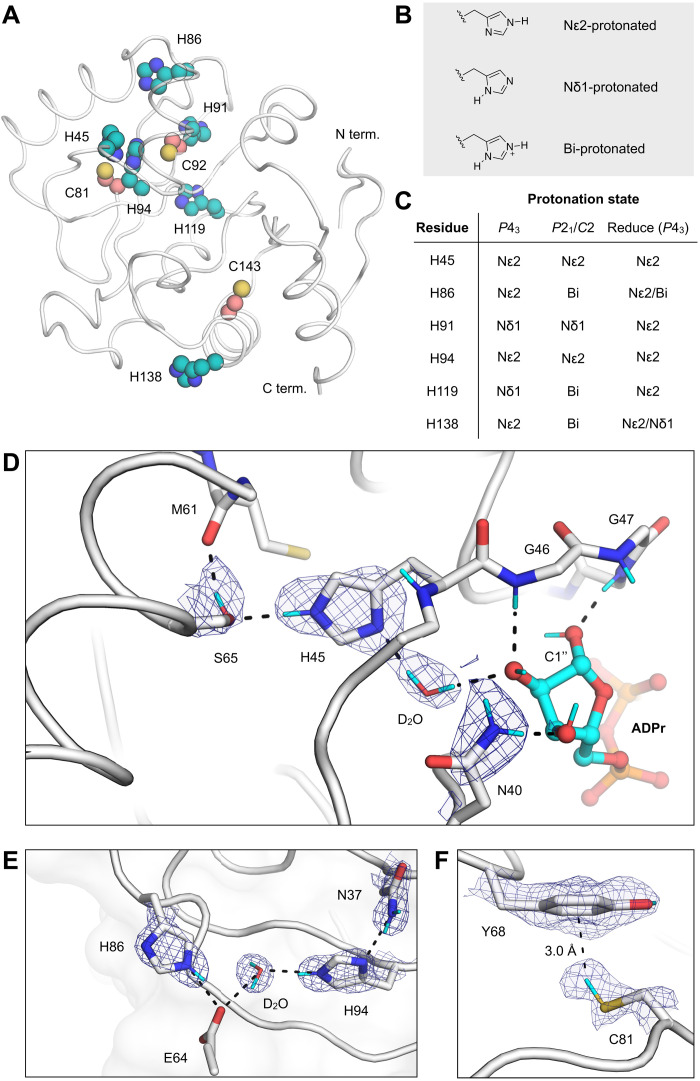
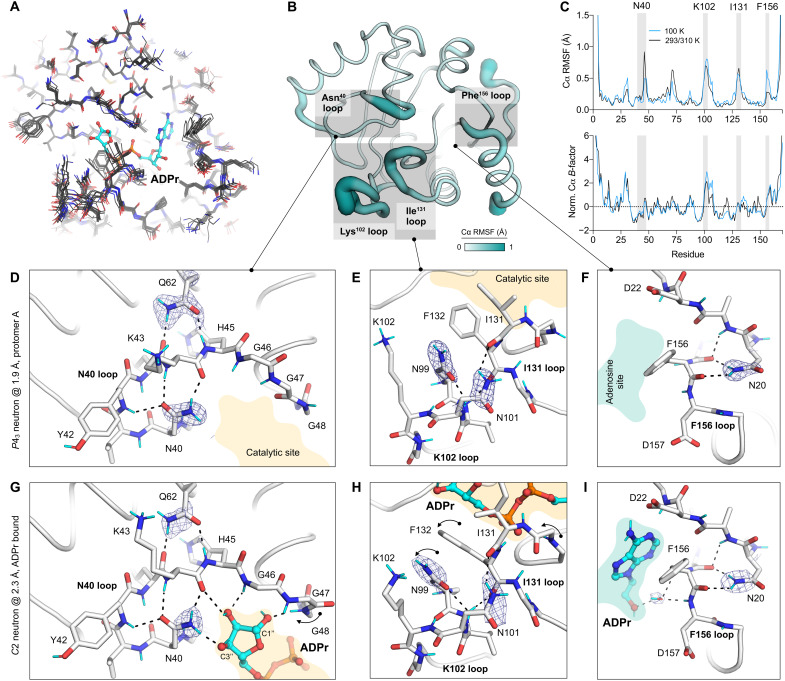
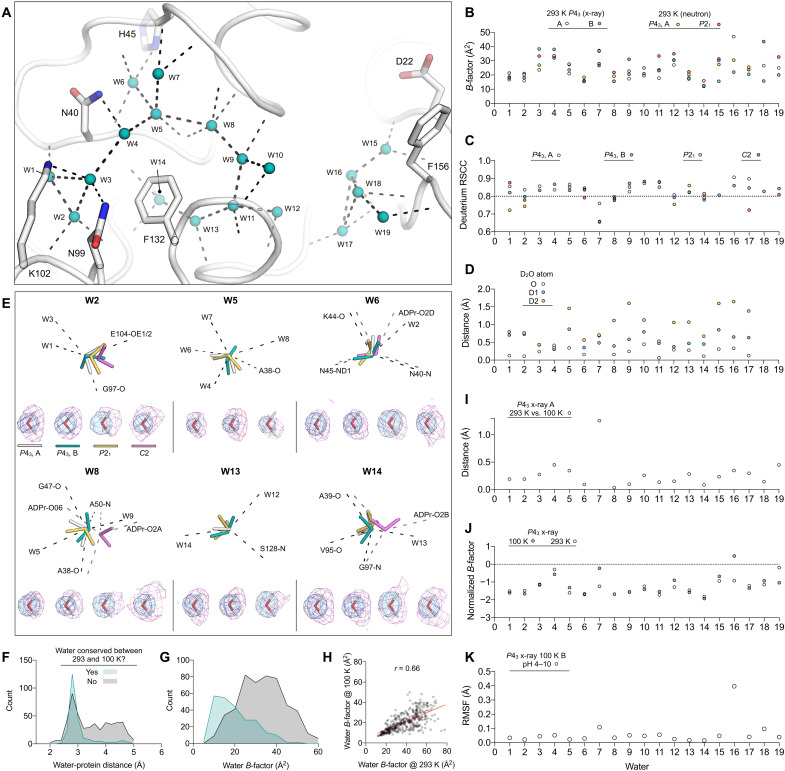
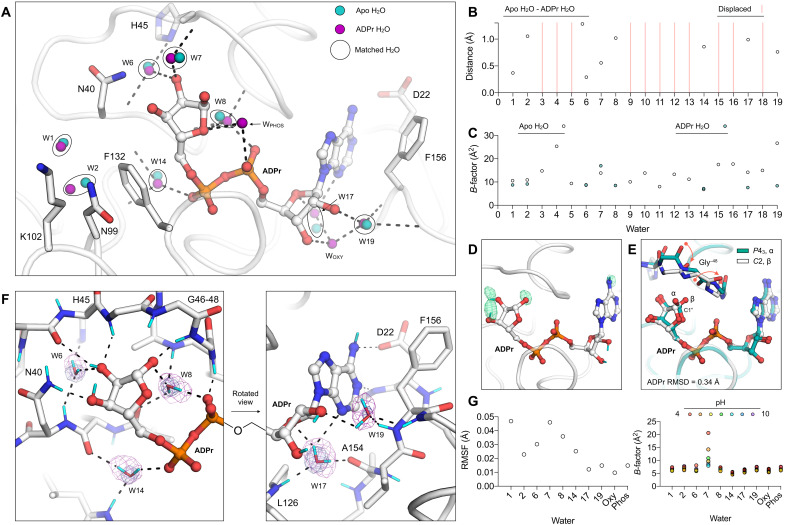
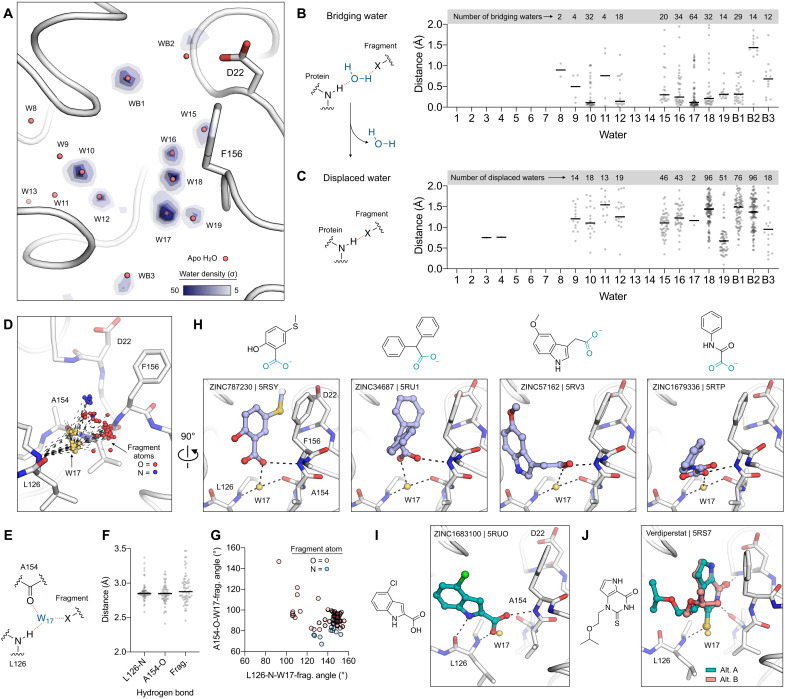
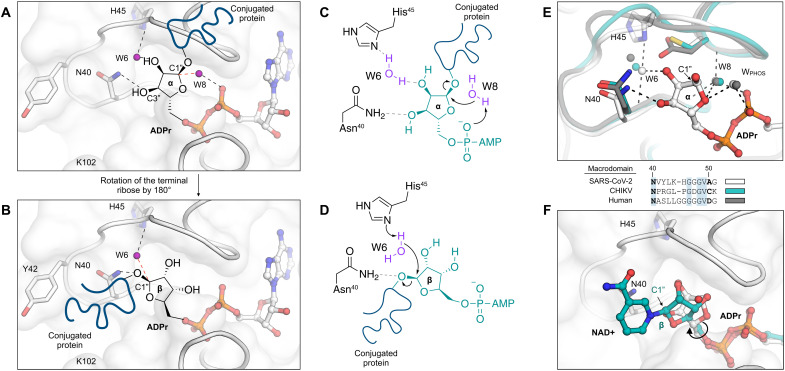
The nonstructural protein 3 (NSP3) macrodomain of severe acute respiratory syndrome coronavirus 2 (SARS-CoV-2) (Mac1) removes adenosine diphosphate (ADP) ribosylation posttranslational modifications, playing a key role in the immune evasion capabilities of the virus responsible for the coronavirus disease 2019 pandemic. Here, we determined neutron and x-ray crystal structures of the SARS-CoV-2 NSP3 macrodomain using multiple crystal forms, temperatures, and pHs, across the apo and ADP-ribose-bound states. We characterize extensive solvation in the Mac1 active site and visualize how water networks reorganize upon binding of ADP-ribose and non-native ligands, inspiring strategies for displacing waters to increase the potency of Mac1 inhibitors. Determining the precise orientations of active site water molecules and the protonation states of key catalytic site residues by neutron crystallography suggests a catalytic mechanism for coronavirus macrodomains distinct from the substrate-assisted mechanism proposed for human MacroD2. These data provoke a reevaluation of macrodomain catalytic mechanisms and will guide the optimization of Mac1 inhibitors.


Figures

Fig. 1.
Fig. 1.. The NSP3 macrodomain (Mac1) reverses mono-ADP ribosylation.
(A) Chemical structure of ADPr conjugated to a glutamate residue. The C1″ covalent attachment point is shown with a red arrow. (B) Cartoon of the multidomain NSP3 showing Mac1 with ADPr bound in the active site (PDB code 7KQP). (C) Structure of ADPr bound in the macrodomain active site (PDB code 7KQP) with the changes in protein structure upon ADPr binding indicated with black arrows. The C1″ covalent attachment point is shown with a red arrow. (D) Summary of the crystal structures reported in this work.
Fig. 2.
Fig. 2.. Crystal structures of Mac1 determined using neutron diffraction.
(A) Neutron-quality Mac1 crystals grown in the P43, P21, and C2 space groups. The P43 crystal is shown in the quartz capillary used for data collection, while the P21 and C2 crystals are shown before mounting. (B) Molecular surface showing Mac1 neutron structures. D2O molecules within 5 Å of the protein surface are shown with sticks/spheres. The adenosine and catalytic sites are shaded green and yellow, respectively. (C) Plot showing the occupancy of backbone amide deuterium atoms in the three Mac1 crystal structures. (D) Backbone amide deuterium occupancy mapped onto the P21 and C2 Mac1 structures. Backbone nitrogens are shown with blue spheres, colored by backbone D occupancy. The helices composed of residues 50 to 70 are shaded red. The average backbone D occupancy for these helices was 82% in the P21 structure and 52% in the C2 structure.
Fig. 3.
Fig. 3.. Protonation states of Mac1 residues assigned by neutron diffraction.
(A) The location of histidine (teal spheres) and cysteine (salmon spheres) residues mapped onto the Mac1 structure (PDB code 7KQO). (B) Chemical structures showing the three possible protonation states of histidine. (C) Histidine protonation states assigned on the basis of NSL density maps (maps are shown in fig. S5). The protonation states assigned to the high-resolution P43 x-ray structure (PDB code 7KQO) by the program Reduce are also shown. (D) NSL density maps reveal the hydrogen bond network connecting His45 and ADPr in the C2 structure (PDB code 7TX5). The protein is shown with a white cartoon/stick representation, and the 2mFO − DFC NSL density map is shown with a blue mesh (contoured at 2.5 σ). (E) An extensive hydrogen bond network connects the Asn37 side chain with a surface histidine (His86). The P43 structure (protomer A, PDB code 7TX3) and the corresponding 2mFO − DFC NSL density map are shown with a blue mesh (contoured at 2.5 σ). (F) An aromatic-thiol bond was observed between Tyr68 and Cys81 in protomer A of the P43 structure (PDB code 7TX3). The 2mFO − DFC NSL density map is shown with a blue mesh (contoured at 1 σ).
Fig. 4.
Fig. 4.. Protein flexibility and hydrogen bond networks in the Mac1 active site.
(A) Alignment of P43, P21, and C2 Mac1 neutron and x-ray crystal structures determined at 100/293/310 K (PDB codes 7KQO, 7KQP, 7KR0, 7KR1, 7TWH, 7TX3, 7TX4, and 7TX5). (B) Cα RMSF calculated from structures shown in (A) mapped onto the Mac1 structure. (C) Top: Plot showing Cα RMSF of Mac1 structures determined at 100 K (blue line) and those at 293/310 K (black line). Bottom: Plot showing Cα B-factors from the Mac1 structure. B-factors were normalized by Z score as described in Materials and Methods. (D to F) Active site hydrogen bond networks assigned on the basis of NSL density maps for the P43 neutron structure (protomer A, PDB code 7TX3). The protein is shown with a white stick/cartoon representation, and the 2mFO − DFC NSL density map is shown with a blue mesh (contoured at 2 σ around the asparagine/glutamine side chains). Hydrogen bonds (<3.5 Å) are shown with dashed black lines. (G to I) Same as (D) to (F) but showing the hydrogen bond networks in the C2 ADPr cocrystal structure (PDB code 7TX5). The NSL density maps are shown with a blue mesh [contoured at 3, 2, and 2.5 σ in (G) to (I)].
Fig. 5.
Fig. 5.. Mac1 active site water networks are robust to changes in crystal packing, temperature, and pH.
(A) Active site water networks in the 293 K x-ray structure (PDB code 7TWH). Waters are shown as teal spheres, and hydrogen bonds are shown with dashed black lines. (B) B-factors for active site H2O/D2O molecules, numbered according to (A). (C) Average deuterium RSCC of active site D2O molecules calculated using 2mFO − DFC NSL density maps. An RSCC value of 0.8 has previously been used to assess whether a D2O is correctly oriented (37). (D) Variation in D2O orientation across 100 rounds of refinement. The distance between the average deuterium position across the two P43 protomers is plotted along with the distance between D2O oxygen atoms. (E) Selected D2O molecules showing the 2mFO − DFC NSL density map (purple mesh contoured at 2 σ) and the 2mFO − DFC electron density map (blue mesh, 2 σ). Pink dashed lines show ADPr-specific hydrogen bonds. (F) Histogram showing water-protein distances in the 100 K P43 x-ray structure (PDB code 7KQO). Waters were classified as conserved if a matching water molecule was found within 0.5 Å in the 293 K P43 structure (PDB code 7TWH) (histogram bin width = 0.2 Å). (G) Same as (F) but showing water B-factors (histogram bin width = 5 Å2). (H) Scatterplot showing correlation between water B-factors at 100 and 293 K. (I) Distances between H2O oxygen atoms in protomer A of the P43 x-ray structures determined at 293 and 100 K (PDB codes 7TWH/7KQO). (J) Normalized B-factors of active site H2O molecules in the P43 x-ray structures determined at 293 and 100 K. (K) RMSF values of water molecules calculated across the seven structures determined from pH 4 to 10.
Fig. 6.
Fig. 6.. Reorganization of water networks upon ADPr binding.
(A) Active site water positions from the structure of ADPr-bound Mac1 determined at 100 K (P43 crystal, PDB code 7KQP) compared to the apo structure (PDB code 7KQO). For clarity, only selected side chains of the ADPr-bound structure are shown (white sticks). Hydrogen bonds are shown as dashed black lines. (B) Plot showing distances between the water molecules shown in (A). (C) Plot showing the B-factors for waters shown in (A). (D) Evidence for HDX in ADPr cocrystallized with Mac1 (C2, PDB code 7TX5). The mFO − DFC NSL density map calculated after joint neutron/x-ray refinement but before adding deuterium atoms to ADPr is shown with a green mesh (contoured at +3 σ). No density was observed for the C2′ and C3′ hydroxyl deuteriums. (E) Alignment of the ADPr-bound Mac1 structures determined using P43 and C2 crystals. The two epimers of the terminal ribose are marked (α and β), and the conformational change required to bind the α epimer in the C2 crystal is shown with red arrows. (F) Hydrogen bond networks in the ADPr-bound Mac1 structure determined using neutron diffraction (C2, PDB code 7TX5). The 2mFO − DFC NSL density map is shown for bridging water molecules with a purple mesh (contoured at 2.5 σ for W6, W8, W14, and W17 and at 2 σ for W19). The 2mFO − DFC electron density map is contoured at 2 σ (blue mesh). Deuterium atoms are colored cyan, and hydrogen bonds are shown with dashed black lines. (G) Left: Plot showing the RMSF of active site water molecules calculated across the seven ADPr-bound structures determined from pH 4 to 10. Right: B-factors for water molecules in the ADPr-bound structures from pH 4 to 10.
Fig. 7.
Fig. 7.. Water networks mediate fragment binding in the adenosine site of Mac1.
(A) Structure of Mac1 showing the density of fragment-protein bridging water molecules, calculated using the 232 previously reported fragment structures (10). The P43 100 K structure (PDB code 7KQO) is shown with a white stick/cartoon representation. Water density was calculated with the GROmaρs tool (44) and is contoured from 5 to 50 σ. (B) Left: Chemical structure showing an example of a bridging water molecule. Right: Distances from bridging waters to apo waters calculated for all fragment structures. (C) Left: Chemical structure showing an example of water displacement. Right: The minimum fragment-water molecule for each fragment structure. (D) W17 acts as a bridge to 64 fragments binding in the adenosine site. The Mac1 structure (PDB code 7KQO) is shown, and W17 from the 64 fragments is shown with yellow spheres. The hydrogen bonds to Leu126 and Ala154 are shown with black dashed lines, and the fragment atoms are shown with spheres colored by atom type. (E to G) The W17-Leu126/Ala154 hydrogen bonds are conserved across the 64 bridging fragments, whereas the W17-fragment bonds are variable, based on distance (F) and angle (G). (H) W17 mediates diverse interactions with carboxylic acid–containing fragments and the oxyanion subsite. The fragments are shown with blue sticks. (I and J) W17 is displaced by 2 of the 178 fragments binding in the adenosine site. Two conformations of verdiperstat were observed.
Fig. 8.
Fig. 8.. Mechanism of ADPr-ribose hydrolysis catalyzed by the SARS-CoV-2 NSP3 macrodomain.
(A) Composite image showing the ADPr-bound Mac1 structure (white sticks/cartoon/surface, PDB 7KQP). ADPr is shown in the conformation that is compatible with a substrate-assisted mechanism. The terminal ribose adopts the α epimer, and W8 acts as the water nucleophile. For clarity, only the side chains of selected residues are shown. Hydrogen bonds are shown with dashed black lines, and the W6-C1″ trajectory is shown with a dashed red line. (B) Same as (A) but showing the β epimer of the terminal ribose that is compatible with His45 acting as a general base to activate W6 as a nucleophile. (C and D) Chemical structures showing the two possible mechanisms for ADPr hydrolysis. (E) Top: Structural alignment of the SARS-CoV-2 macrodomain (PDB code 7KQP), Chikungunya virus macrodomain (PDB code 3GPO), and the human macrodomain hMacroD2 (PDB code 4IQY), all in complex with ADPr. Bottom: Protein sequence alignment of residues equivalent to residues 40 to 51 from the SARS-CoV-2 macrodomain. (F) X-ray crystal structure of the NSP3 macrodomain from the Tylonycteris bat coronavirus HKU4 in complex with NAD+ (PDB code 6MEB). The terminal ribose is rotated ~180° relative to ADPr. This configuration matches the model proposed in (B) and (D).

Update of

References

    1. Ivashkiv L. B., Donlin L. T., Regulation of type I interferon responses. Nat. Rev. Immunol. 14, 36–49 (2014). - PMC - PubMed
    1. Schoggins J. W., Interferon-stimulated genes: What do they all do? Annu Rev Virol. 6, 567–584 (2019). - PubMed
    1. Hoch N. C., Polo L. M., ADP-ribosylation: From molecular mechanisms to human disease. Genet. Mol. Biol. 43, e20190075 (2019). - PMC - PubMed
    1. Rack J. G. M., Palazzo L., Ahel I., (ADP-ribosyl)hydrolases: Structure, function, and biology. Genes Dev. 34, 263–284 (2020). - PMC - PubMed
    1. Russo L. C., Tomasin R., Matos I. A., Manucci A. C., Sowa S. T., Dale K., Caldecott K. W., Lehtiö L., Schechtman D., Meotti F. C., Bruni-Cardoso A., Hoch N. C., The SARS-CoV-2 Nsp3 macrodomain reverses PARP9/DTX3L-dependent ADP-ribosylation induced by interferon signaling. J. Biol. Chem. 297, 101041 (2021). - PMC - PubMed