

Redefining breast cancer subtypes to guide treatment prioritization and maximize response: Predictive biomarkers across 10 cancer therapies
- PMID: 35623341
- PMCID: PMC9426306
- DOI: 10.1016/j.ccell.2022.05.005
Redefining breast cancer subtypes to guide treatment prioritization and maximize response: Predictive biomarkers across 10 cancer therapies
Abstract
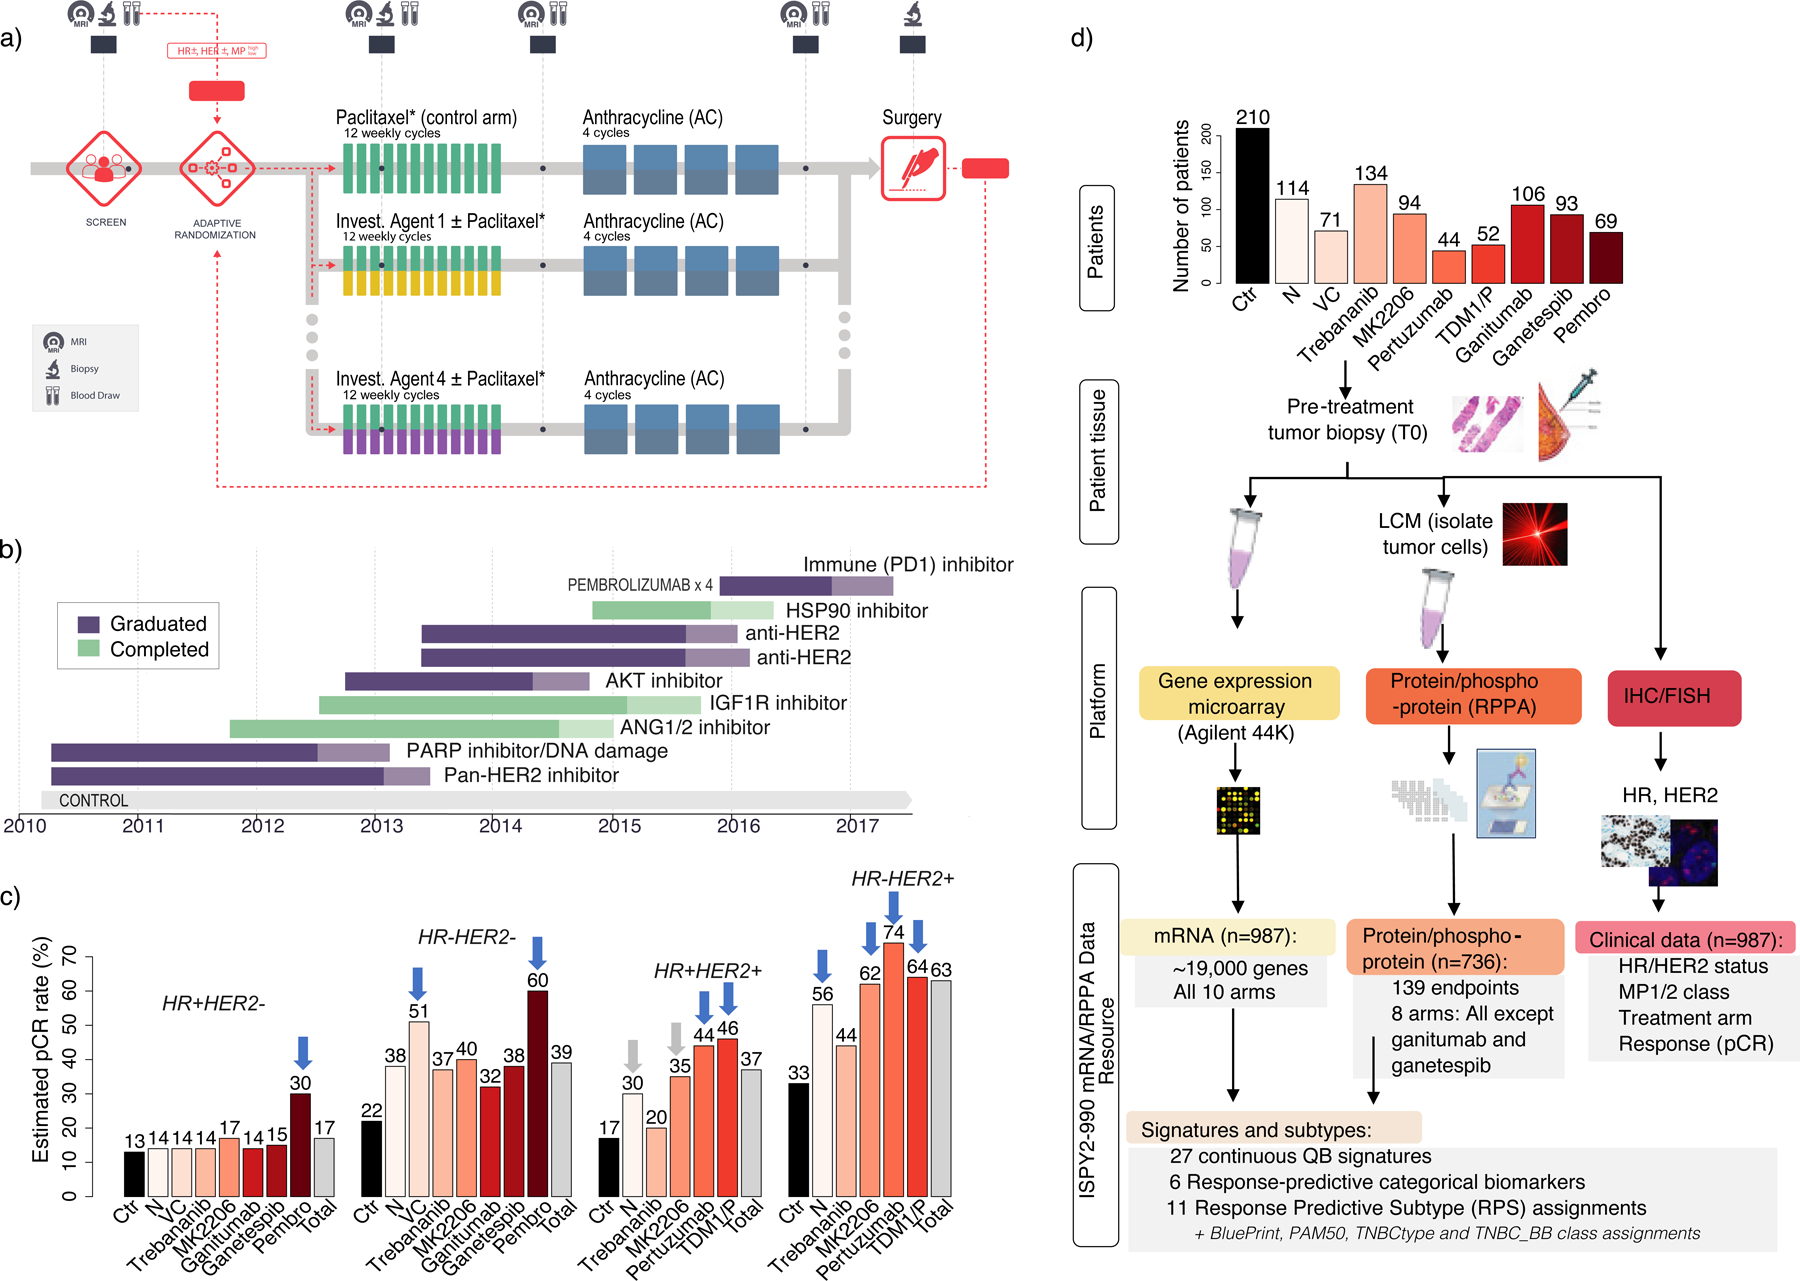
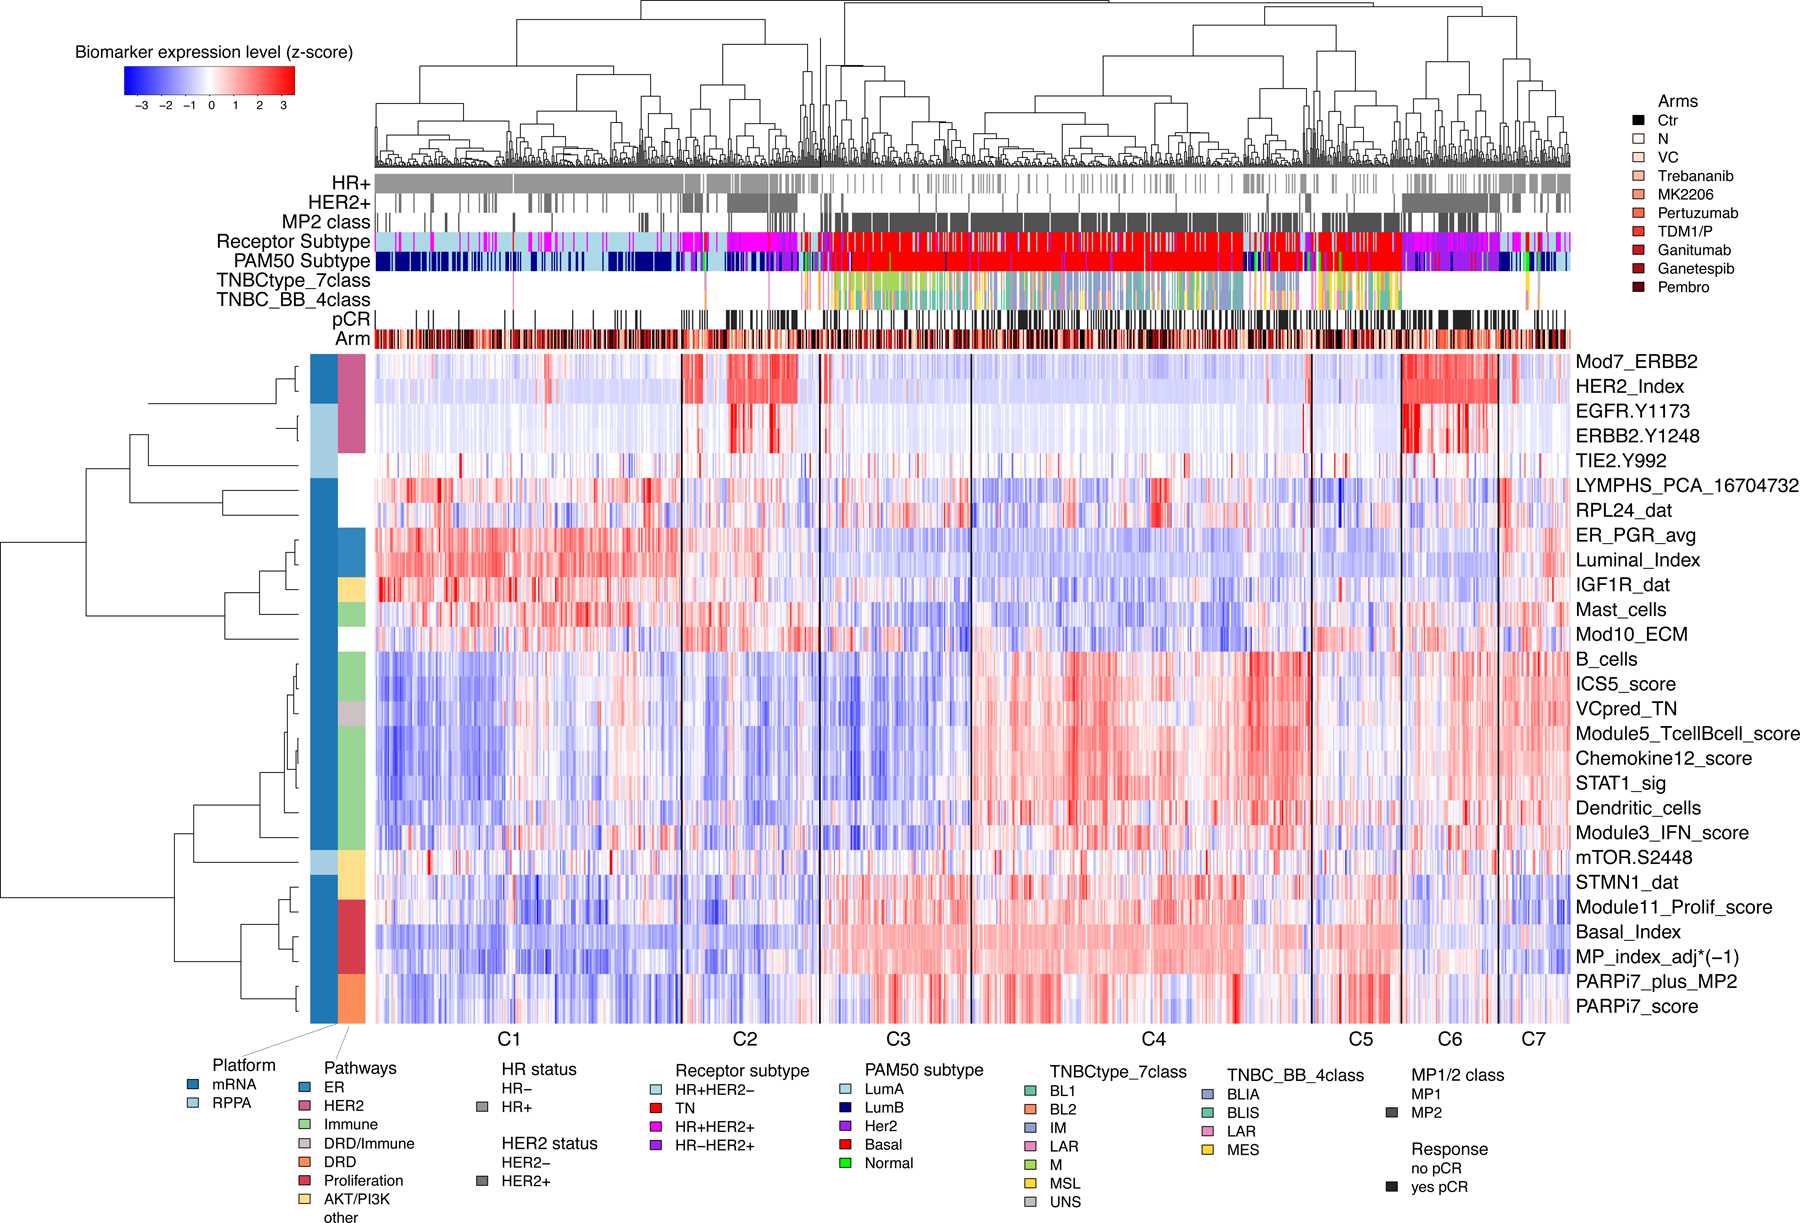
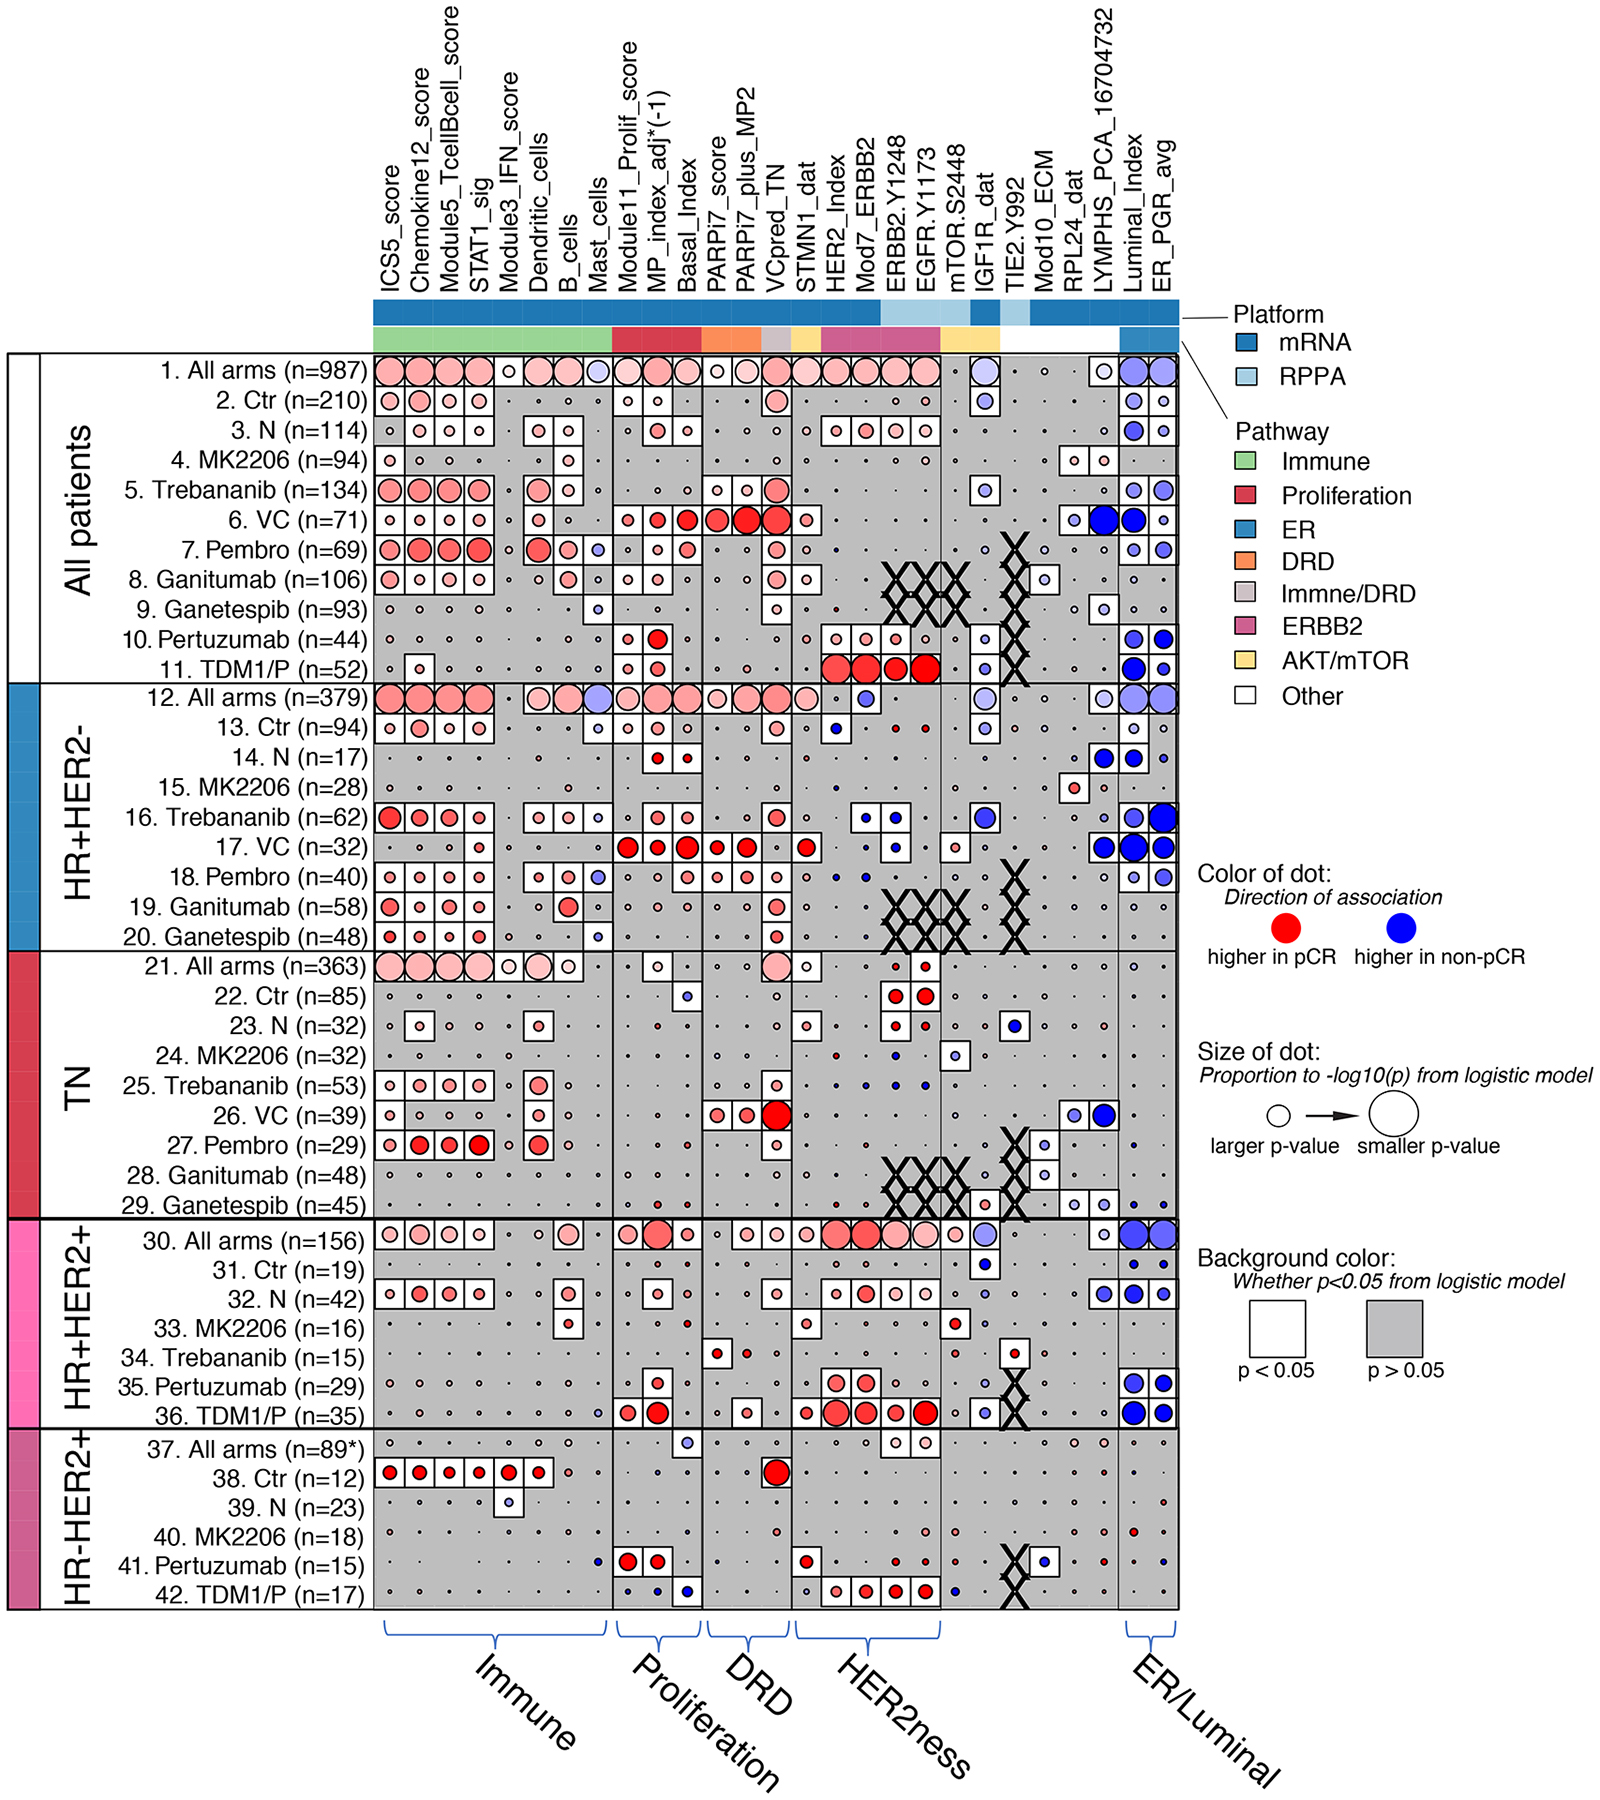
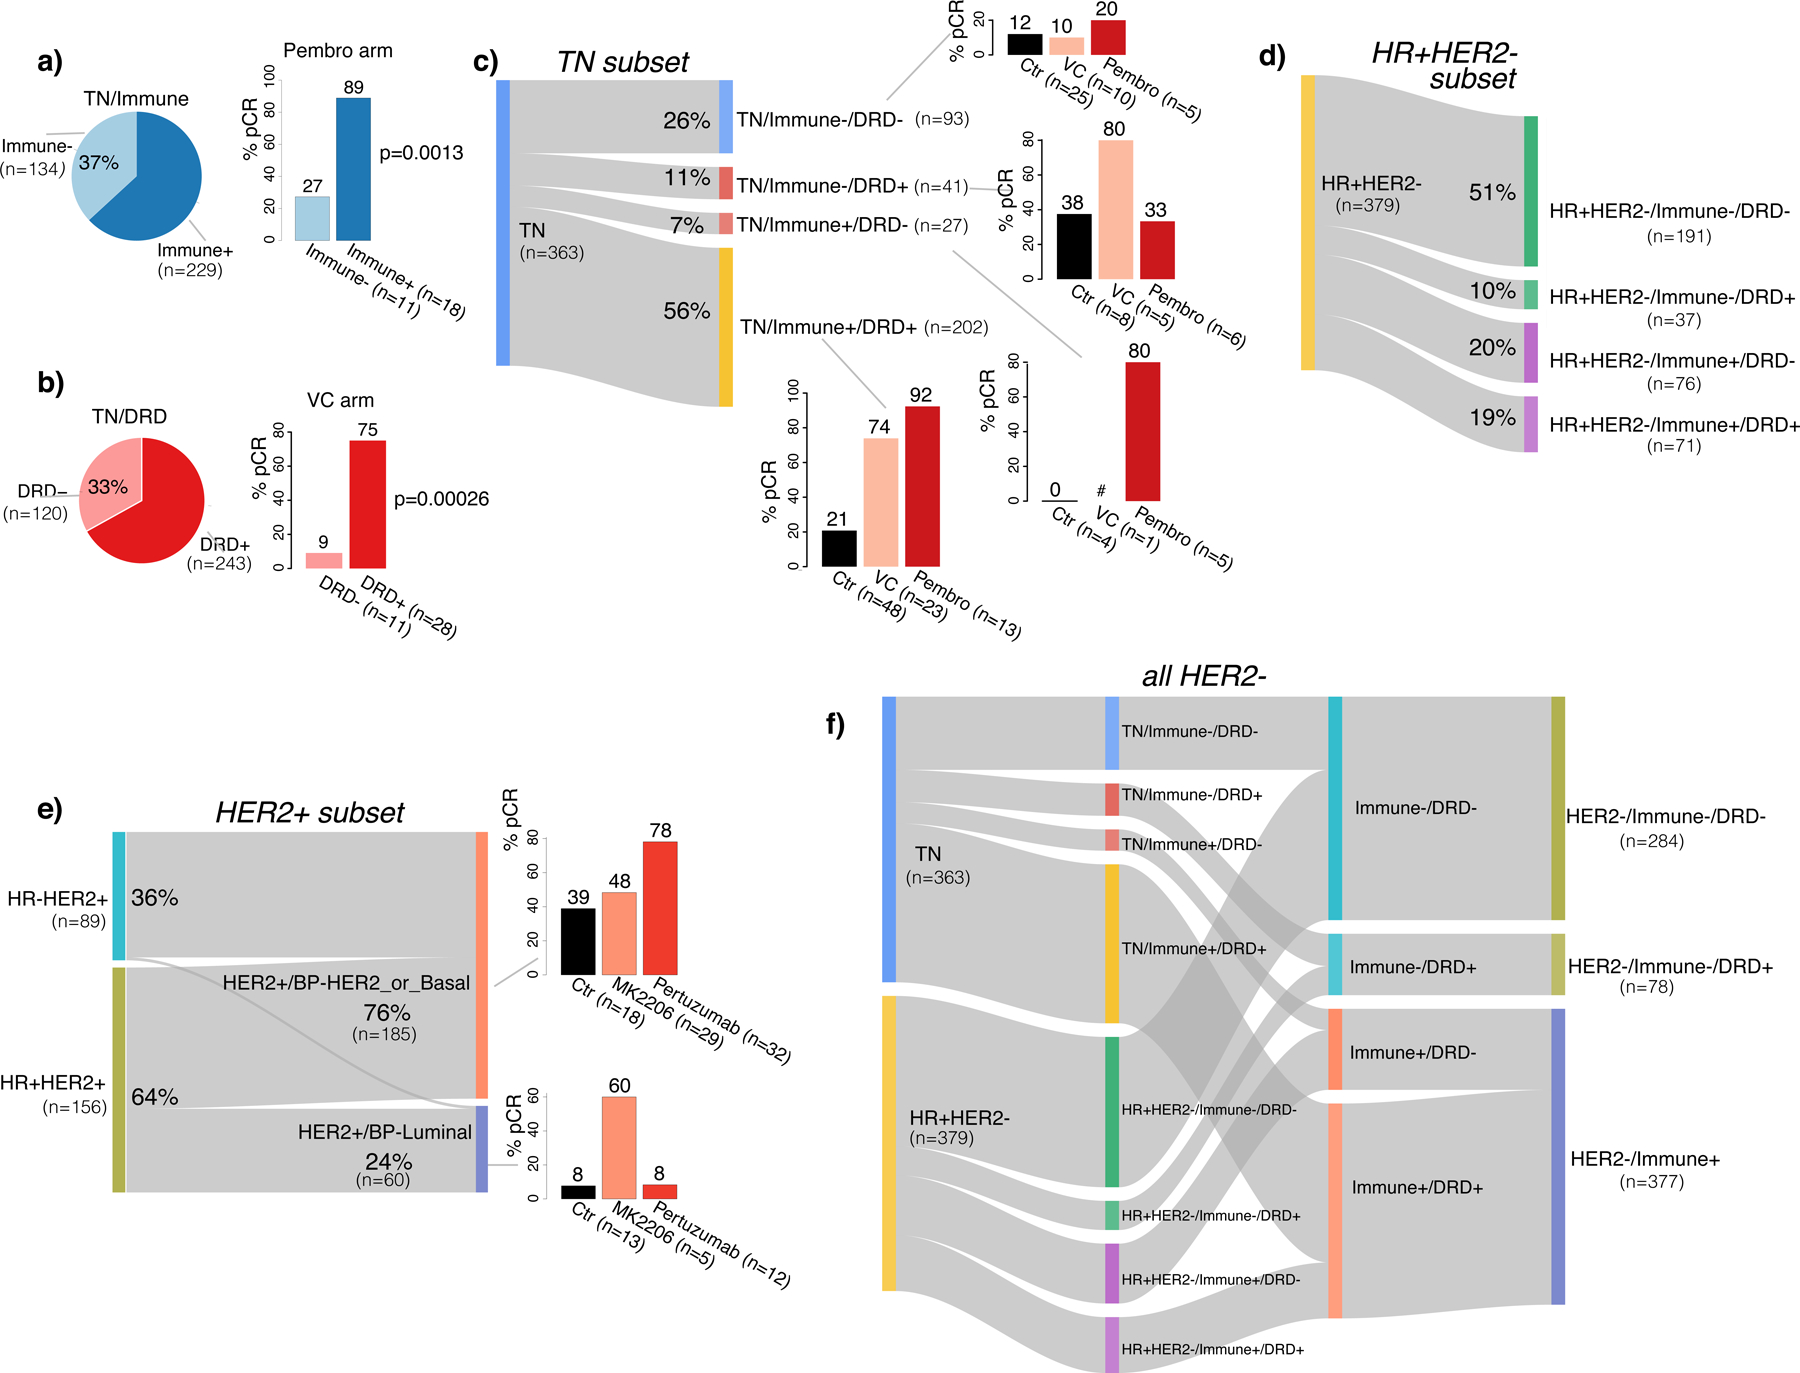
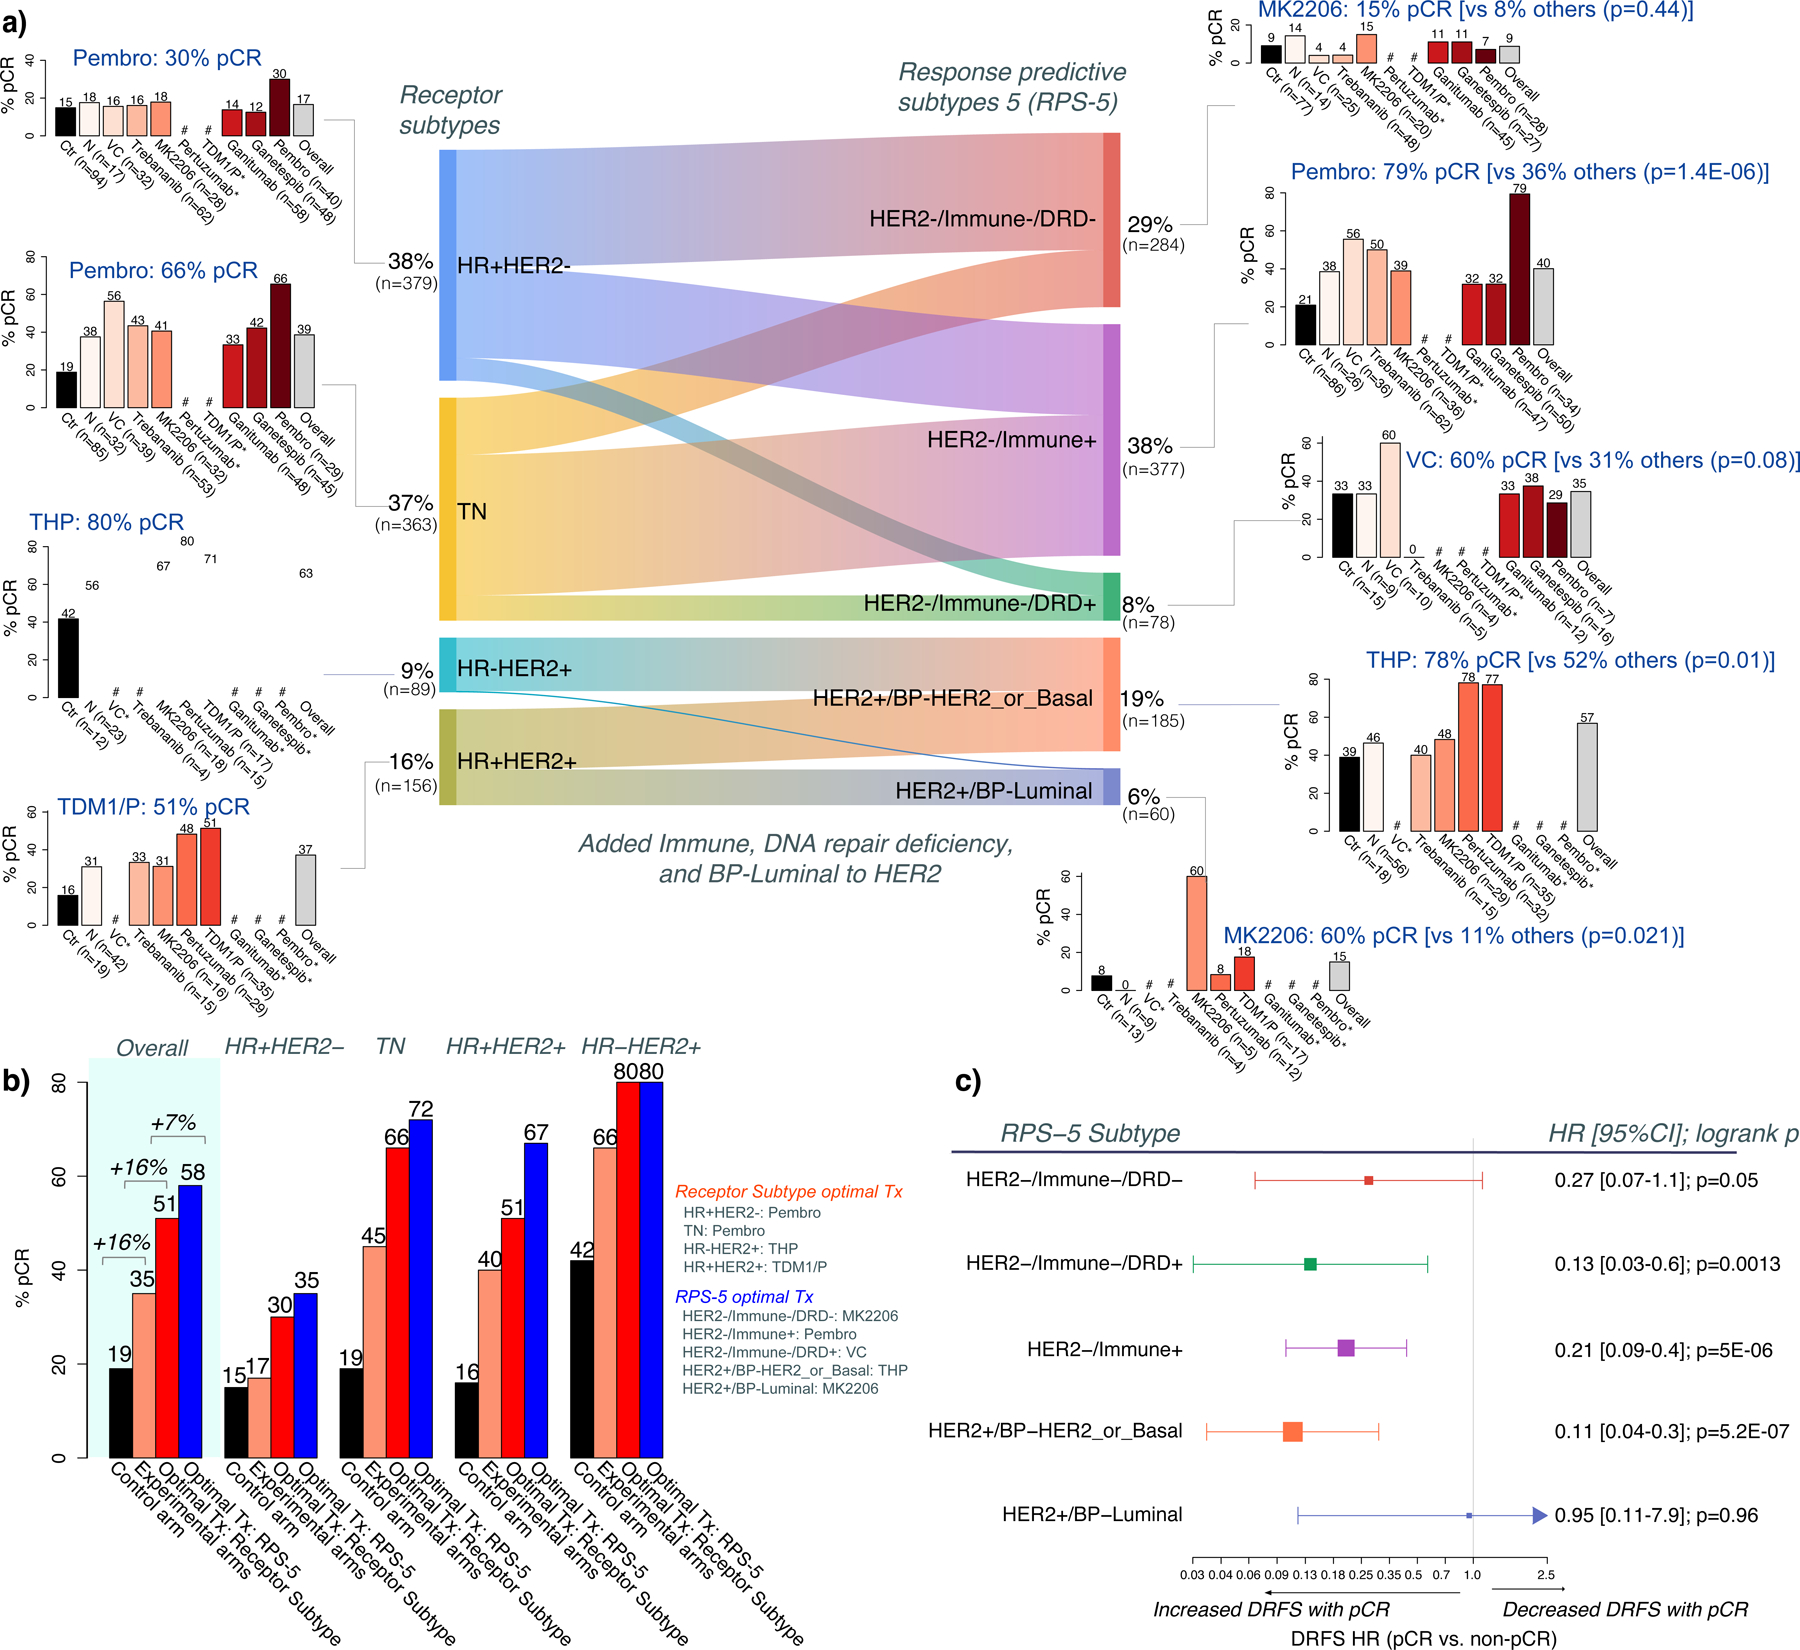
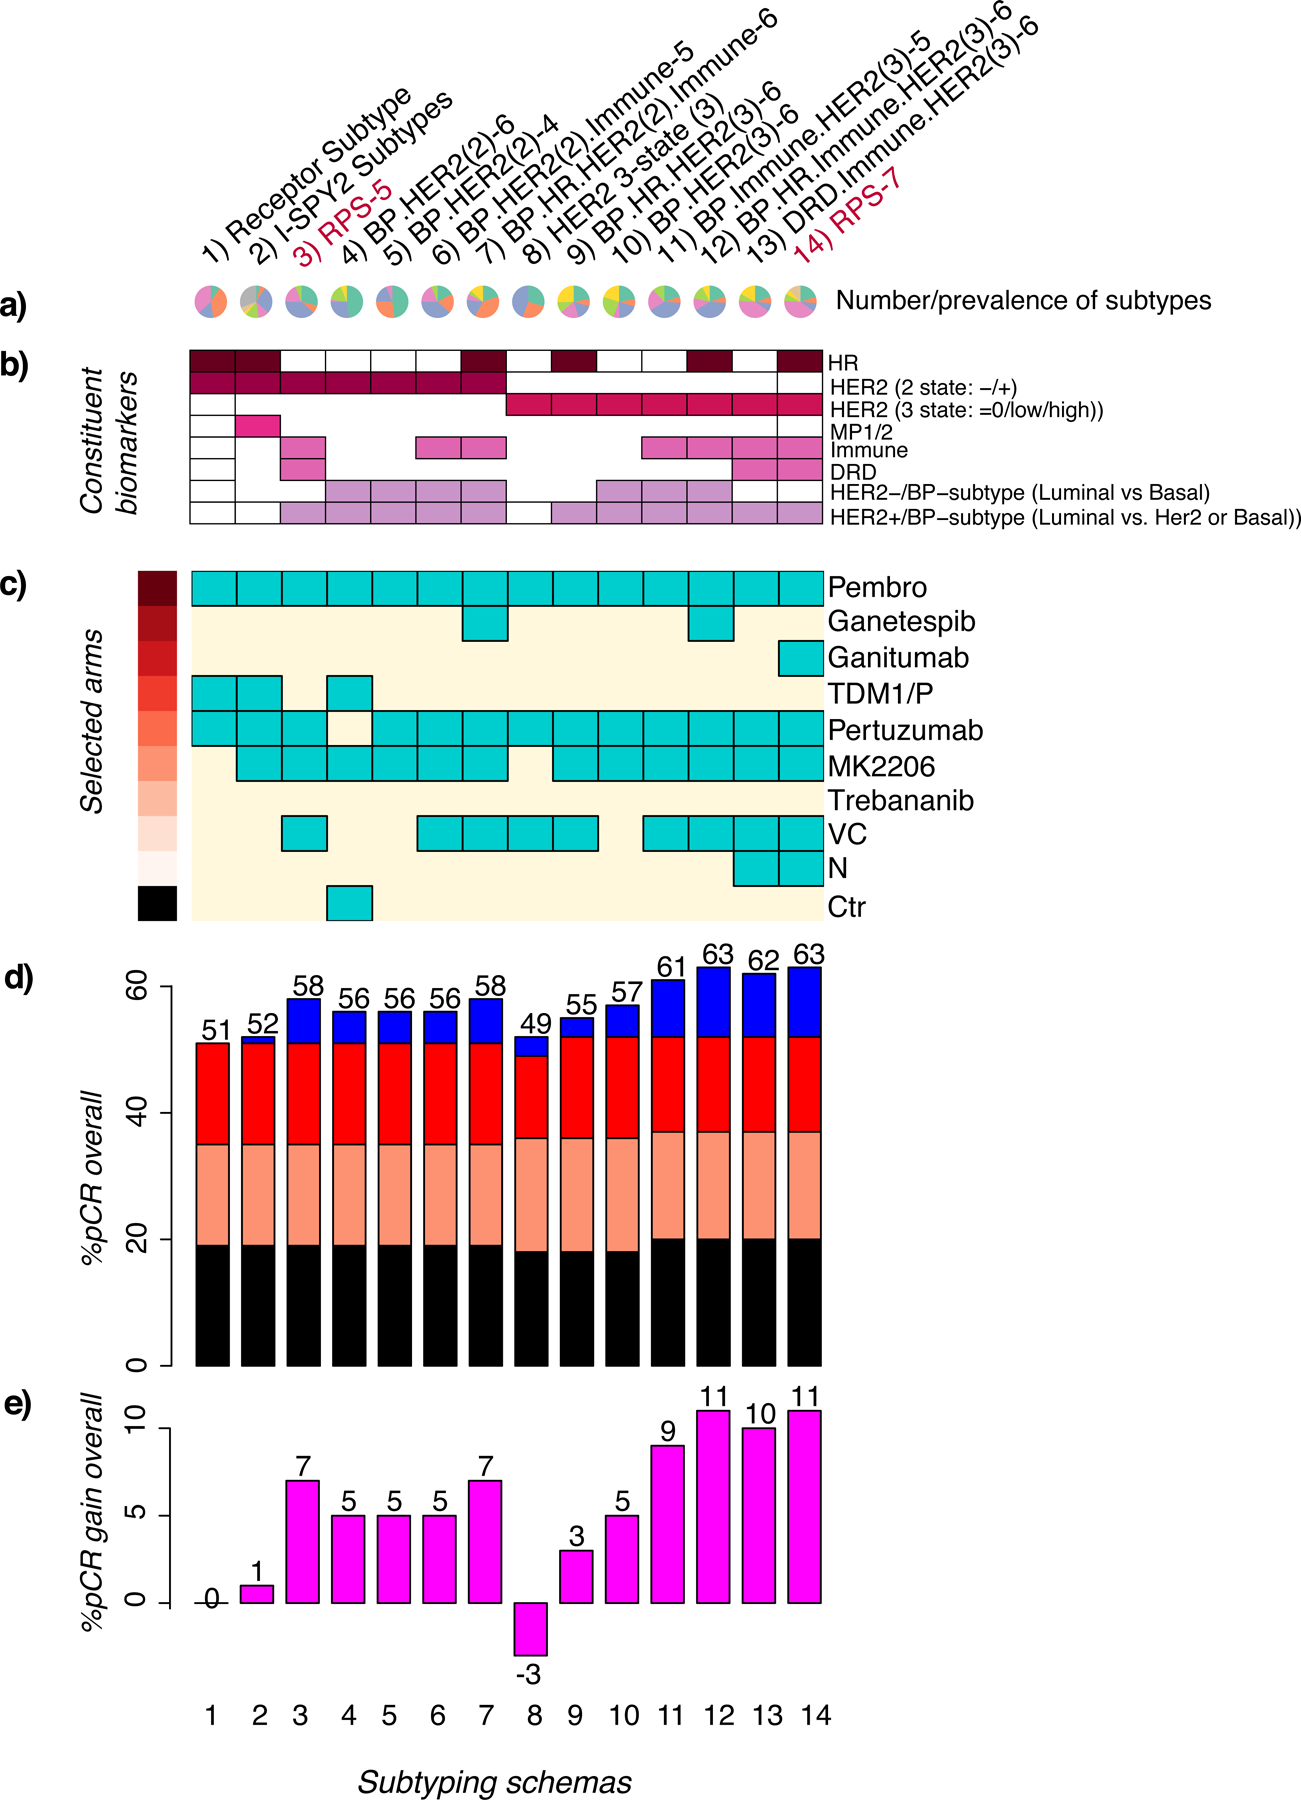
Using pre-treatment gene expression, protein/phosphoprotein, and clinical data from the I-SPY2 neoadjuvant platform trial (NCT01042379), we create alternative breast cancer subtypes incorporating tumor biology beyond clinical hormone receptor (HR) and human epidermal growth factor receptor-2 (HER2) status to better predict drug responses. We assess the predictive performance of mechanism-of-action biomarkers from ∼990 patients treated with 10 regimens targeting diverse biology. We explore >11 subtyping schemas and identify treatment-subtype pairs maximizing the pathologic complete response (pCR) rate over the population. The best performing schemas incorporate Immune, DNA repair, and HER2/Luminal phenotypes. Subsequent treatment allocation increases the overall pCR rate to 63% from 51% using HR/HER2-based treatment selection. pCR gains from reclassification and improved patient selection are highest in HR+ subsets (>15%). As new treatments are introduced, the subtyping schema determines the minimum response needed to show efficacy. This data platform provides an unprecedented resource and supports the usage of response-based subtypes to guide future treatment prioritization.
Keywords: DNA repair; Immune; Luminal; breast cancer; clinical trial; immunotherapy; multiple arms; platinum; response prediction; subtyping.
Copyright © 2022 The Authors. Published by Elsevier Inc. All rights reserved.
Conflict of interest statement
Declaration of interests C.Y. consulted for NantOmics LLC. J.W. reports honoraria from DAVA Oncology; consults for Baylor College of Medicine; has ownership in Theralink; and is co-inventor of the RPPA technology, and phospho-HER2 and -EGFR response predictors with filed patents. M.C.L. reports support from Eisai, Genentech, GRAIL, Menarini Silicon Biosystems, Merck, Novartis, Seattle Genetics, and Tesaro. P.P. reports leadership and stock in Immunonet BioSciences; honoraria from ASCO, Dava Oncology, OncLive (courses), and Frontiers (editorship); consulting for Personalized Cancer Therapy, Immunonet BioSciences, Sirtex, CARIS Lifesciences, OncoPlex Diagnostics, Pfizer, Heron, Puma, AbbVie, BOLT, and SEAGEN; and is an occasional speaker for Genentech and Roche. W.F.S. is a co-founder of Delphi Diagnostics; is a co-inventor/patent holder for a (free) residual cancer burden calculator; holds shares in IONIS Pharmaceuticals and Eiger Biopharmaceuticals; and is an unpaid advisor/steering committee for Roche trials. H.S.R. reports support from Pfizer, Merck, Novartis, Lilly, Genentech, Odonate, Daiichi, Seattle Genetics, Eisai, Macrogenics, Sermonix, Boehringer Ingelheim, Polyphor, AstraZeneca, and Immunomedics; and has received honoraria from Puma Biotechnology, Mylan, and Samsung. C.I. reports consulting for Seattle Genetics, Genentech, AstraZeneca, Novartis, PUMA, Pfizer, and Esai. A.M.D. reports honoraria or consulting for Pfizer and Context Therapeutics and reports support from Novartis, Pfizer, Genentech, Calithera, and Menarini. D.Y. reports unrelated support from Boehringer Ingleheim. D.A.B. is co-owner of Berry Consultants LLC, a company that designs adaptive clinical trials (including I-SPY2). L.P. reports consulting fees and honoraria from AstraZeneca, Merck, Novartis, Bristol-Myers Squibb, Genentech, Eisai, Pieris, Immunomedics, Seattle Genetics, Clovis, Syndax, H3Bio, and Daiichi. E.F.P. reports leadership, stock/ownership, consulting/advisory, and travel funds from Perthera and Ceres Nanosciences; stock and consulting/advisory for Avant Diagnostics; consulting/advisory for AZGen; support from Ceres Nanosciences, GlaxoSmithKline, AbbVie, Symphogen, and Genentech; patents/royalties from NIH; and filed patents for phospho-HER2 and -EGFR response predictors. L.J.E. is an unpaid member of the board of directors of Quantum Leap Healthcare Collaborative (QLHC) and has received grant support from QLHC for the I-SPY2 trial; is on the Blue Cross/Blue Shield Medical Advisory Panel and receives reimbursement for her time and travel; and received unrelated research support from Merck. L.J.v.V. is a co-inventor of the MammaPrint signature and a part-time employee and stockholder of Agendia NV.
Figures
Comment in
-
Response-based molecular subtyping-emergence of the third generation of breast cancer subtypes.Cancer Cell. 2022 Jun 13;40(6):592-594. doi: 10.1016/j.ccell.2022.05.012. Cancer Cell. 2022. PMID: 35700705
References
-
- Berry DA (2011). Adaptive clinical trials in oncology. Nature Reviews Clinical Oncology 9, 199–207. - PubMed
-
- Blenman KRM, Li X, Marczyk M, O’Meara T, Yaghoobi V, Gunasekharan V, Park T, Rimm D, and Pusztai L (2020). Abstract P3-09-05: Predictive markers of response to durvalumab concurrent with nab-paclitaxel and dose dense doxorubicin cyclophosphamide (ddAC) neoadjuvant therapy for triple negative breast cancer (TNBC). P3-09-05-P3-09-05.
-
- Brown FM (1990). Boolean reasoning : the logic of Boolean equations.
Publication types
MeSH terms
Substances
Associated data
Grants and funding
LinkOut - more resources
Full Text Sources
Other Literature Sources
Medical
Molecular Biology Databases
Research Materials
Miscellaneous
