. 2022 Jun 13;40(6):624-638.e9.
doi: 10.1016/j.ccell.2022.05.004. Epub 2022 May 26.

Spatiotemporal co-dependency between macrophages and exhausted CD8+ T cells in cancer

Affiliations

Spatiotemporal co-dependency between macrophages and exhausted CD8+ T cells in cancer

Kelly Kersten et al. Cancer Cell. .

Abstract

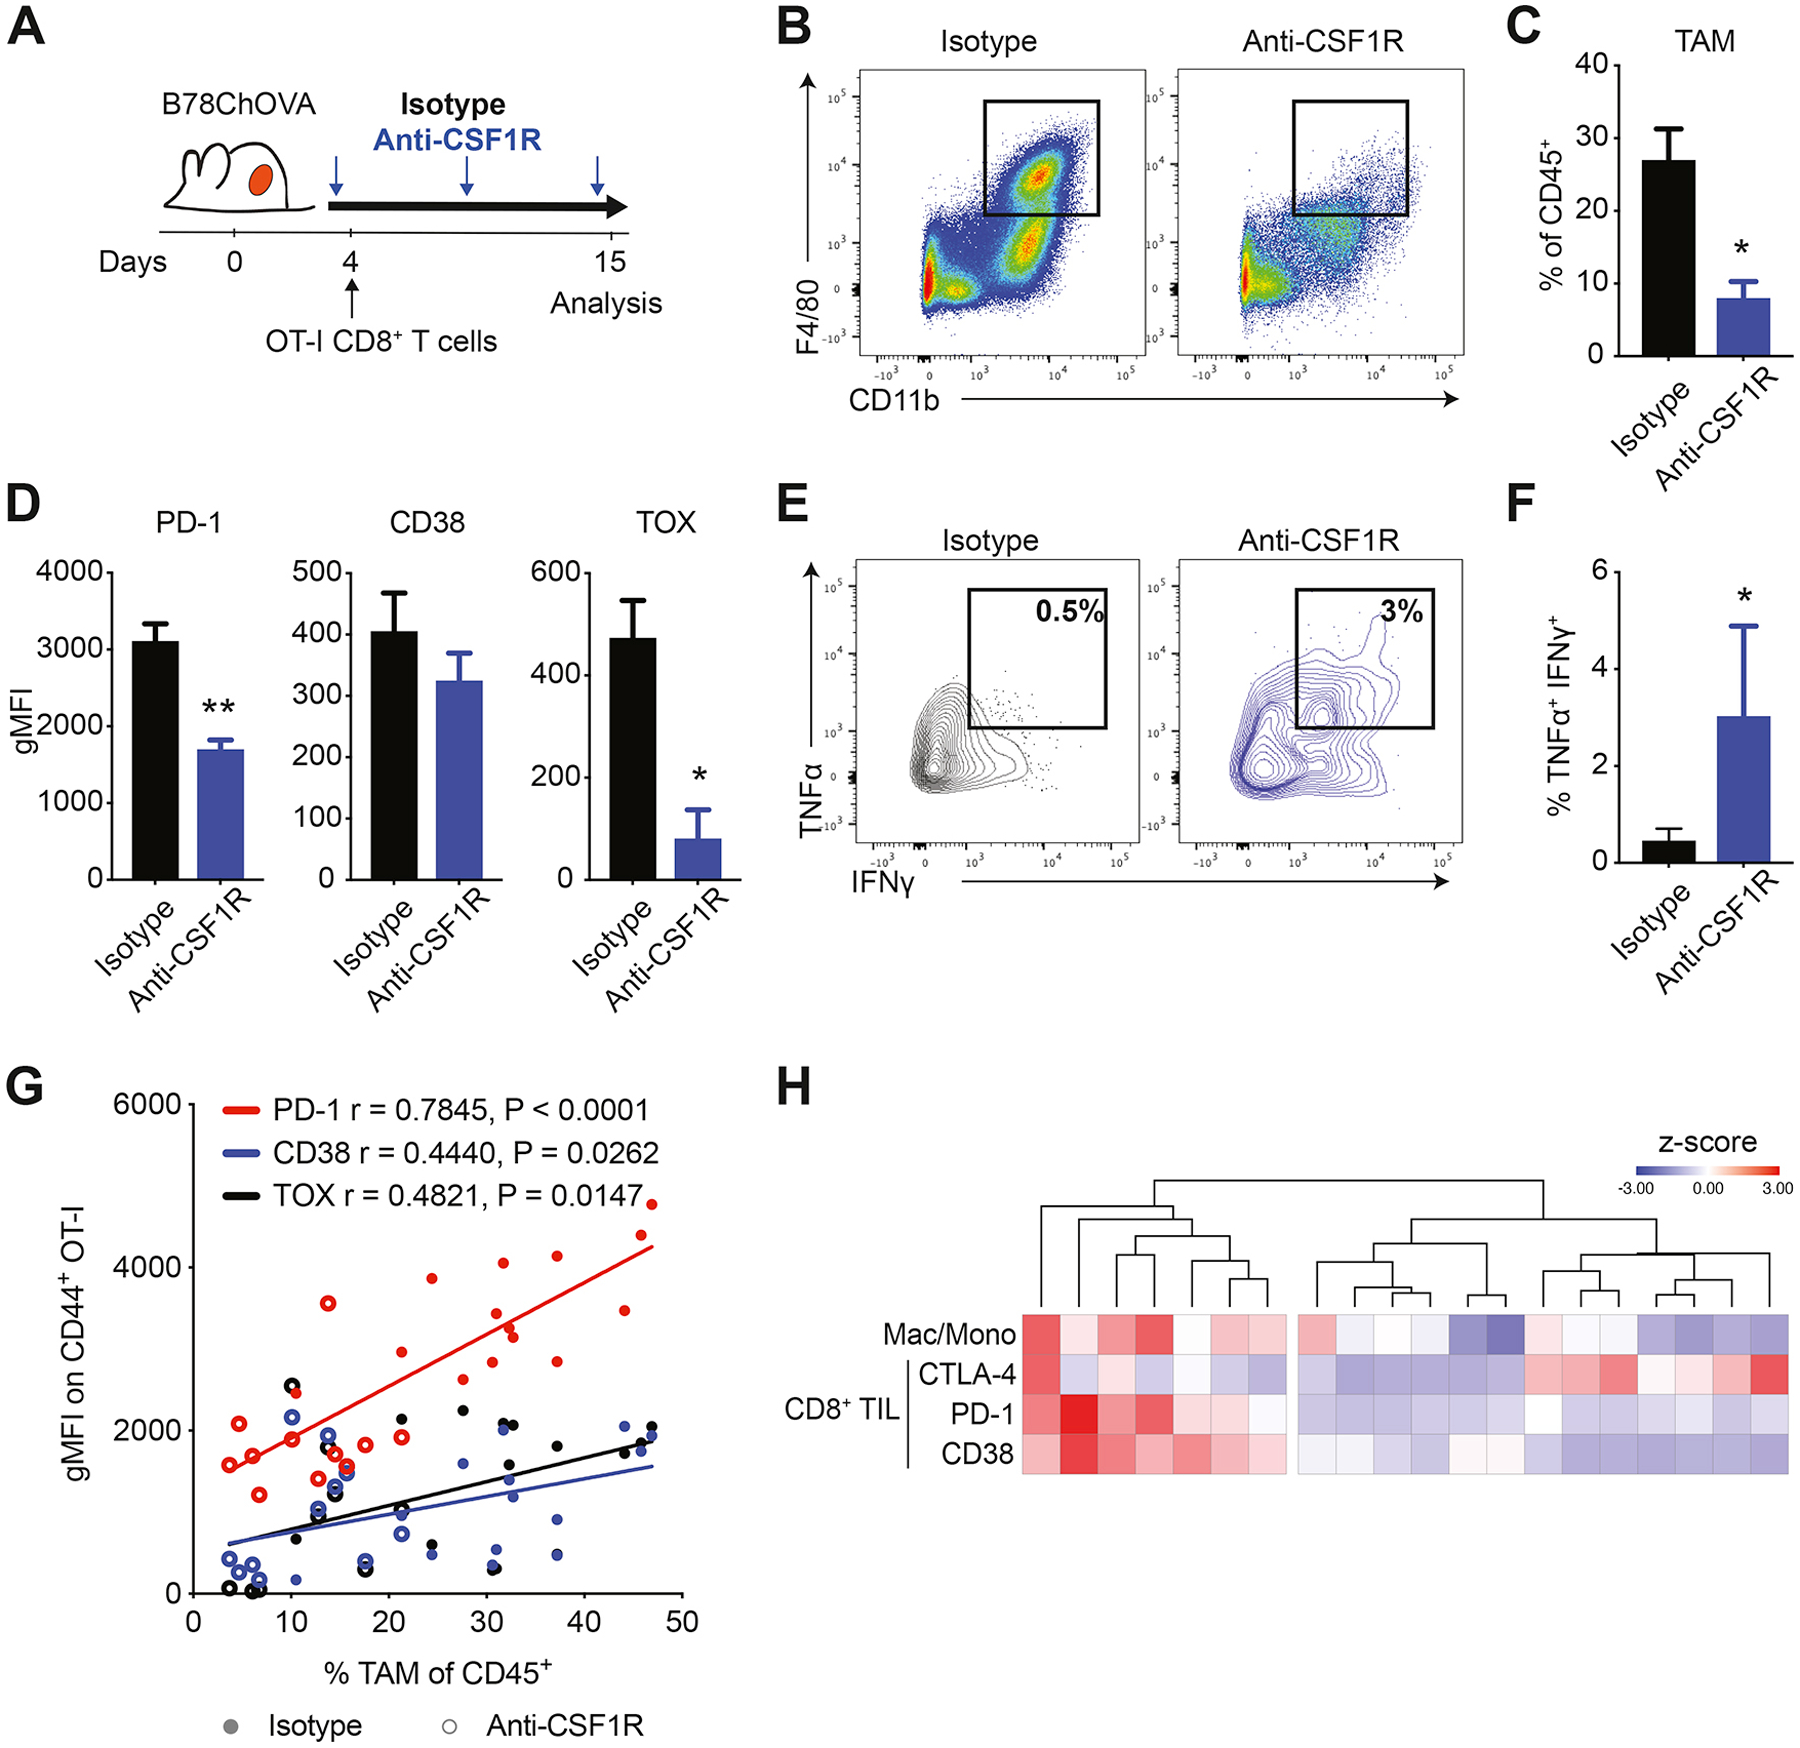
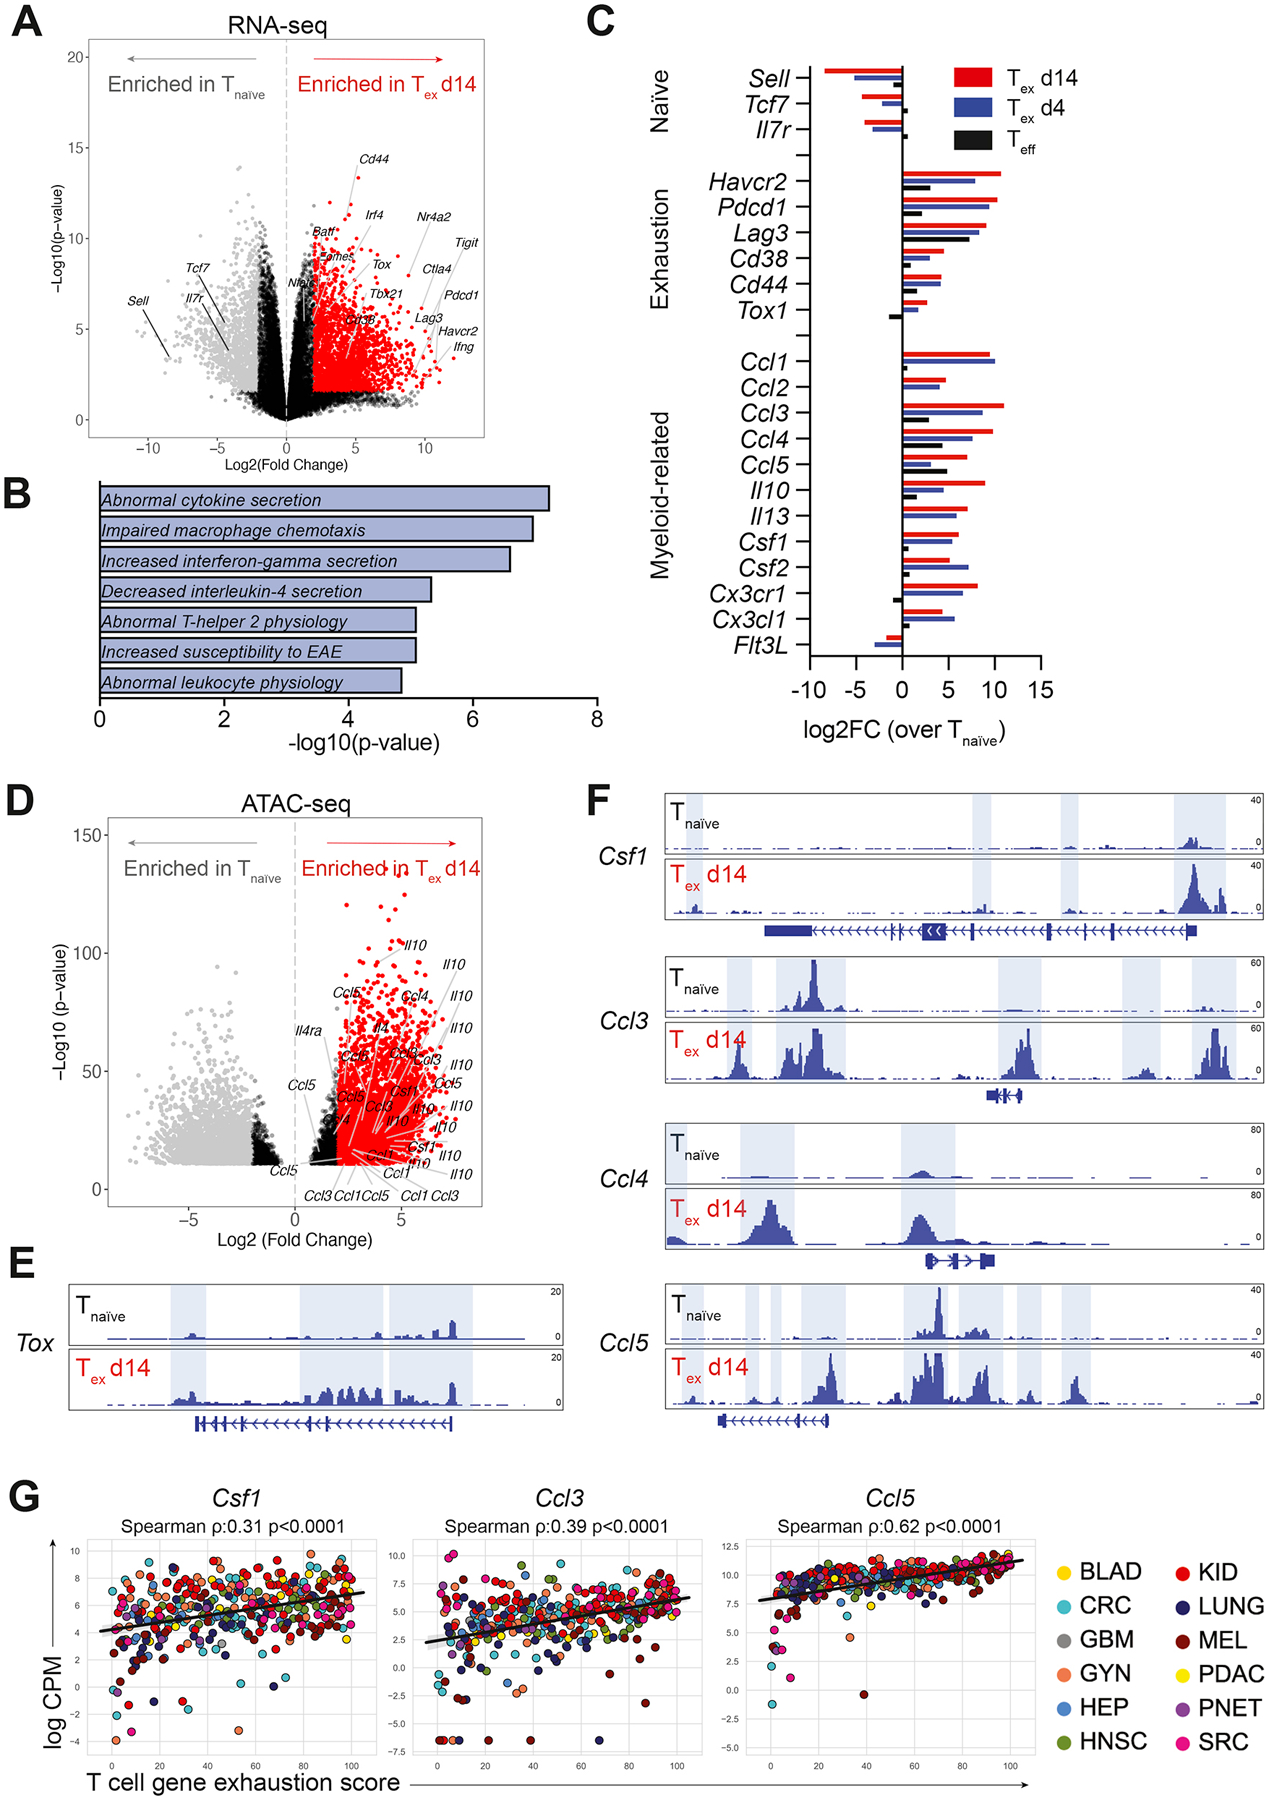
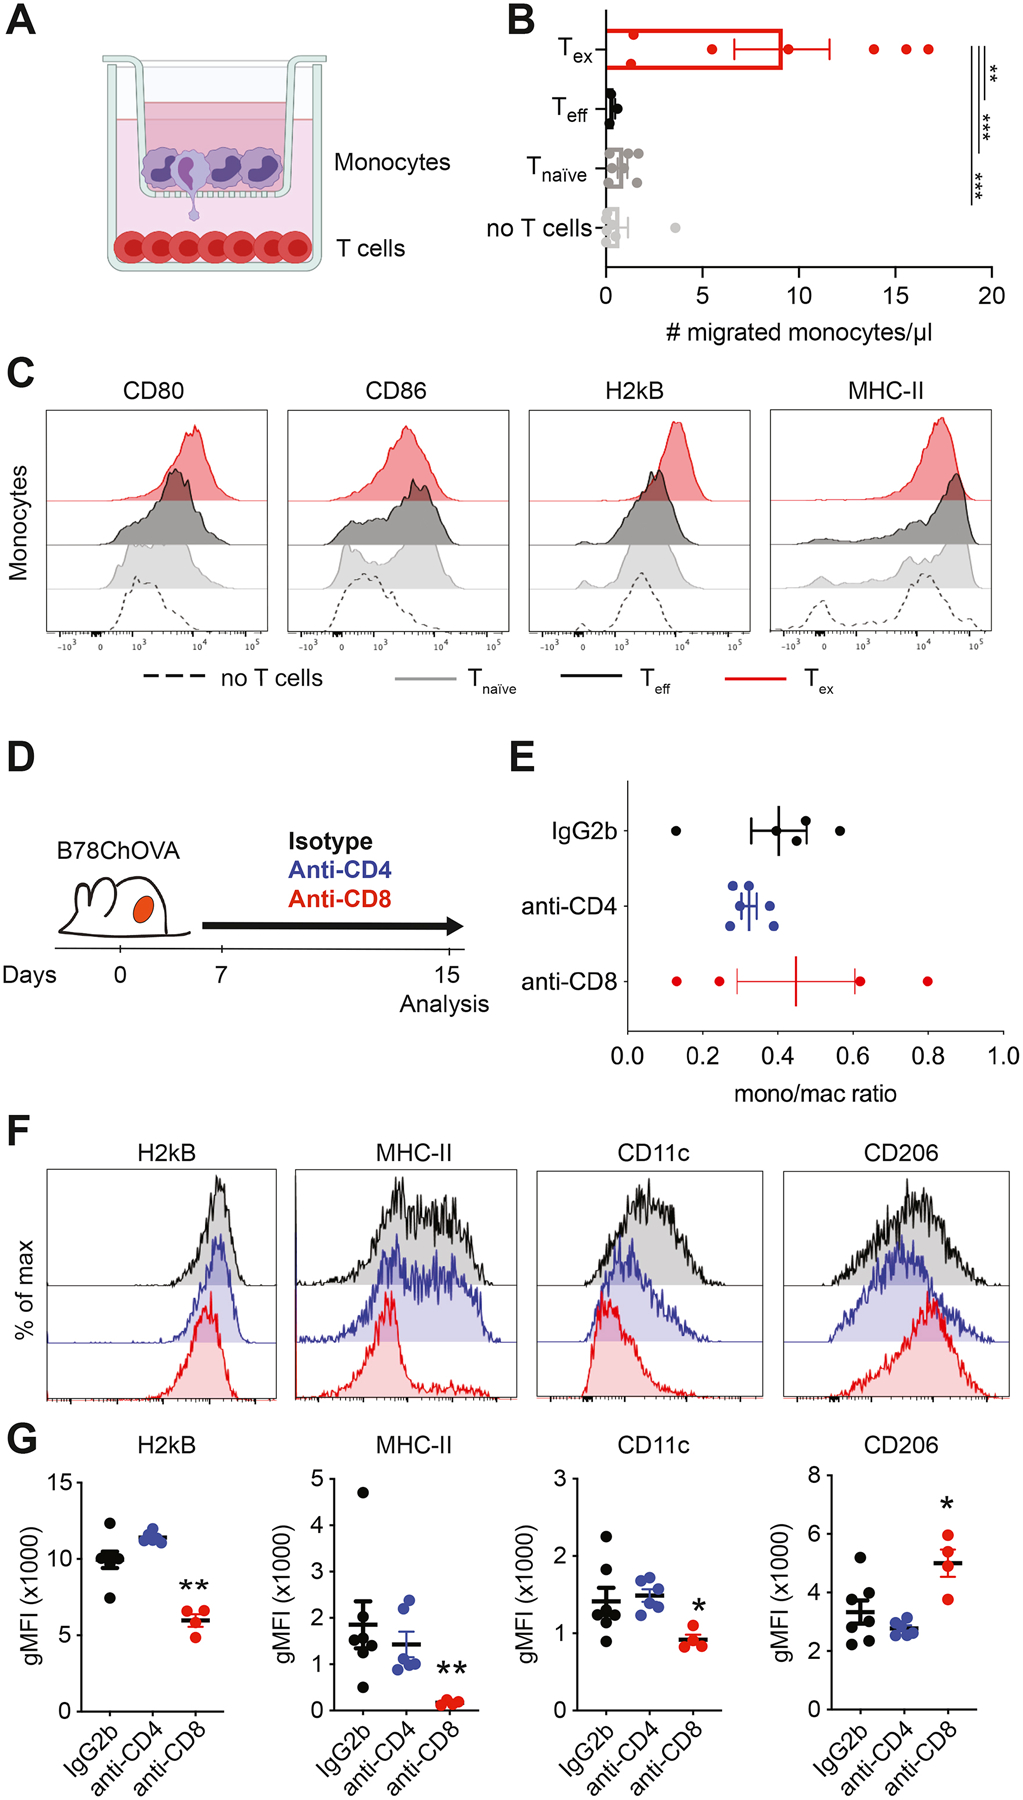
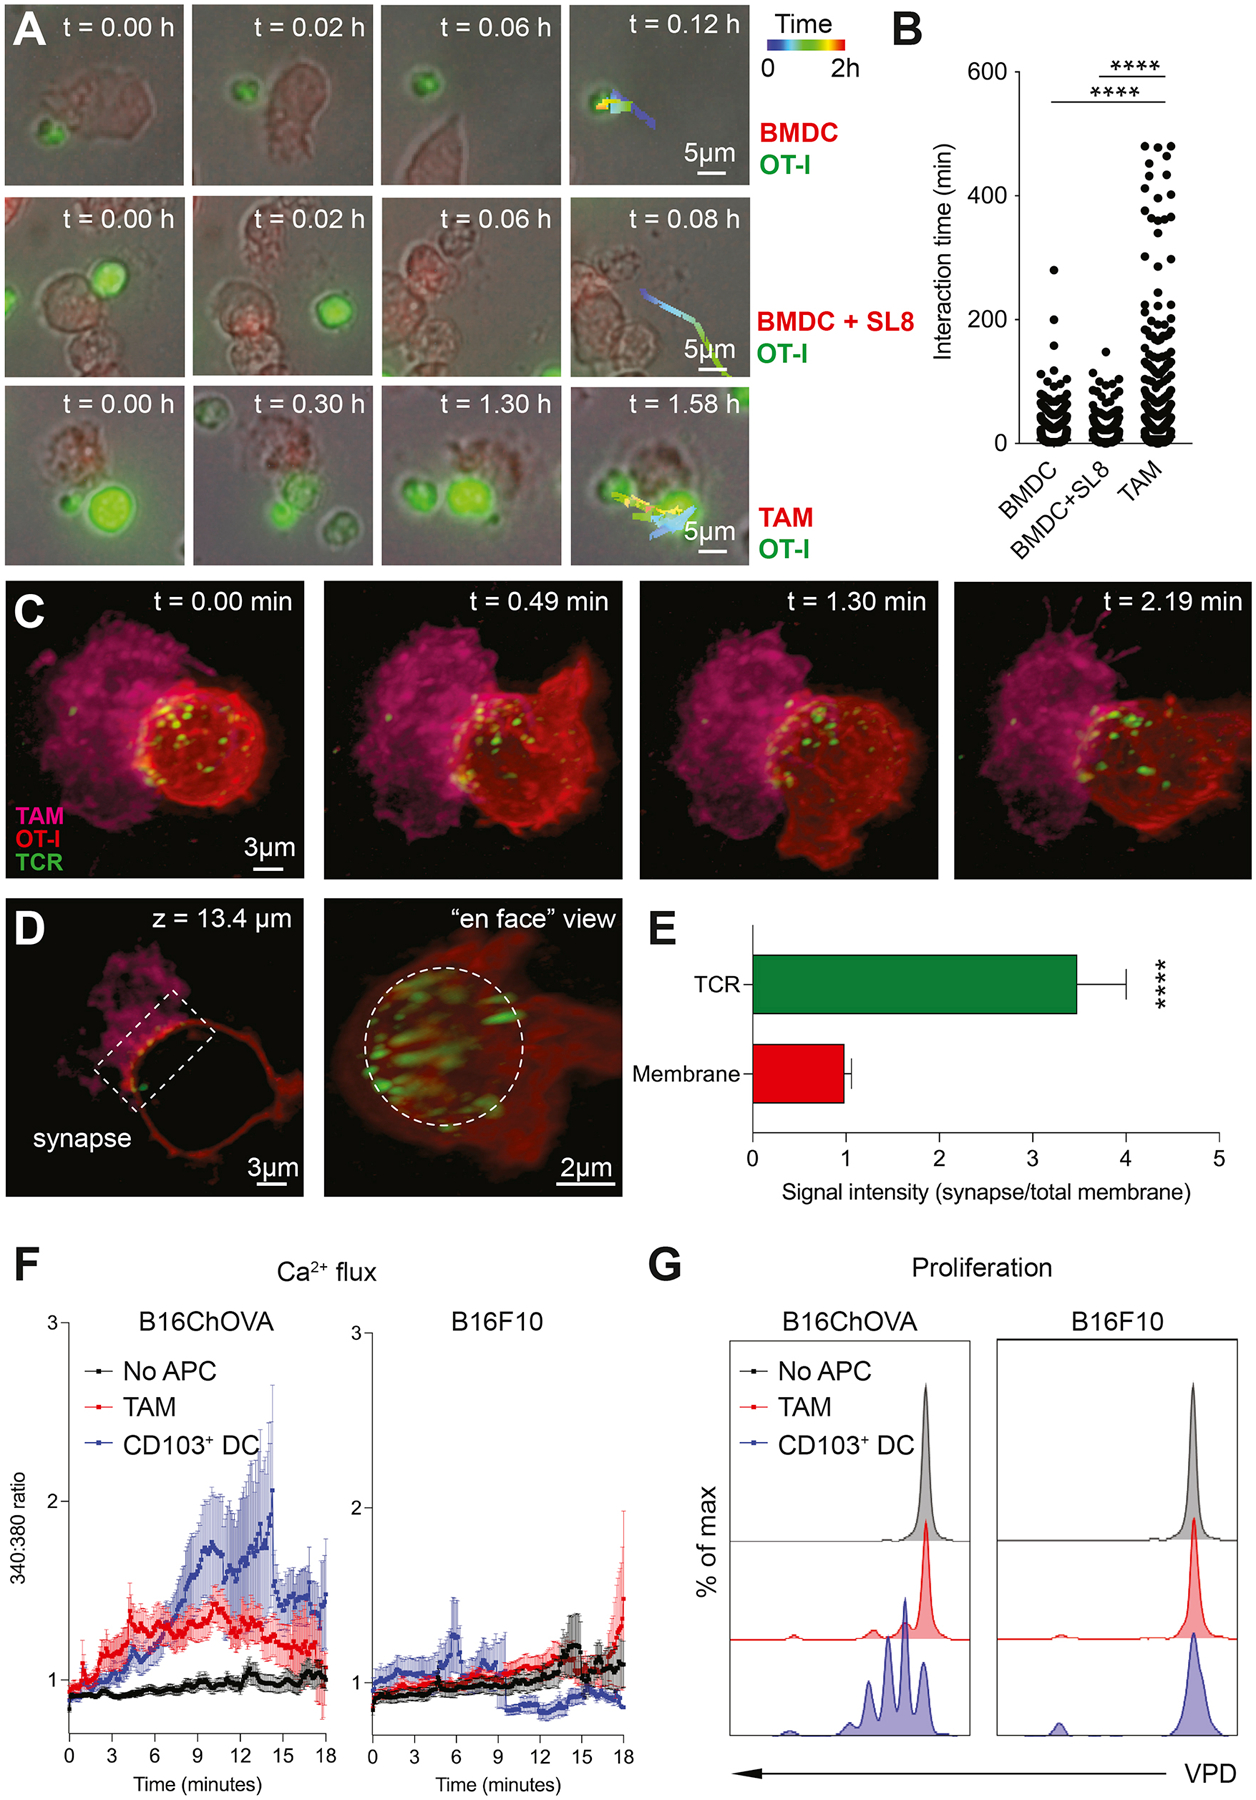
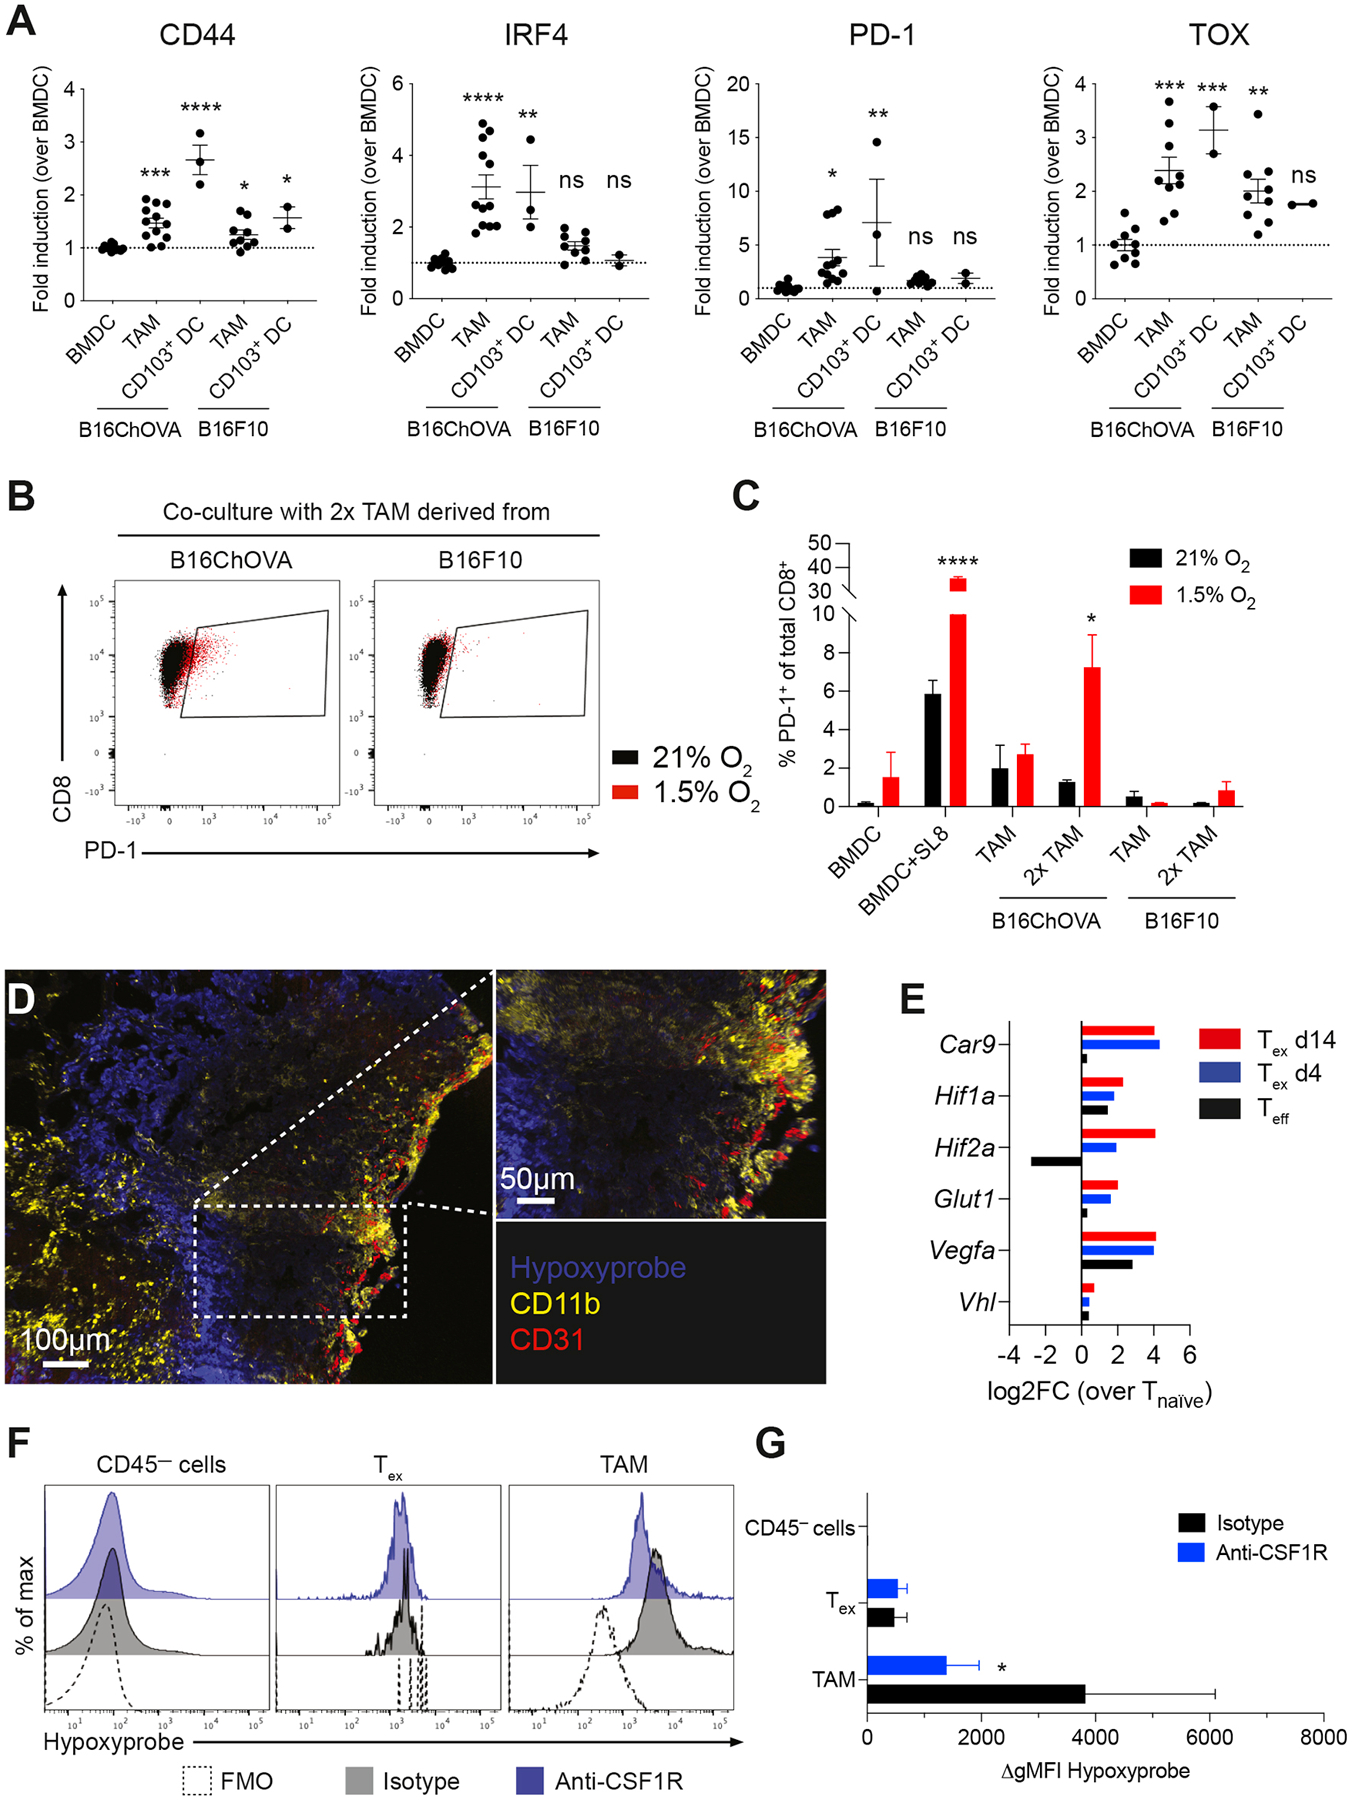
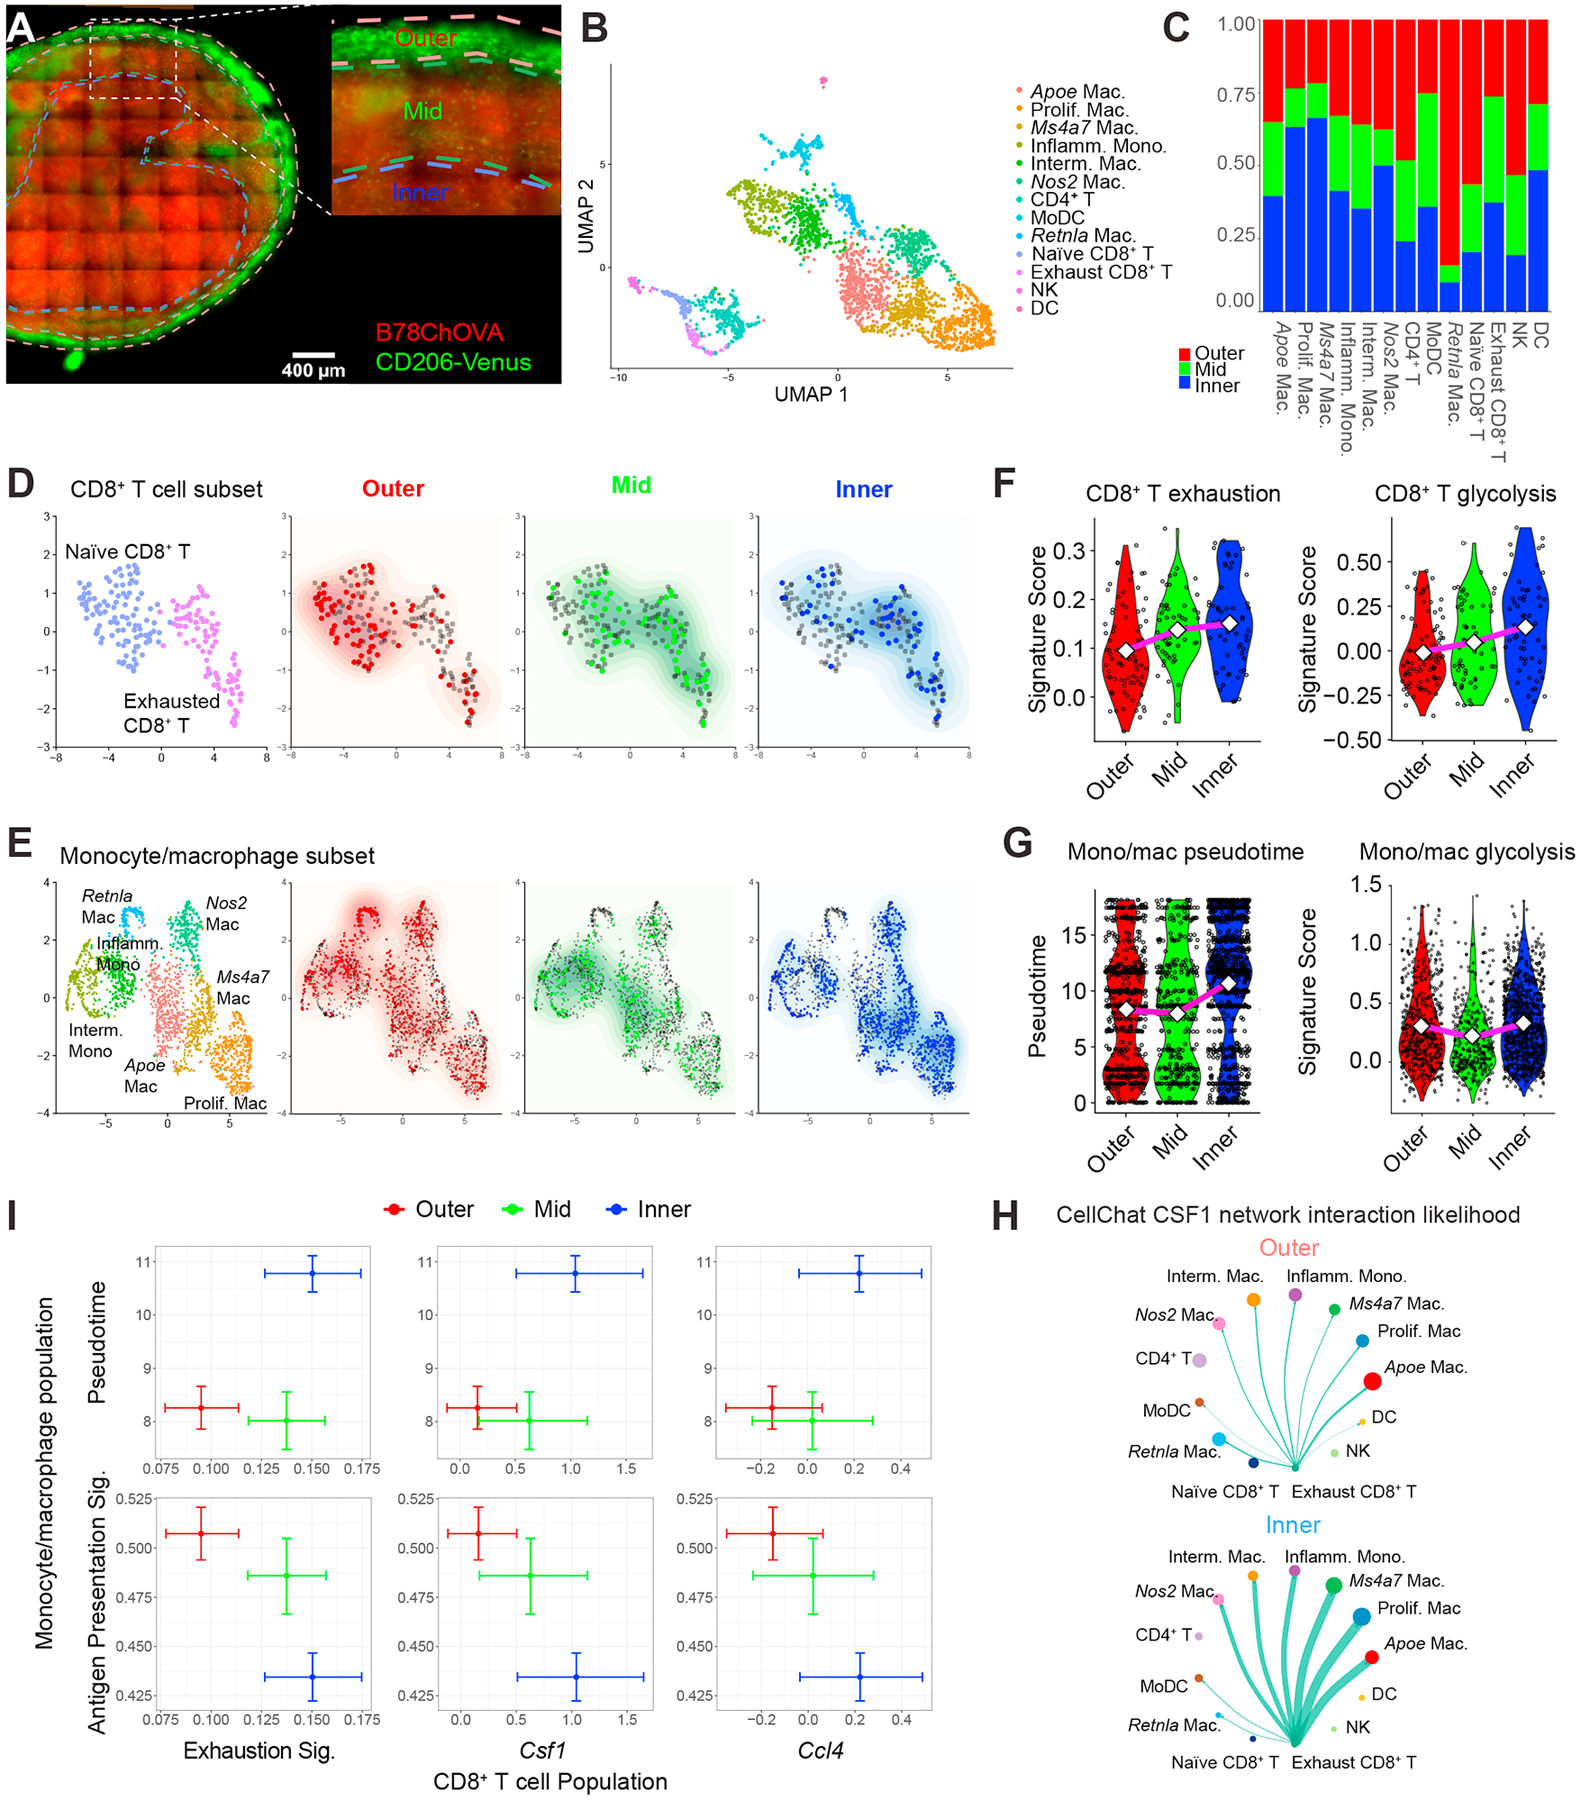
T cell exhaustion is a major impediment to antitumor immunity. However, it remains elusive how other immune cells in the tumor microenvironment (TME) contribute to this dysfunctional state. Here, we show that the biology of tumor-associated macrophages (TAMs) and exhausted T cells (Tex) in the TME is extensively linked. We demonstrate that in vivo depletion of TAMs reduces exhaustion programs in tumor-infiltrating CD8+ T cells and reinvigorates their effector potential. Reciprocally, transcriptional and epigenetic profiling reveals that Tex express factors that actively recruit monocytes to the TME and shape their differentiation. Using lattice light sheet microscopy, we show that TAM and CD8+ T cells engage in unique, long-lasting, antigen-specific synaptic interactions that fail to activate T cells but prime them for exhaustion, which is then accelerated in hypoxic conditions. Spatially resolved sequencing supports a spatiotemporal self-enforcing positive feedback circuit that is aligned to protect rather than destroy a tumor.

Keywords: T cell exhaustion; antitumor immunity; immunotherapy; tumor microenvironment; tumor-associated macrophages.


Conflict of interest statement

Declaration of interests A.T.S. is a scientific founder of Immunai and founder of Cartography Biosciences and receives research funding from Merck Research Laboratories and Allogene Therapeutics. M.F.K. is a founder and shareholder in Pionyr Immunotherapeutics and in Foundery Innovations, which prosecute and develop novel immunotherapeutics, respectively. The other authors declare no competing interests.

Figures

Figure 1.
Figure 1.. CD8+ T cell exhaustion correlates with macrophage abundance in the TME.
A) Experimental setup. Weekly anti-CSF1R or isotype antibody treatment was initiated 1–2 days after B78ChOVA tumor inoculation. OVA-specific OT-I CD8+ T cells were adoptively transferred 2–3 days after tumor inoculation. Mice were sacrificed at day 15 and tumors were harvested for analysis. B-C) Representative flow plots (B) and quantification (C) of CD11b+ F4/80+ macrophages in isotype and anti-CSF1R-treated tumors. N=5 mice/group. D) Surface (PD-1 and CD38) and intracellular (TOX) expression on intratumoral CD44+ OT-I CD8+ T cells from isotype and anti-CSF1R-treated mice. N=5 mice/group. E-F) Representative contour plots (E) and quantification (F) of IFNγ+TNFα+ polyfunctional CD44+ OT-I CD8+ T cells in tumors of isotype and anti-CSF1R-treated mice. N=8–9 mice/group. Pooled data from two independent experiments. G) Spearman correlation between gMFI of PD-1, CD38 and TOX expression on CD44+ OT-I CD8+ T cells and % of TAM of CD45+ cells in tumors treated with isotype (solid) or anti-CSF1R antibody (open). N=11–14 mice/group. H) Heatmap showing clustering of normalized z-scores of CTLA-4, PD-1 and CD38 expression on CD8+ TIL and macrophage/monocyte ratio in 20 fresh human kidney renal cell carcinoma samples (rows) determined by flow cytometry. All data are mean ± SEM. ** p < 0.01, * p < 0.05 as determined by Mann-Whitney U-test. See also Figure S1.
Figure 2.
Figure 2.. Exhausted CD8+ T cells express myeloid-related factors.
A) Volcano plot showing differential gene expression in tumor-infiltrating CD44+ OT-I CD8+ Tex d14 cells (red) compared to splenic CD44 OT-I CD8+ Tnaïve cells (grey) by RNA-seq. Colored dots (grey and red) represent genes with a log2FC>2 and FDR<0.05. B) Gene set enrichment analysis of DEGs (log2FC>5 and p-value<0.05) enriched in Tex d14 versus Tnaïve using the MGI Mammalian Phenotype Level 4 library. C) Average gene expression in Teff (black), Tex d4 (blue) and Tex d14 (red) normalized to Tnaïve as determined by RNA-seq. D) Volcano plot showing differential chromatin accessibility at transcriptional start sites in loci of myeloid genes in tumor-infiltrating CD44+ OT-I CD8+ Tex d14 cells compared to splenic CD44 OT-I CD8+ Tnaïve cells by ATAC-seq. Colored dots (grey and red) represent genes with a log2FC>2 and FDR<0.05. E-F) ATAC-seq signal tracks at the Tox (E), Csf1, Ccl3, Ccl4 and Ccl5 loci (F) highlighting differential chromatin accessibility peaks in CD44+ OT-I CD8+ Tex cells (d14) compared to splenic CD44 OT-I CD8+ Tnaïve cells. G) Correlation of normalized expression of Csf1, Ccl3 and Ccl5 transcripts and exhaustion score in FACS sorted human intratumoral T cells across multiple human cancer indications. See also Figure S2.
Figure 3.
Figure 3.. Exhausted CD8+ T cells recruit monocytes to the TME and shape macrophage phenotype.
A) Experimental setup of in vitro recruitment assay. Bone marrow-derived monocytes are cultured on transwell inserts (5μm pore size) and T cells (OT-I Tnaïve, Teff and Tex) are plated in the bottom well. B) Quantification of recruited monocytes after 24 hours. Data combined from two independent experiments. Statistical significance was determined by one-way ANOVA with Holm-Sidak’s multiple testing correction. C) Representative histograms of expression of surface markers on monocytes after 48 hours of co-culture with Tnaïve, Teff and Tex cells. D) Experimental set-up of in vivo CD4+ and CD8+ T cell depletion in B78ChOVA-bearing mice. Treatment with anti-CD4/CD8 antibodies or isotype was initiated 7 days after tumor inoculation and continued until mice were sacrificed. E-F) Monocyte/macrophage ratio of the proportion of Ly6Chi monocytes and F4/80+ macrophages (gated of CD45+ cells) in the B78ChOVA TME after isotype, anti-CD4 and anti-CD8 treatment. F-G) Representative histograms (F) and quantification (G) of H2kb, MHC-II, CD11c and CD206 expression on CD11b+F4/80+ macrophages in B78ChOVA tumors after isotype, anti-CD4 and anti-CD8 treatment. Statistical significance was determined using the Mann-Whitney U test. All data are mean ± SEM. * p < 0.05, ** p < 0.01, *** p < 0.001. See also Figure S3.
Figure 4.
Figure 4.. TAM uniquely engage CD8+ T cells in antigen-specific long-lived synaptic interactions.
A) Representative images of ex vivo interactions between mTomato+ APC (BMDC, BMDC+SL8 or B78ChOVA-derived TAM) and CFSE-labeled previously activated CD8+ OT-I T cells over time using conventional wide field microscopy. B) Quantification of interaction time. n = 3452 TAM, n = 6134 BMDC, n = 3320 BMDC+SL8. Statistical significance was determined using the one-way ANOVA test with Holm-Sidak’s multiple comparison correction. C) Representative images of the interaction between mTomato+ TAM sorted from B78ChOVA melanomas (magenta) and previously activated CD8+ OT-I T cell labeled with CD45-AF647 (red), with the H57 TCRβ labeled with AF488 by lattice light sheet imaging. Scale bar, 3μm. D) Z-slice (left) and ‘en face’ view (right) of the TAM-CD8+ T cell interaction site showing TCR clustering in the immunological synapse (box (left) and dotted circle (right)). E) Quantification of polarized TCR clustering by determining the ratio of signal intensity of the red (membrane) or green channel (TCR) at the synapse site normalized to the entire membrane. N = 12 T cells. Statistical significance was determined using the Mann-Whitney U test. F-G) Quantification of immediate Ca2+ flux by FURA-2AM imaging (F) and proliferation after 72 hours by dilution of Violet Proliferation Dye (VPD) (G) in previously activated CD8+ OT-I T cells after interaction with TAM or CD103+ DC isolated from B16ChOVA or B16F10 tumors. Negative control represents CD8+ OT-I T cells that did not touch an APC (no APC). All data are mean ± SEM. * p < 0.05, ** p < 0.01, *** p < 0.001, **** p < 0.0001. See also Movie S1 and Figure S4.
Figure 5.
Figure 5.. TAM engagement contributes to induction of exhaustion programs in CD8+ T cells in an antigen-specific manner.
A) Flow cytometric analysis of CD44, IRF4, PD-1 and TOX expression in previously activated CD8+ OT-I T cells co-cultured for 72 hours with in vitro generated BMDC, and TAM or CD103+ DC isolated from B16ChOVA or B16F10 tumors. Data presented as fold induction over BMDC. Cumulative data from 4 independent experiments. All data are plotted as mean ± S.E.M. One-way ANOVA with Holm-Sidak correction for multiple comparisons. B-C) Representative dot plots (B) and quantification (C) of PD-1+ expression on previously activated CD8+ OT-I T cells after co-culture with in vitro generated BMDC±SL8, and TAM isolated from B16ChOVA or B16F10 tumors. Ratio of APC:T cell was 1:4 or 1:2 (2x TAM). Plates were incubated in normoxic (21% O2) and hypoxic (1.5% O2) conditions for 3 days. Statistical significance was determined using the Unpaired t-test. D) Immunofluorescence of B78ChOVA melanomas stained with pimonidazole (Hypoxyprobe) Pacific Blue, CD11b-AF594 (yellow) and CD31-AF647 (red). E) Average expression of hypoxia-related genes in Teff (black), Tex d4 (blue) and Tex d14 (red) normalized to Tnaïve as determined by RNA-seq. F-G) Representative histograms (F) and quantification (G) of hypoxyprobe staining in CD45 cells, CD44+ OT-I CD8+ T cells and CD11b+F4/80+ TAM in B78ChOVA melanomas treated with isotype (black) or anti-CSF1R antibodies (blue). Statistical significance was determined using the Mann-Whitney U test. N = 4–5 mice/group. Representative of two independent experiments. All data are mean ± SEM. * p < 0.05, ** p < 0.01, *** p < 0.001, **** p < 0.0001. See also Figure S5.
Figure 6.
Figure 6.. Spatial delineation of TAM-Tex interaction dynamics in the TME.
A) Imaging of a 150μm-thick live B78ChOVA melanoma section with ROI demarcation of outer, mid and inner compartments used for subsequent ZipSeq. Red channel denotes mCherry signal from B78ChOVA cancer cells and green channel indicates expression of mVenus in CD206+ macrophages in the Csf1RCre;LSL-Cd206-Venus-DTR mouse model. Scale bar = 400μm. B) UMAP representation of sorted CD45+ cells following 10X Genomics scRNA-seq workflow (n = 2765 cells with n = 427/394/335/288/275/244/220/170/120/108/91/62/31 for clusters as listed). C) Stacked bar charts representing regional distribution of distinct populations identified in B. D-E) UMAP of subsampled CD8+ T cell subset (n = 199 cells) (D) and monocyte/macrophage subset (n = 2083 cells) (E) overlaid with their regional localization. F) Violin plots representing CD8+ T cell exhaustion score (left; Outer: 0.31 / 0.10 / −0.07; Mid: 0.35 /0.14 / −0.05; Inner: 0.32 / 0.15 / −0.01) and CD8+ T cell glycolytic score (right; Outer; 0.45 / −0.01 / −0.37; Mid: 0.60 / 0.05 / −0.31; Inner: 0.69 / 0.14 / −0.45) in distinct regions in the TME. Values max / average (diamond) /min. G) Violin plots representing monocyte/macrophage pseudotime signature score (left; Outer: 18.1 / 8.3 /0.00; Mid: 18.1 / 8.0 / 0.00; Inner: 18.1 / 10.0 / 0.00) and monocyte/macrophage glycolytic score (right; Outer: 1.35 / 0.29 / −0.33; Mid: 1.39 / 0.21 / −0.33; Inner: 1.39 / 0.33 / −0.33). Values max / average (diamond) / min. H) CellChat interaction likelihood analysis for CSF1 network in outer (top) and inner (bottom) regions of the TME. Thickness of green arrows represents interaction likelihood between populations. I) Cross-whisker plots comparing expression of exhaustion signature and normalized single gene (Csf1 and Ccl4) expression in CD8+ T cells (x-axis), and pseudotime score and antigen-presentation signature in the monocyte/macrophage population (y-axis) in distinct regions in the TME. Error bars represent 95% CI as computed by bootstrap resampling. See also Figure S6 and Table S1.

References

    1. Alfei F, Kanev K, Hofmann M, Wu M, Ghoneim HE, Roelli P, Utzschneider DT, von Hoesslin M, Cullen JG, Fan Y, et al. (2019). TOX reinforces the phenotype and longevity of exhausted T cells in chronic viral infection. Nature 571, 265–269. 10.1038/s41586-019-1326-9. - DOI - PubMed
    1. Argüello RJ, Combes AJ, Char R, Gigan J-P, Baaziz AI, Bousiquot E, Camosseto V, Samad B, Tsui J, Yan P, et al. (2020). SCENITH: A Flow Cytometry-Based Method to Functionally Profile Energy Metabolism with Single-Cell Resolution. Cell Metab. 32, 1063–1075. 10.1016/j.cmet.2020.11.007. - DOI - PMC - PubMed
    1. Barry KC, Hsu J, Broz ML, Cueto FJ, Binnewies M, Combes AJ, Nelson AE, Loo K, Kumar R, Rosenblum MD, et al. (2018). A natural killer-dendritic cell axis defines checkpoint therapy-responsive tumor microenvironments. Nat. Med 24, 1178–1191. 10.1038/s41591-018-0085-8. - DOI - PMC - PubMed
    1. Beatty GL, Chiorean EG, Fishman MP, Saboury B, Teitelbaum UR, Sun W, Huhn RD, Song W, Li D, Sharp LL, et al. (2011). CD40 agonists alter tumor stroma and show efficacy against pancreatic carcinoma in mice and humans. Science 331, 1612–1616. 10.1126/science.1198443. - DOI - PMC - PubMed
    1. Beltra J-C, Manne S, Abdel-Hakeem MS, Kurachi M, Giles JR, Chen Z, Casella V, Ngiow SF, Khan O, Huang YJ, et al. (2020). Developmental Relationships of Four Exhausted CD8+ T Cell Subsets Reveals Underlying Transcriptional and Epigenetic Landscape Control Mechanisms. Immunity 52, 825–841. 10.1016/j.immuni.2020.04.014. - DOI - PMC - PubMed

Publication types