. 2023 Feb;72(2):360-371.
doi: 10.1136/gutjnl-2021-325117. Epub 2022 May 27.

Lysosomal lipid switch sensitises to nutrient deprivation and mTOR targeting in pancreatic cancer

Affiliations

Lysosomal lipid switch sensitises to nutrient deprivation and mTOR targeting in pancreatic cancer

Maria Chiara De Santis et al. Gut. 2023 Feb.

Abstract

Objective: Pancreatic ductal adenocarcinoma (PDAC) is an aggressive disease with limited therapeutic options. However, metabolic adaptation to the harsh PDAC environment can expose liabilities useful for therapy. Targeting the key metabolic regulator mechanistic target of rapamycin complex 1 (mTORC1) and its downstream pathway shows efficacy only in subsets of patients but gene modifiers maximising response remain to be identified.

Design: Three independent cohorts of PDAC patients were studied to correlate PI3K-C2γ protein abundance with disease outcome. Mechanisms were then studied in mouse (KPC mice) and cellular models of PDAC, in presence or absence of PI3K-C2γ (WT or KO). PI3K-C2γ-dependent metabolic rewiring and its impact on mTORC1 regulation were assessed in conditions of limiting glutamine availability. Finally, effects of a combination therapy targeting mTORC1 and glutamine metabolism were studied in WT and KO PDAC cells and preclinical models.

Results: PI3K-C2γ expression was reduced in about 30% of PDAC cases and was associated with an aggressive phenotype. Similarly, loss of PI3K-C2γ in KPC mice enhanced tumour development and progression. The increased aggressiveness of tumours lacking PI3K-C2γ correlated with hyperactivation of mTORC1 pathway and glutamine metabolism rewiring to support lipid synthesis. PI3K-C2γ-KO tumours failed to adapt to metabolic stress induced by glutamine depletion, resulting in cell death.

Conclusion: Loss of PI3K-C2γ prevents mTOR inactivation and triggers tumour vulnerability to RAD001 (mTOR inhibitor) and BPTES/CB-839 (glutaminase inhibitors). Therefore, these results might open the way to personalised treatments in PDAC with PI3K-C2γ loss.

Keywords: AMINO ACIDS; CELL BIOLOGY; LIPID METABOLISM; PANCREATIC CANCER; SIGNAL TRANSDUCTION.


Conflict of interest statement

Competing interests: EH is a founder of Kither Biotech, a company involved in the development of PI3K inhibitors. The authors declare no potential conflicts of interest.

Figures

Figure 1
Figure 1
PI3K-C2γ loss decreases KPC mice survival and accelerates PDAC cells growth. (A, B) Immunohistochemical (IHC) assessment (A) and quantification (B) of the level of PI3K-C2γ expression in PDAC patients in cohort #1. Representative images of high (score ≥1) and low (score <1) PI3K-C2γ expressing tumours (n=73) (scale bar=100 µm). (C, D) Percentage of tumours expressing high (score ≥1) or low (score <1) levels of PI3K-C2γ in cohort #2 (n=76), (C) and cohort #3 (n=45), (D). (E) Kaplan-Meier curve for survival of WT/KO KPC mice (n=40, Mantel-Cox log-rank test). (F) Histopathological analysis of WT/KO KPC mice pancreata. Representative H&E images, PAS-alcian blue and Masson trichrome stainings of 1.5 and 4 months old mice. Arrows indicate PanIN lesions, asterisks (*) indicate normal acini, hashtags (#) indicates PDAC (scale bar=100 µm). (G) Axial (top) and coronal (bottom) T2w MRI (B0=7.1 T) of WT (left) and KO (right) 6 weeks old KPC mice. White arrows indicate pancreatic tumour. (H, I) Growth assay of WT/KO KPC (H) and Panc1 (I) cells (n=5). Data are shown as mean±SEM, ANOVA followed by Bonferroni’s post hoc test, otherwise indicated. ANOVA, analysis of variance; KPC, LSL-KrasG12D/+;LSL-Trp53R172H/+;Pdx-1-Cre; PAS, Periodic acid–Schiff; PDAC, pancreatic ductal adenocarcinoma.
Figure 2
Figure 2
PI3K-C2γ loss induces mTORC1 hyperactivation on glutamine deprivation. (A) IHC assessment of the level of PCNA (top) and pS6 (bottom) in tumours taken from WT/KO KPC mice. Arrows indicate PanIN lesions, asterisks (*) indicate normal acini, hashtags (#) indicates PDAC (scale bar=100 µm). (B) IHC assessment (left) and quantification (right) of the level of pS6 expression (focal positive reactivity) in PDAC patients (scale bar=100 µm) expressing high (score ≥1) or low (score <1) of PI3K-C2γ levels (n=45 patients, p=0.04, χ2 test). (C) WB analysis of mTORC1 activity in WT/KO Panc1 cells that were starved of glutamine (Gln), then stimulated with Gln at the indicated concentrations. Representative Western blot images of whole-cell lysates probed with indicated antibodies (top) and quantification of pS6K/S6K ratio in the indicated conditions (n=9, bottom). (D) WB analysis of pS6K in WT Panc1, KO Panc1 or KO Panc1 cells re-expressing WT or the kinase dead (KD) versions of tGFP-PI3K-C2γ after glutamine depletion for 2 hours. Representative Western blot images of whole-cell lysates probed with indicated antibodies (left) and quantification of pS6K/S6K ratio in the indicated conditions (n=4, right). (E) Quantification of PI(3,4)P2 concentration in WT/KO Panc1 cells that were starved of glutamine (Gln), then stimulated with Gln at the indicated concentrations (n=5). Data are shown as mean±SEM, ANOVA followed by Bonferroni’s post hoc test, otherwise indicated. ANOVA, analysis of variance; IHC, immunohistochemical; mTORC1, mechanistic target of rapamycin complex 1; KPC, LSL-KrasG12D/+;LSL-Trp53R172H/+;Pdx-1-Cre; PCNA, proliferating cell nuclear antigen; PDAC, pancreatic ductal adenocarcinoma. **P<0.01; ***p<0.001.
Figure 3
Figure 3
PI3K-C2γ-derived PI(3,4)P2 inhibits Arf1 activity. (A, B) Localisation of PI3K-C2γ on Lamp1-positive lysosomes. Representative confocal images of tGFP-labelled PI3K-C2γ and miRFP-labelled LAMP1 in normal culture conditions (NC), (A) or on glutamine withdrawal (0 mM Gln), (B) for 2 hours in Panc1 cells. Dashed white line defines cell limits. White arrows indicate colocalisation of the indicated proteins (scale bar=10 µm). (C, D) Localisation of PI3K-C2γ and PI(3,4)P2 on Lamp1-positive lysosomes. Representative confocal images of tGFP-labelled PI3K-C2γ, mCherry-labelled PHX3 (probe for the detection of PI(3,4)P2) and miRFP-labelled LAMP1 in normal culture conditions (NC), (C) or on glutamine withdrawal (0 mM Gln), (D) in Panc1 cells. Dashed white line defines cell limits. White arrows indicate colocalisation of the indicated proteins (scale bar=10 µm). (E, F) PD of endogenous active ARF1 in WT/KO Panc1 cells on glutamine withdrawal. Quantification of active ARF1 pulled-down by GST (F, n=5). (G, H) PD of endogenous active ARF1 in WT, KO Panc1 or KO Panc1 cells re-expressing either tGFP-PI3K-C2γ WT or tGFP-PI3K-C2γ kD (kinase dead) on glutamine withdrawal for 2 hours. Representative Western blot images of active ARF1 PD assay probed with indicated antibodies (G). Quantification of active ARF1 pulled-down by GST (H, n=5). Data are shown as mean±SEM, ANOVA followed by Student’s t-test (F) or Bonferroni’s post hoc test (H). ANOVA, analysis of variance; PD, pull down; Tl, total lysate. **P<0.01.
Figure 4
Figure 4
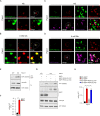
PI3K-C2γ-derived PI(3,4)P2 recruits Asap1 that inhibits Arf1 activity. (A, B) Localisation of PI3K-C2γ and Asap1 on Lamp1-positive lysosomes. Representative confocal images of tGFP-labelled PI3K-C2γ, mCherry-labelled ASAP1 and miRFP-labelled LAMP1 in normal culture conditions (NC, (A) or on glutamine withdrawal (0 mM Gln, (B) in Cos7 cells. Dashed white line defines cell limits. White arrows indicate colocalisation of the indicated proteins (scale bar=10 µm). (C, D) Localisation of PI3K-C2γ KD (kinase dead) and Asap1 on Lamp1-positive lysosomes. Representative confocal images of tGFP-labelled PI3K-C2γ KD, mCherry-labelled Asap1 and miRFP-labelled Lamp1 in normal culture conditions (NC, (C) or on glutamine withdrawal (0 mM Gln, (D) in Cos7 cells (scale bar=10 µm). (E, F) Localisation of PI(3,4)P2 and Asap1 on Lamp1-positive lysosomes. Representative confocal images of GFP-labelled PHX3, mCherry-labelled Asap1 and miRFP-labelled Lamp1 in normal culture conditions (NC), (E) or on glutamine withdrawal (0 mM Gln), (F) in Cos7 cells. Dashed white line defines cell limits. White arrows indicate colocalisation of the indicated proteins (scale bar=10 µm). (G) PD of endogenous active Arf1 and western blot analysis of mTORC1 activity probed with indicated antibodies in WT, Asap1 KO overexpressing tGFP or tGFP-PI3K-C2γ on glutamine withdrawal in Panc1 cells. mTORC1, mechanistic target of rapamycin complex 1; PD, pull down, TL, total lysate.
Figure 5
Figure 5
PI3K-C2γ loss induces metabolic rewiring towards the anabolic use of glutamine (A–D) seahorse XFe96 MITO stress test analysis and Oxygen Consumption Rate (OCR) was measured in real time in normal culture condition (2 mM Gln) or on 24 hours of glutamine withdrawal (0 mM Gln 24 hours) (n=3). Basal (B), maximal (C) and spare (D) OCR were measured and normalised on protein levels (n=3). Gln=glutamine, oligo=oligomycin, FCCP=carbonyl cyanide-4 (trifluoromethoxy) phenylhydrazone, Rot/AntA=rotenone/antimycin. (E) Quantification of glucose consumption in normal culture conditions (2 mM Gln) of WT/KO Panc1 cells (n=5). (F) Quantification of lactate production in normal culture conditions (2 mM Gln) of WT/KO Panc1 cells (n=5). (G, H) WT/KO KPC cells were cultured for 24 hours in a medium containing radioactive 14C-glutamine. Lipids and proteins were extracted in parallel and radioactive signal was measured to monitor the amount of glutamine that is incorporated into lipids (G) and proteins (H). Each value was normalised on protein content (n=3). (I) Cell viability assay on WT/KO Panc1 cells at indicated glutamine concentrations after 24 hours (n=5). (J) Growth assay of WT/KO Panc1 cells in normal culture conditions (2 mM Gln) or on glutamine withdrawal (0 mM Gln) (n=5). #: KO 2 mM Gln vs KO 0 mM Gln); *: WT 0 mM Gln vs KO 0 mM Gln. Data are shown as mean±SEM, ANOVA followed by Bonferroni’s post hoc test (B–D, I, J) or Student’s t-test (E–H). ANOVA, analysis of variance. *P<0.05; **P<0.01; ***p<0.001; ***#<0.001.
Figure 6
Figure 6
PI3K-C2γ loss sensitises to glutaminase inhibitors in xenograft models. (A) Cell viability assay on WT/KO Panc1 cells after 48 hours of treatment with CB 839 (5 μM), everolimus (2.5 µM) or combination of the two drugs (Combo, n=6). (B) quantification of xenograft tumour growth arising from subcutaneously injected WT/KO Panc1 cells. Mice were treated for 2.5 weeks (w) with intraperitoneal injections of vehicle (NT), BPTES, everolimus (EVR) or combination (COMBO) of the two drugs (n=6). Schematic representation of drugs administration (bottom panels). (C) IHC assessment of the level of PCNA (top) and pS6 (bottom) in tumours taken from mice injected with WT/KO Panc1 cells treated with vehicle (NT), BPTES, everolimus (EVR) or combination (COMBO) of the two drugs for 2.5 weeks. (D) quantification of xenograft tumour growth arising from subcutaneously injected WT/KO KPC cells. Mice were treated for 2.5 weeks (w) with intraperitoneal injections of vehicle (NT), BPTES, everolimus (EVR) or combination (COMBO) of the two drugs (n=6). Schematic representation of drugs administration (bottom panels). Data are shown as mean±SEM, ANOVA followed by Bonferroni’s post hoc test. ANOVA, analysis of variance. *P<0.05; **P<0.01; ***p<0.001.

References

    1. Siegel RL, Miller KD, Jemal A. Cancer statistics. In: CA: a cancer Journal for clinicians 2020. 70, 2020: 7–30. - PubMed
    1. Perera RM, Bardeesy N. Pancreatic cancer metabolism: breaking it down to build it back up. Cancer Discov 2015;5:1247–61. 10.1158/2159-8290.CD-15-0671 - DOI - PMC - PubMed
    1. Derle A, De Santis MC, Gozzelino L, et al. . The role of metabolic adaptation to nutrient stress in pancreatic cancer. Cell Stress 2018;2:332–9. 10.15698/cst2018.12.166 - DOI - PMC - PubMed
    1. Son J, Lyssiotis CA, Ying H, et al. . Glutamine supports pancreatic cancer growth through a KRAS-regulated metabolic pathway. Nature 2013;496:101–5. 10.1038/nature12040 - DOI - PMC - PubMed
    1. Biancur DE, Paulo JA, Małachowska B, et al. . Compensatory metabolic networks in pancreatic cancers upon perturbation of glutamine metabolism. Nat Commun 2017;8:15965. 10.1038/ncomms15965 - DOI - PMC - PubMed

Publication types

MeSH terms