. 2022 Jun;23(6):927-939.
doi: 10.1038/s41590-022-01216-z. Epub 2022 May 27.

Hypoxia shapes the immune landscape in lung injury and promotes the persistence of inflammation

Affiliations

Hypoxia shapes the immune landscape in lung injury and promotes the persistence of inflammation

Ananda S Mirchandani et al. Nat Immunol. 2022 Jun.

Erratum in

  • Author Correction: Hypoxia shapes the immune landscape in lung injury and promotes the persistence of inflammation.
    Mirchandani AS, Jenkins SJ, Bain CC, Sanchez-Garcia MA, Lawson H, Coelho P, Murphy F, Griffith DM, Zhang A, Morrison T, Ly T, Arienti S, Sadiku P, Watts ER, Dickinson RS, Reyes L, Cooper G, Clark S, Lewis D, Kelly V, Spanos C, Musgrave KM, Delaney L, Harper I, Scott J, Parkinson NJ, Rostron AJ, Baillie JK, Clohisey S, Pridans C, Campana L, Lewis PS, Simpson AJ, Dockrell DH, Schwarze J, Hirani N, Ratcliffe PJ, Pugh CW, Kranc K, Forbes SJ, Whyte MKB, Walmsley SR. Mirchandani AS, et al. Nat Immunol. 2022 Sep;23(9):1394. doi: 10.1038/s41590-022-01286-z. Nat Immunol. 2022. PMID: 35854097 Free PMC article. No abstract available.

Abstract

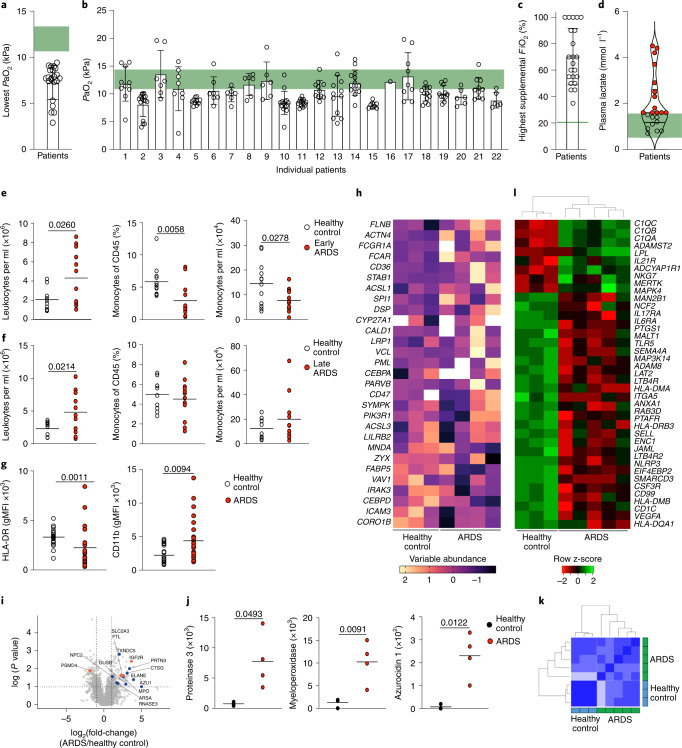
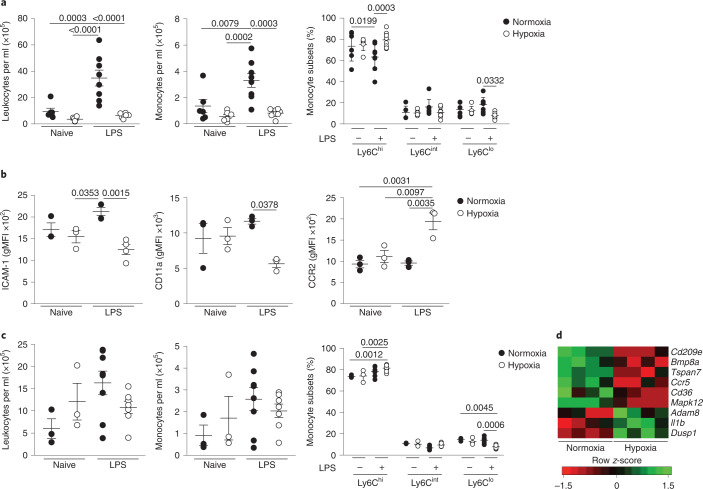
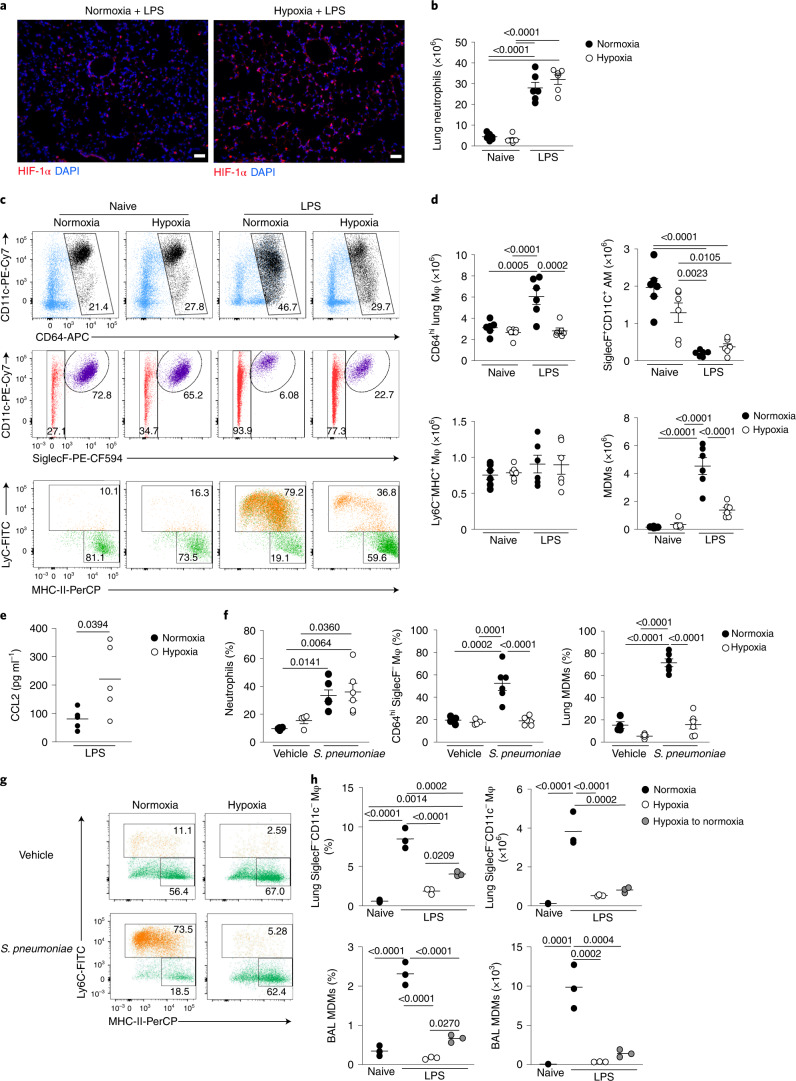
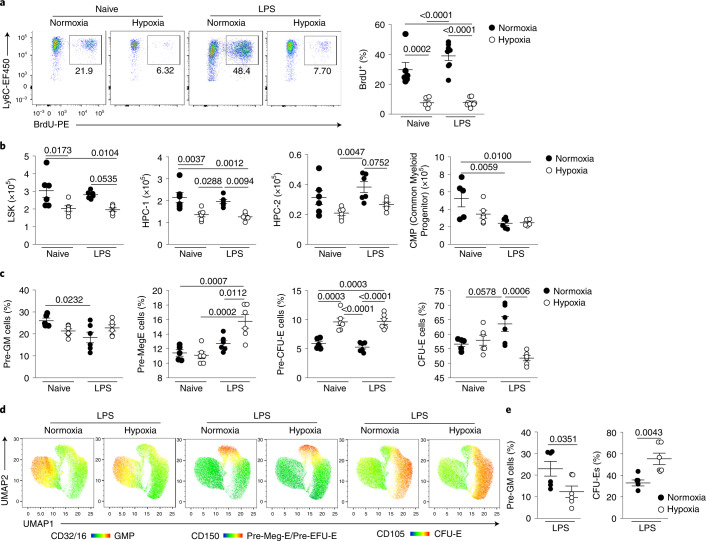
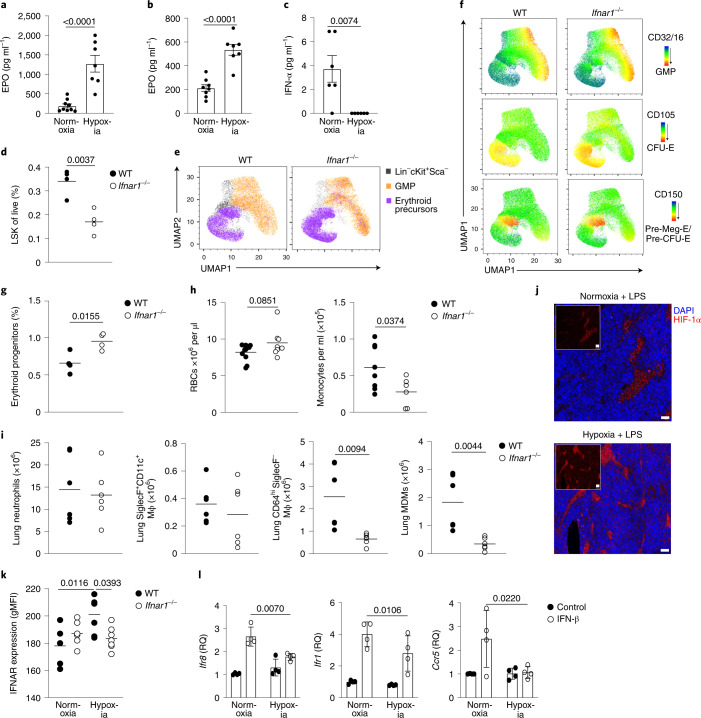
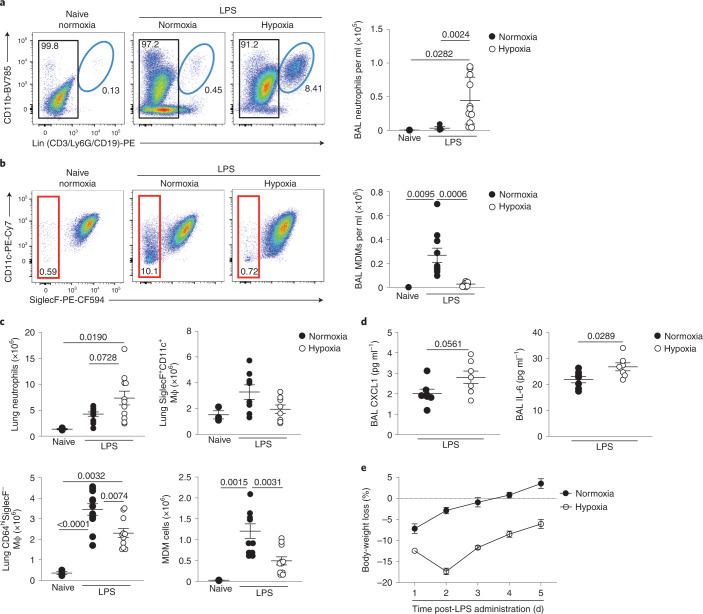
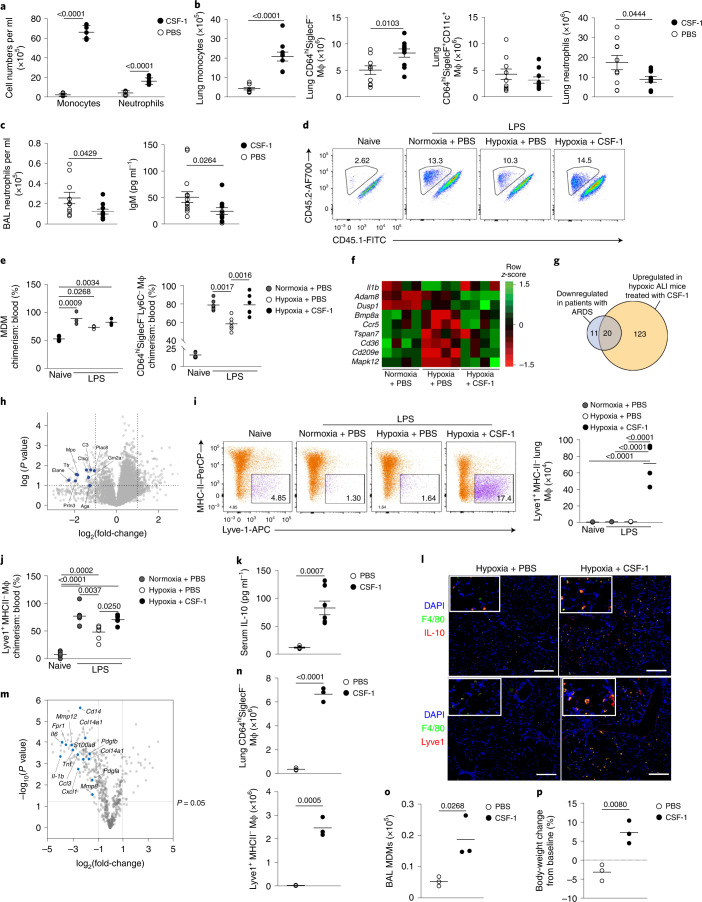
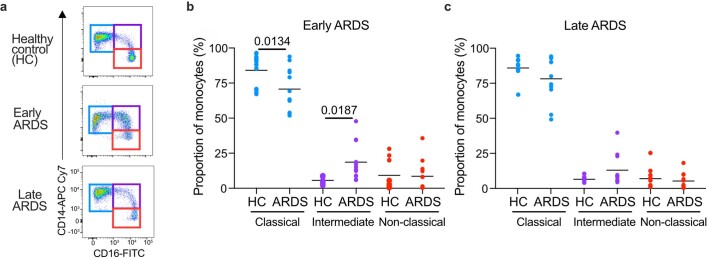
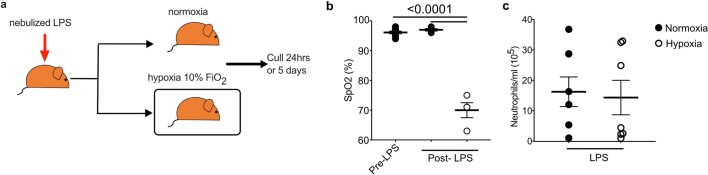
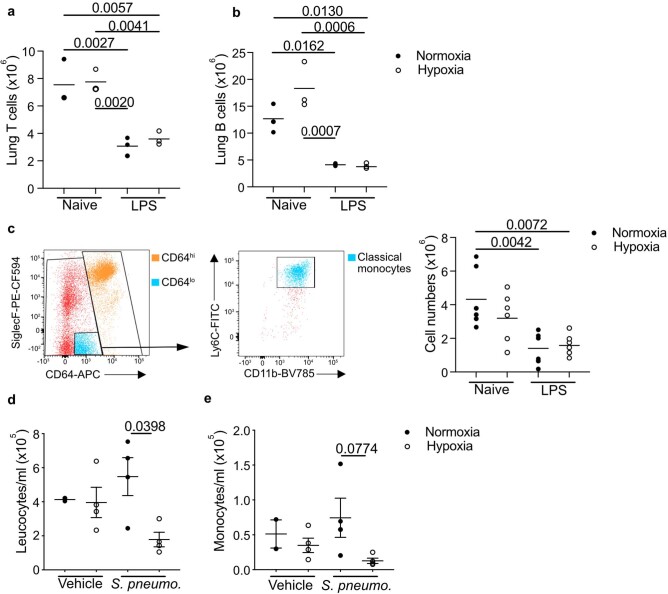
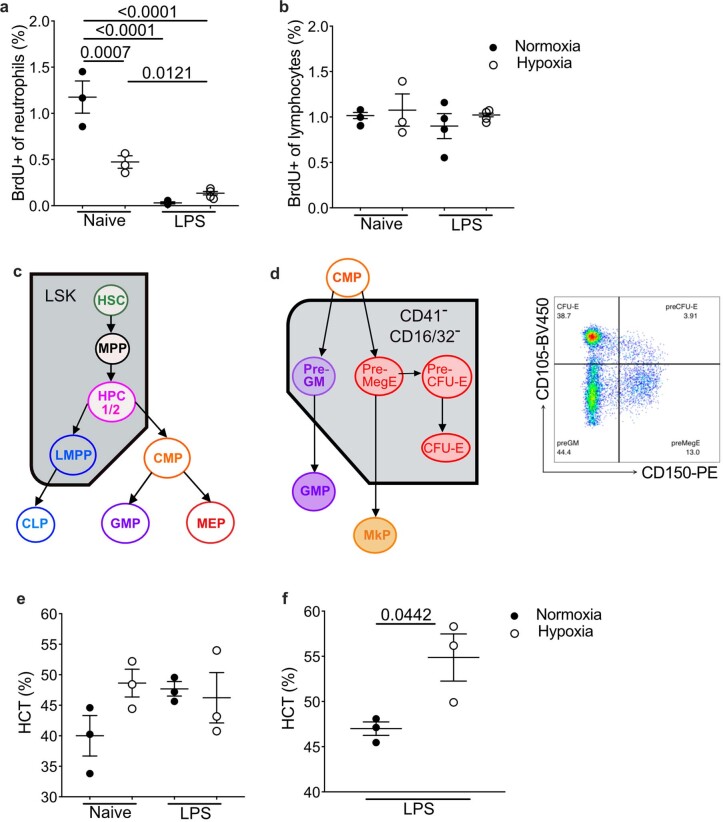
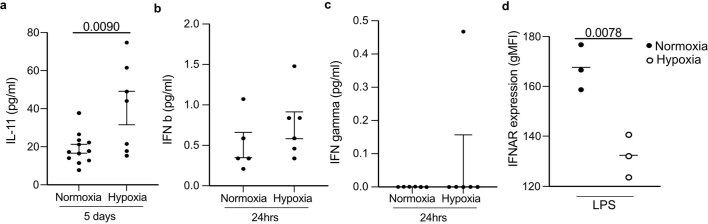
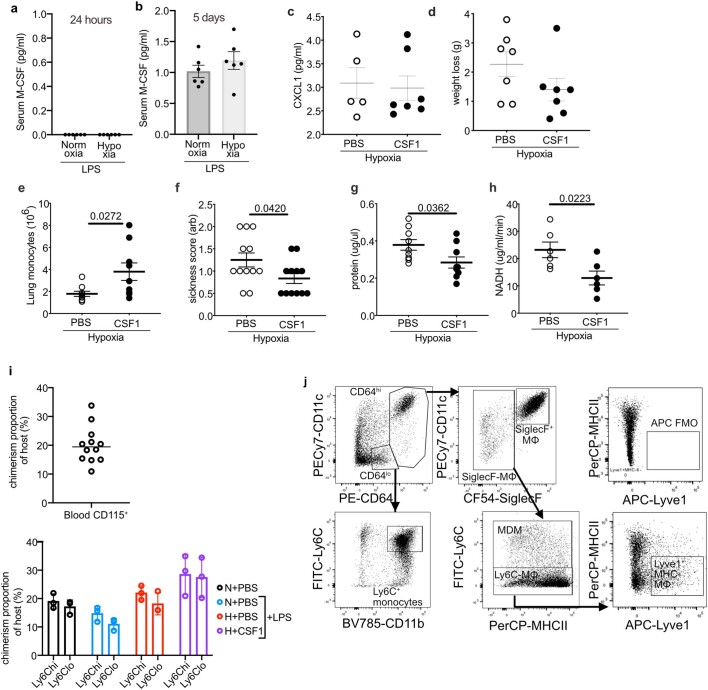
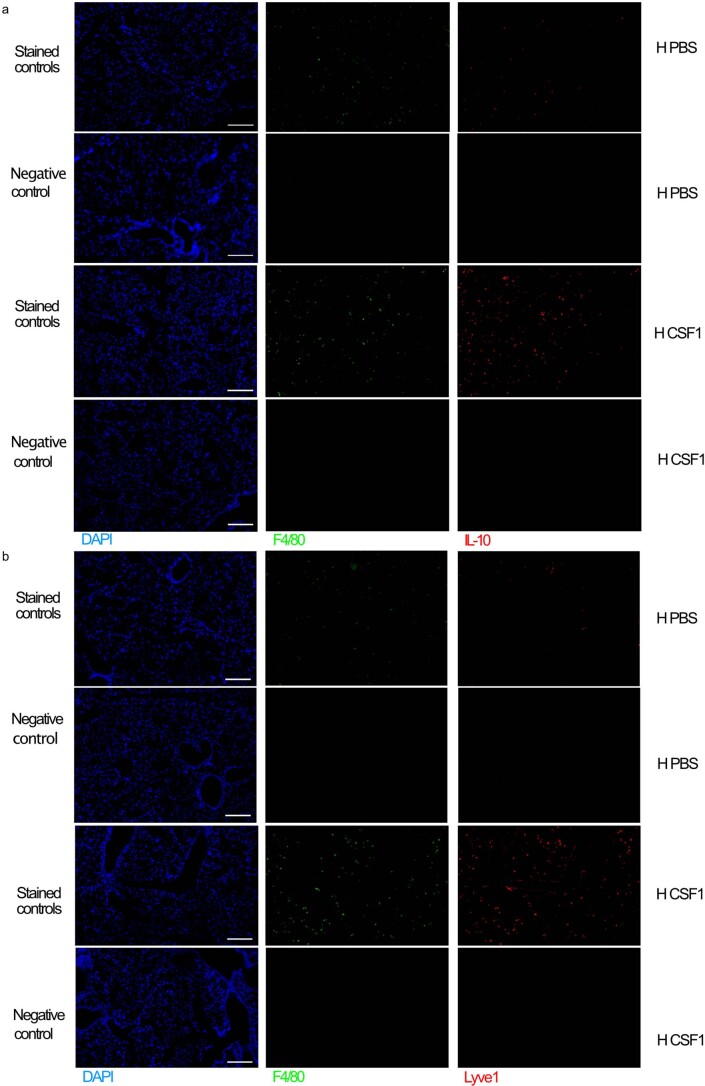
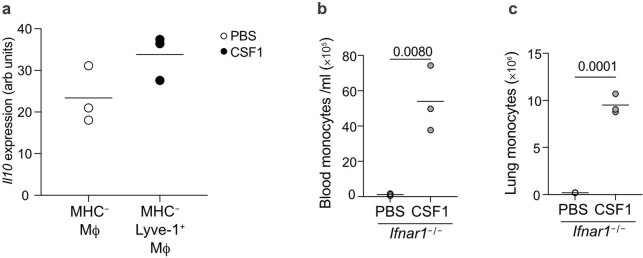
Hypoxemia is a defining feature of acute respiratory distress syndrome (ARDS), an often-fatal complication of pulmonary or systemic inflammation, yet the resulting tissue hypoxia, and its impact on immune responses, is often neglected. In the present study, we have shown that ARDS patients were hypoxemic and monocytopenic within the first 48 h of ventilation. Monocytopenia was also observed in mouse models of hypoxic acute lung injury, in which hypoxemia drove the suppression of type I interferon signaling in the bone marrow. This impaired monopoiesis resulted in reduced accumulation of monocyte-derived macrophages and enhanced neutrophil-mediated inflammation in the lung. Administration of colony-stimulating factor 1 in mice with hypoxic lung injury rescued the monocytopenia, altered the phenotype of circulating monocytes, increased monocyte-derived macrophages in the lung and limited injury. Thus, tissue hypoxia altered the dynamics of the immune response to the detriment of the host and interventions to address the aberrant response offer new therapeutic strategies for ARDS.


Conflict of interest statement

A.S.M., S.R.W., M.K.W., S.J.F. and S.J.J. have filed a patent for the use of CSF-1 as a therapy in ARDS with the University of Edinburgh (PCT/GB/2020/051184).

Figures

Fig. 1
Fig. 1. Patients with ARDS are monocytopenic early in the disease with phenotypically distinct circulating monocytes.
a,b, Lowest (a) and all (b) partial pressures of oxygen (PaO2) from clinical arterial blood samples from ARDS patients, 24 h preceding research blood sampling (green: normal range). c,d, Highest recorded FiO2 (c) and highest recorded arterial plasma lactate level within 24 h of research sampling (d) in ARDS patients (red samples: lactate ≥upper limit of normal; green: normal local reference (0.5–1.6 mmol l−1)). e, Blood leukocyte counts, monocyte proportions and monocyte counts from ARDS patients, collected within 48 h of diagnosis (early ARDS) and a healthy volunteer cohort (HC). f, Blood leukocyte count, monocyte proportions and monocyte counts from ARDS patients collected between 48 h and 7 d (late ARDS) and HC. g, Monocyte HLA-DR and CD11b expression in HC and ARDS patients. h, CD14++CD16 classical monocyte proteomic data from ARDS patients, relative to HC, for proteins associated with a human monocyte, in vitro hypoxic gene signature. i, Classical (CD14++CD16) monocyte proteome volcano plot from HC and ARDS patients. Significantly upregulated granule-associated proteins in ARDS patients versus HC (blue), a sample of known hypoxia-regulated proteins (orange). j, Classical monocytes proteinase 3, myeloperoxidase and azurocidin 1 copy numbers in HC and ARDS patients. k,l, Pearson’s correlation (k) and heatmap (l) of differentially expressed genes from HC and ARDS patient blood monocytes. Data in ac are mean ± s.d. expressed as median (e,f) or shown as mean (g,j). In a,cg and j each datapoint represents one patient/HC; in b, each datapoint represents one independent clinical sample. Statistical testing used was: unpaired, two-tailed Student’s t-test (ef and j) and Mann–Whitney U-test (g).
Fig. 2
Fig. 2. Hypoxic acute lung injury replicates early monocytopenia in mice and alters the circulating monocyte phenotype.
a, Blood leukocyte counts, monocyte counts and proportion of blood monocyte subgroups in naive or LPS-treated mice housed in normoxia or hypoxia for 24 h. b, Classical monocyte (CD115+CD11b+Ly6Chi) surface expression of ICAM, CD11a and CCR2 at 24 h post-LPS. c, Blood leukocyte counts, monocyte counts and proportions of monocyte sub-populations in naive or LPS-treated mice housed in normoxia or hypoxia for 5 d post-LPS. d, Differentially expressed genes in circulating classical monocytes from LPS-treated mice housed in normoxia or hypoxia for 5 d. Data represent the mean ± s.e.m. Data for a and c are pooled from two independent experiments. b is representative of 2 experiments (n=3-4/ group). Each datapoint represents an individual mouse. Statistical testing: one-way ANOVA with Tukey’s multiple comparison test (a and b).
Fig. 3
Fig. 3. Systemic hypoxia hampers expansion of the CD64hiSiglecF macrophage niche in ALI and S. pneumoniae infection.
a, Representative lung immunofluorescence HIF-1α and DAPI expression from LPS-challenged mice, housed in normoxia or hypoxia for 24 h. Scale bar, 50 μm. b, Absolute numbers of live lung neutrophils in naive or LPS-challenged mice housed in normoxia (N) or hypoxia (H) for 24 h (n = 6 per group). c, Representative dot plots of the CD64hi macrophage compartment (top), CD64hiSiglecF+CD11c+ AMs (middle) and Ly6C and MHC-II expression by CD64hiSiglecF macrophages (bottom) in mice as in b. d, Absolute number of CD64hi macrophages (Mφ), CD64hiSiglecF+CD11c+ AMs, Ly6CMHC-II+ lung macrophages and CD64hiSiglecFLy6C+ MDMs as in b. e, BAL CCL2 levels from LPS-challenged mice housed in normoxia or hypoxia for 24 h. f, Frequencies of neutrophils among total lung leukocytes, of CD64hiSiglecF macrophages among lung CD64hi macrophages and MDMs among CD64hiSiglecF macrophages in mice inoculated with S. pneumoniae (n = 6 per group) or vehicle control (Veh, n = 4 per group) and housed in normoxia or hypoxia until 24 h post-inoculation. g, Representative plots of CD64hiSiglecF macrophages in mice as in f. h, Frequency of lung CD64hiSiglecF macrophages among total leukocytes, absolute numbers of lung CD64hiSiglecF macrophages, proportion of BAL MDMs and absolute numbers of BAL MDMs in naive or LPS-challenged mice housed either in normoxia or hypoxia for 48 h or for 24 h in hypoxia, followed by 24 h of normoxia (hypoxia to normoxia) (n = 3 per group). Data represent the mean ± s.e.m. Data in a represent n = 3 per group; data in be are pooled from two independent experiments; data in g represent two independent experiments. Each datapoint represents an individual mouse. Statistical testing for b,d,f and h is by one-way ANOVA with Tukey’s multiple comparison test and for e by unpaired, two-tailed Student’s t-test.
Fig. 4
Fig. 4. Systemic hypoxia alters BM hematopoiesis toward increased erythropoiesis.
a, Representative dot plots gated on live CD45+Lin(CD3/CD19/Ly6G)CD115+Ly6Chi cells and proportion of BrdU+ monocytes in naive or LPS-challenged mice housed in normoxia or hypoxia for 24 h and pulsed with BrdU for the last 12 h (naive, n = 5–6; LPS treated, n = 8 in). b, Absolute numbers of BM LSK cells, CD48+CD150 HPC-1, CD48+CD150+ HPC-2 (n = 6 per group) and LincKit+Sca1CD127CD16/32CD34+ CMPs (n = 5–6 group) in mice as in a. c, Proportion of BM pre-GMs, pre-Meg-E, pre-CFU-E and CFU-E CD41CD32/16 cells in mice as in a (n = 6 per group). d,e, Representative UMAP analysis of BM cells gated on live CD45+LineageSca1C-Kit+CD41CD32/16 cells (d) and summary data of proportions of pre-GM and CFU-E cells (e) measured in the BM of mice treated with LPS and housed in normoxia (N) or hypoxia (H) for 5 d (n = 6 per group). Data are shown as the mean ± s.e.m. Each datapoint represents an individual mouse. Data in ae are pooled from two independent experiments. Statistical testing: for ac is by one-way ANOVA with Tukey’s multiple comparison test and for e by unpaired, two-tailed Student’s t-test.
Fig. 5
Fig. 5. Hypoxia regulates type I IFN responses, hindering lung CD64hiSiglecF macrophage expansion in response to LPS.
a,b, Serum EPO levels in mice challenged with LPS and housed in normoxia or hypoxia for 24 h (n = 9 normoxia, n = 7 hypoxia) (a) or 5 d (n = 7 per group) (b). c, Serum IFN-α in in mice challenged with LPS and housed in normoxia or hypoxia for 24 h (n = 6 per group). d, Proportion of LSK cells in the BM of WT or Ifnar1−/− mice 24 h post-LPS challenge (n = 4 per group). e, Manual gating of erythroid precursors and granulocyte/macrophage progenitors (GMPs) in LSK cells displayed on UMAP projection in mice as in d. f, Representative expression of CD32/16 (GMP marker) and CD150/CD105 (erythroid progenitor-associated markers) in LSK cells from mice as in d using the Pronk gating strategy displayed on UMAP projection. g, Proportion of erythroid progenitor cells (combined MEPs, pre-CFU-E and CFU-E cells) in WT and Ifnar1−/− BM 24 h post-LPS (n = 4 per group). h, Peripheral RBCs (n = 10 WT, n = 8 knockout) and monocyte counts at day 5 post-LPS in WT and Ifnar1−/− mice. i, Neutrophils, CD64hiSiglecF+CD11c+ macrophages, CD64hiSiglecF macrophages and MDM numbers in the lungs of WT and Ifnar1−/− mice 24 h post-LPS. j, Representative HIF-1α and DAPI expression in the femoral BM in mice challenged with LPS and housed in normoxia (N LPS) or hypoxia (H LPS) for 24 h. Scale bar, 20 μm. k, IFNAR expression in the BM LSK in naive (n = 5–6 per group) or LPS-treated mice (n = 6 per group) housed in normoxia or hypoxia for 24 h. l, Fold change in Quantitative PCR of Irf8, Irf1 and Ccr5 expression (normalized to actin-β, relative quantification) in BM cells from naive mice cultured in normoxia or hypoxia for 4 h ± IFN-β (n = 3 per group) relative to untreated normoxia control. Data represent the mean ± s.e.m. All datapoints represent individual mice. Statistical testing for a–d and gi was by unpaired, two-sided Student’s t-test, for k by one-way ANOVA with Tukey’s multiple comparison test and for l by two-way ANOVA with Šídák's multiple comparison post-test. The data in ac and di represent two independent experiments, and represent n = 3 per group in j and two independent pooled experiments in l.
Fig. 6
Fig. 6. Ongoing CD64hiSiglecF macrophage expansion failure is associated with inflammation persistence in hypoxic ALI.
a,b, Representative dot plots and absolute numbers of BAL neutrophils (a) and CD45+Ly6GCD64hiSiglecF MDMs gated on CD45hi cells (b) in mice treated with LPS and housed in normoxia or hypoxia for 5 d. c, Lung neutrophils, CD64hiSiglecF+CD11c+ macrophages, CD64hiSiglecF macrophages and CD64hiSiglecFLy6C+ MDM numbers in LPS-challenged mice housed in normoxia or hypoxia for 5 d. d, BAL CXCL1 and IL-6 levels in mice treated with LPS and housed in normoxia (N) or hypoxia (H) for 5 d (n = 6 N LPS, n = 7 H LPS). e, Daily weight changes from baseline in LPS-challenged mice housed in normoxia or hypoxia for 5 d (n = 4 per group). Data are shown as the mean ± s.e.m. Each datapoint represents an individual mouse. Statistical testing for ac was by one-way ANOVA with Tukey’s multiple comparison test and for d by unpaired, two-tailed Student’s t-test. Data in ac were pooled from three independent experiments and in d from two independent experiments.
Fig. 7
Fig. 7. CSF-1 rescues the hypoxic monocytopenia driving inflammation resolution.
ac, Monocyte and neutrophil counts in the blood (a), monocyte, CD64hiSiglecF macrophage, CD64hiSiglecF+ CD11c+ macrophage and neutrophil counts in the lung (b), and absolute numbers of neutrophils and IgM titers in the BAL (c) in hypoxic LPS-challenged mice treated with four daily injections of PBS or CSF-1–Fc. d,e, Representative lung CD64hiSiglecFLy6C+ MDM CD45.2 and CD45.1 expression (d) and CD64hiSiglecFLy6C+ MDM:blood monocyte chimerism and CD64hiSiglecFLy6C macrophage:blood monocyte chimerism (e) in lung-protected, naive or LPS-challenged mice that are normoxia or hypoxia housed and treated with PBS or CSF-1–Fc. f, Differentially expressed genes in PBS- or CSF-1–Fc-treated, LPS-challenged mice in Ly6Chi blood monocytes at day 5 post-LPS challenge. g, Overlap between differentially downregulated genes in ARDS blood monocytes and genes upregulated in CSF-1–Fc-treated mice relative to PBS-treated mice. h, Comparison of Ly6Chi blood monocyte proteomes from hypoxic, LPS-challenged, CSF-1–Fc-treated mice relative to the PBS-treated counterparts (granule-associated proteins identified). i, Representative Lyve1 expression and number of lung CD64hiSiglecFLy6CLyve1+MHC-II macrophages in naive or LPS-challenged mice housed in normoxia or hypoxia and treated with PBS or CSF-1–Fc for 5 d. j, Chimerism of CD64hiSiglecFLy6CLyve1+MHC-II macrophages to blood monocytes in lung-protected, LPS-challenged chimeras housed in normoxia or hypoxia, treated with PBS or CSF-1–Fc. k,l, Serum IL-10 (k) and representative tiled immunofluorescence of lung sections stained for F4/80, IL-10 and DAPI (l), and F4/80, Lyve1 and DAPI in LPS-challenged mice housed in hypoxia for 5 d and treated with CSF-1–Fc or PBS. Scale bar, 200 μm. m, Differentially regulated genes in CD64hiSiglecFLyve1+MHC-II macrophages from LPS-challenged, CSF-1–Fc-treated mice relative to CD64hiSiglecFMHC-II macrophages from PBS-treated counterparts, housed in hypoxia for 5 d. np, Total lung CD64hiSiglecF macrophages and CD64hiSiglecFLy6CLyve1+MHC-II macrophages (n), BAL MDMs (o) and body-weight change (relative to baseline) (p) in LPS-challenged Ifnar1−/− mice treated with PBS (Ifnar1−/− PBS) or CSF-1–Fc (Ifnar1−/− CSF-1) for 5 d. Data represent the mean ± s.e.m. Each datapoint represents an individual mouse. Statistics for b,c,k and np were by unpaired, two-sided Student’s t-test, for i and j by a one-way ANOVA with Tukey’s post-test and for e by a two-tailed Mann–Whitney U-test following D’Agostino and Pearson’s normality test. For b and c data are pooled from three independent experiments, and for f,k,j and np data are pooled from two independent experiments. In g all genes have a fold-change >1, except H2-DMa, H2-DMb2, IL-17Ra and Nlrp3 where the fold-change is >0.5 and P < 0.05.
Extended Data Fig. 1
Extended Data Fig. 1. Monocyte sub-populations are altered early in ARDS.
(a) Representative plots and proportions of monocyte sub-populations based on CD14 and CD16 expression early and (b) late (c). Each data point = one individual patient/ healthy donor control (HC), b, c Data+mean, one-way ANOVA with Holm-Sidak post-test.
Extended Data Fig. 2
Extended Data Fig. 2. A hypoxic environment induces hypoxaemia with equivalent circulating neutrophil.
(a) Schematic of normoxic and hypoxic LPS-induced ALI. (b) Oxygen saturations in mice were measured in mice at baseline pre-LPS nebulisation (pre-LPS) and 6 hours post-LPS (N LPS- mice housed in normoxia post-LPS, H LPS- mice housed in hypoxia post-LPS). (Pre-LPS n = 6, N LPS n = 3, H LPS n = 3). (c) Blood was collected from mice treated with LPS and placed in normoxia (N LPS) or hypoxia 10% (H LPS) for 5 days and circulating neutrophils quantified by flow cytometry (Live Singles CD45+Ly6G+CD11b+). b, c Each data point represents an individual mouse. Data shown as mean±SEM. c two pooled independent experiments. Statistical testing performed using one-way ANOVA with Tukey’s multiple comparisons test.
Extended Data Fig. 3
Extended Data Fig. 3. T cell and B cells are equivalent post-LPS and Streptococcus pneumoniae infection in hypoxia leads to leukopenia and monocytopenia.
T cells (a) (Live, singles, CD45+, Lin+ (CD3/CD19/Ly6G) MHCII CD11b) and B cells (b) (Live, singles, CD45+, Lin+ (CD3/CD19/Ly6G) MHCII+ CD11b) were quantified in lung digests from mice housed in normoxia (N) or 10% FiO2 hypoxia (H) for 24 hours, left naïve or nebulised with LPS. Mice were inoculated with Streptococcus pneumoniae (Strep) or vehicle (Veh) intratracheally (i.t.) and housed in normoxia (N) or hypoxia (H) until 24 hours post-i.t. (c) Representative dot plots of gating strategy for classical monocytes in the lung gated on Singles Live CD45 + Lin- lung cells and associated counts in the lung 24 hours post-LPS challenge and housed in normoxia (N) and hypoxia (H). Blood cell counts and (c) monocyte counts mice challenged with vehicle or strep pneumoniae and housed in normoxia (N) or hypoxia (H) for 24 hours. Each point represents and individual mouse. Data shown as mean±SEM. Statistical testing performed using one-way ANOVA with Tukey’s multiple comparisons test.
Extended Data Fig. 4
Extended Data Fig. 4. Impact of hypoxia on bone marrow cell egress and composition.
(a) BrdU+ blood lymphocytes (CD3 and CD19+) and (b) BrdU+ blood neutrophil proportion in mice treated with LPS and housed in normoxia (N) and hypoxia (H) for 24 hours (Naïve N and H n = 3, LPS N and H n = 4). Data representative of 2 experiments (c) Schematic showing hematopoietic hierarchy with LinScaC-Kit+ (LSK) compartment and progenitors (HSC-hematopoietic stem cell, MPP- multipotent progenitor, HPC- hematopoietic progenitors, CMP- common myeloid progenitor, LMPP- lymphoid-primed multipotent progenitor, CLP- common lymphoid progenitor, GMP- granulocyte/monocyte progenitor, MEP-Megakaryocyte/erythrocyte progenitor). (d) Schematic showing erythrocytosis and monopoiesis (Pre-GM-pre-granulocyte/monocyte precursor, Pre-MegE - megakaryocyte-erythrocyte precursor, Pre-CFU-E - pre-colony forming unit erythroid, CFU-E - Colony forming unit erythroid, GMP – granulocyte-monocyte precursor, MkP- megakaryocyte precursor) gating strategy for bone marrow common myeloid progenitor progeny on CD41CD16/32 cells. (e) Blood hematocrit at 24 hours (n = 3/ group, data representative of 2 experiments) or (f) 5 days in mice treated with LPS and housed in normoxia (N) and hypoxia (H) (n = 3/group, data representative of 2 experiments) was measured. a, b Mean±SD. Statistical testing performed using one-way ANOVA with Tukey’s multiple comparisons test, e, f Mean±SD. f, statistical testing performed using unpaired two-sided t-test.
Extended Data Fig. 5
Extended Data Fig. 5. Hypoxia elevates circulating IL-11 levels without altering IFN beta and IFN gamma levels and reducing IFNAR expression in circulating classical monocytes.
(a) Serum IL-11, (b) IFN beta and (c) IFN gamma level mice treated with nebulised LPS and housed in normoxia (N) or hypoxia (H), for 24 hours or 5 days (as indicated on figure), were measured by ELISA as per manufacturers’ instructions. Data mean±SEM. Each data point represents an individual mouse. (d) IFNAR expression was measured by flow cytometry in classical blood monocytes in mice treated with nebulized LPS and housed in either normoxia (N LPS) or hypoxia (H LPS) for 24 hours. a, d, Statistical testing unpaired two-sided t-test.
Extended Data Fig. 6
Extended Data Fig. 6. Circulating CSF1 is unchanged in hypoxic ALI and exogenous CSF1 improves injury outcomes altering the CD64hiSiglecF Mϕ phenotype.
Serum MCSF (CSF1) from LPS-challenged mice housed in normoxia (N) or hypoxia (H) for 24 hours (a) or 5 days (b) was measured. (c) BAL CXCL1 measured in LPS-challenged mice housed in hypoxia for 5 days and treated with PBS or CSF1-Fc (H CSF1). (d) weight loss from baseline in hypoxic LPS-induced ALI treated with PBS (H PBS) or CSF1-Fc (H CSF1). (e) Lung monocyte numbers, (f) arbitrary sickness scores, (g) BAL protein and (h) LDH activity (as measured by NADH) measured at 48 hours in mice with virally-induced ALI housed in hypoxia and treated with PBS or CSF1-Fc (H CSF1). (i) Baseline blood chimerism (proportion of donor cells relative to host) of circulating monocytes in lung-protected chimeras prior to ALI induction and chimerism of monocytes based on Ly6C expression post-LPS. (j) Lung cDC1 (gated on Alive CD45+Lin-CD64CD11c+Cd103+) chimerism and counts and (k) cDC2 (gated on Alive CD45+Lin-CD64CD11c+Cd103 CD11b+) chimerism and counts. Chimerism relative to blood monocyte chimerism. (l) Il10 expression was measured by NanoString platform analysis in MHC-lung macrophages from LPS-challenged mice housed in hypoxia for 5 days and treated with PBS and compared to Lyve1+MHCII- of LPS-challenged mice, housed in hypoxia and treated with CSF1-Fc. (m) Representative dot plots of lung digests showing gating strategy for identification of the different monocyte and macrophage populations in the lung gated on Live Singles CD45+Ly6G cells, and including Lyve1+MHC-CD64hiSiglecFMϕ, and associated APC FMO control including Lyve1+MHC-CD64hiSiglecFMϕ, and associated APC FMO control. Ifnar−/− (KO) mice were nebulised with LPS and treated with PBS (KO PBS) or CSF1-Fc (KO CSF1). Mice were sacrificed on day 5 and (n) blood monocyte and (o) lung Ly6C+ monocytes were quantified by flow cytometry. c, d Mean±SD, e-h mean±SEM. c-h, j, k 2 pooled experiments, l representative of 3 experiments, n, o representative of 2 experiments. Statistical testing e-h, n, o unpaired two-sided t-test, k, one-way ANOVA with Tukey’s multiple comparisons test.
Extended Data Fig. 7
Extended Data Fig. 7. Lung immunohistochemistry tiled separate-channel images with negative controls.
(a, b) Representative images of separate channels for stained tissue and negative controls (no primary antibody) for the indicated antibodies in lung sections from mice housed in hypoxia post-LPS and treated with either PBS or CSF1 as indicated (n = 3/ group). Scale bar represents 200μm.
Extended Data Fig. 8
Extended Data Fig. 8. Treatment with CSF-1-Fc elevates II10 expression in Lyve1+MHCII macrophages and increases blood and lung monocyte numbers in Ifnar1–/– mice.
(a) II10 expression was measured by NanoString platform analysis in MHC lung macrophages from LPS-challenged mice housed in hypoxia for 5 days and treated with PBS and compared to Lyve1+MHCII of LPS-challenged micehoused in hypoxia and treated with CSF-1-Fc. (b, c) Ifnar1−/− mice were nebulized with LPS and treated with PBS or CSF-1-Fc. Mice were sacrificed on day (b) blood monocyte and (c) lung Ly6C+ monocytes were quantified by flow cytometry. (a–c) representative of 2 experiments. Statistical testing (a–c) unpaired, two-sided Student’s t-test.

Comment in

References

    1. Bellani G, et al. Epidemiology, patterns of care, and mortality for patients with acute respiratory distress syndrome in intensive care units in 50 countries. J. Am. Med. Assoc. 2016;315:788–800. doi: 10.1001/jama.2016.0291. - DOI - PubMed
    1. Fan E, et al. An official American Thoracic Society/European Society of intensive care medicine/society of critical care medicine clinical practice guideline: mechanical ventilation in adult patients with acute respiratory distress syndrome. Am. J. Respir. Crit. Care Med. 2017;195:1253–1263. doi: 10.1164/rccm.201703-0548ST. - DOI - PubMed
    1. Steinberg KP, et al. Evolution of bronchoalveolar cell populations in the adult respiratory distress syndrome. Am. J. Respir. Crit. Care Med. 1994;150:113–122. doi: 10.1164/ajrccm.150.1.8025736. - DOI - PubMed
    1. Park WY, et al. Cytokine balance in the lungs of patients with acute respiratory distress syndrome. Am. J. Respir. Crit. Care Med. 2001;164:1896–1903. doi: 10.1164/ajrccm.164.10.2104013. - DOI - PubMed
    1. Tarling JD, Lin HS, Hsu S. Self-renewal of pulmonary alveolar macrophages: evidence from radiation chimera studies. J. Leukoc. Biol. 1987;42:443–446. doi: 10.1002/jlb.42.5.443. - DOI - PubMed

Publication types

LinkOut - more resources