. 2022 Jun;23(6):971-984.
doi: 10.1038/s41590-022-01215-0. Epub 2022 May 27.

Single-cell RNA sequencing reveals evolution of immune landscape during glioblastoma progression

Affiliations

Single-cell RNA sequencing reveals evolution of immune landscape during glioblastoma progression

Alan T Yeo et al. Nat Immunol. 2022 Jun.

Abstract

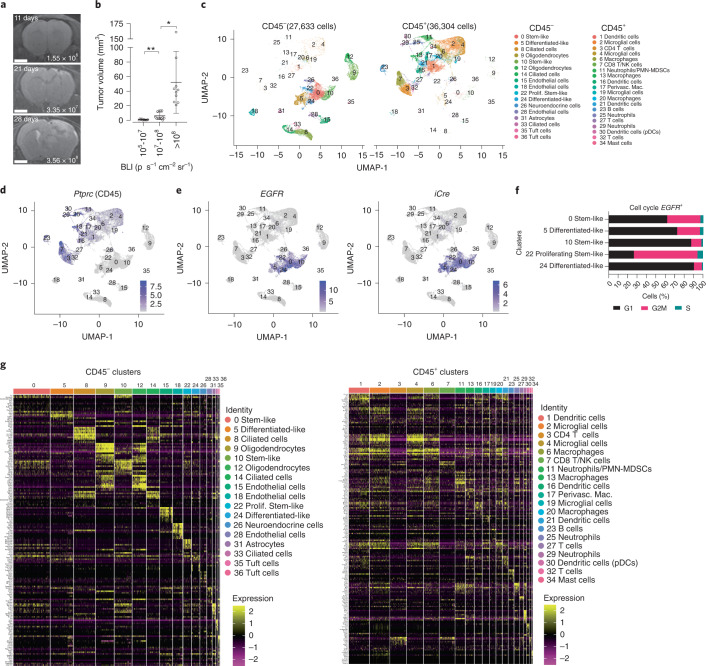
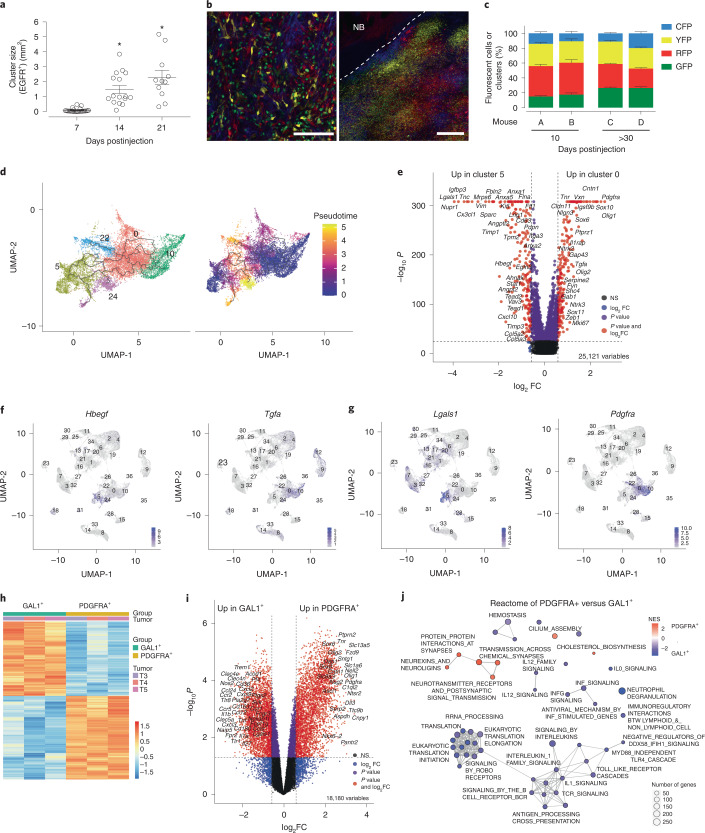
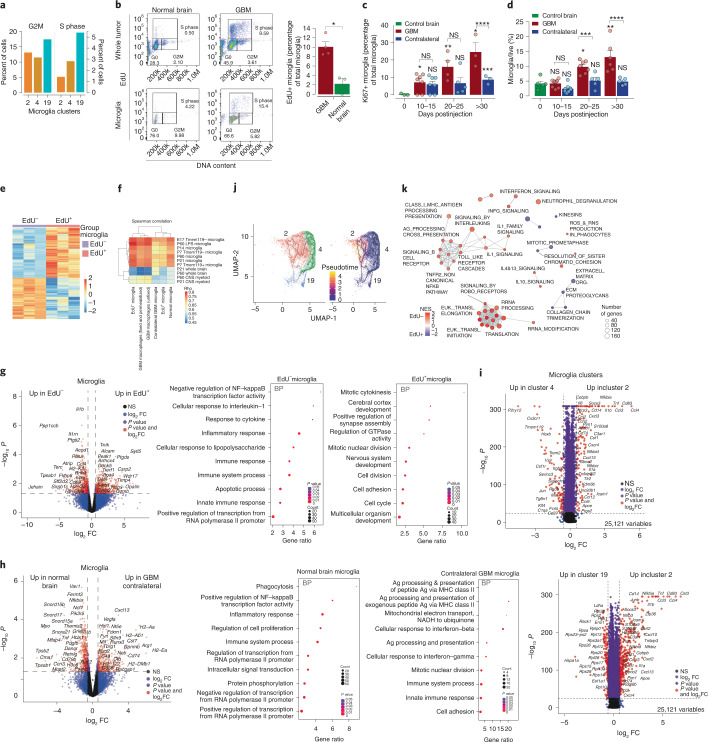
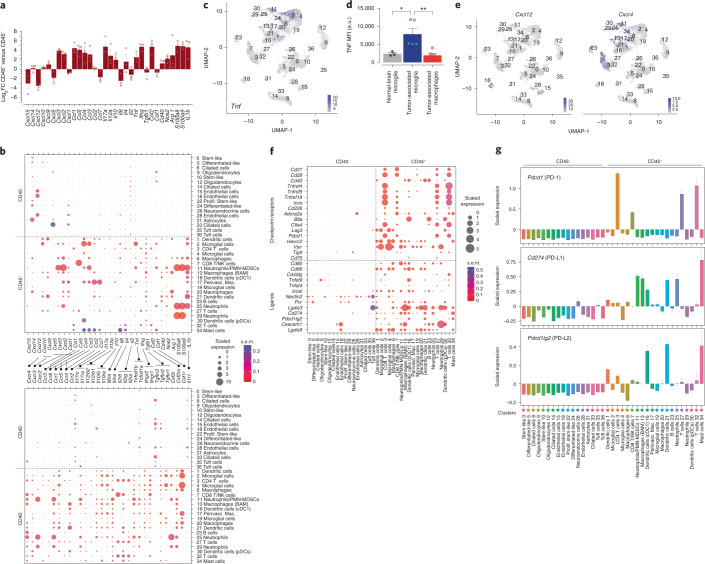
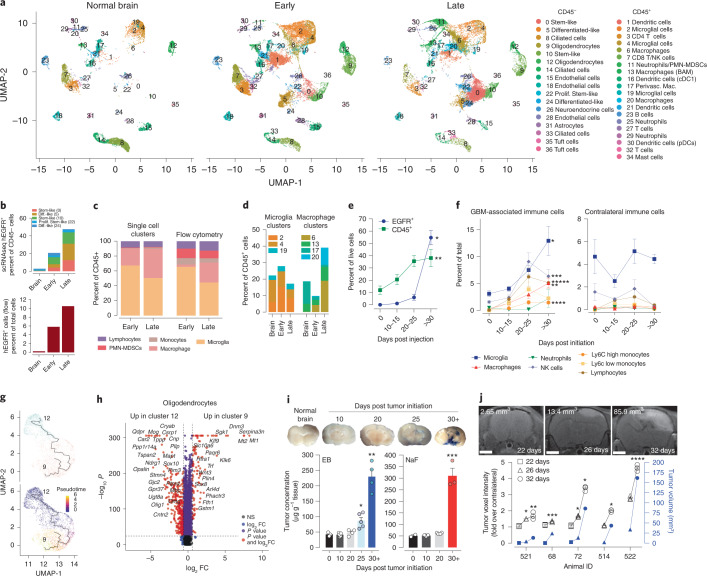
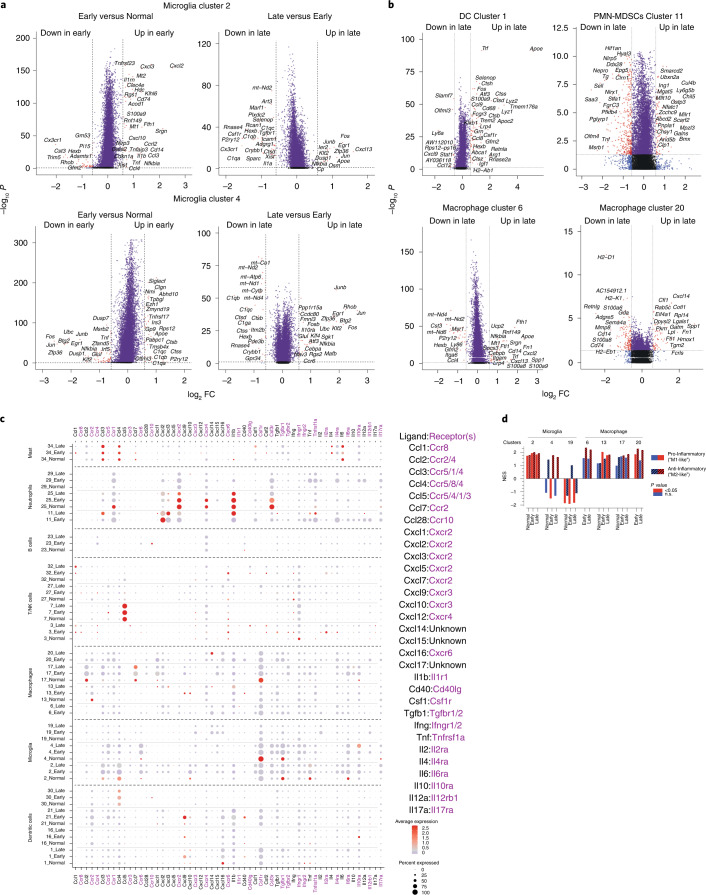
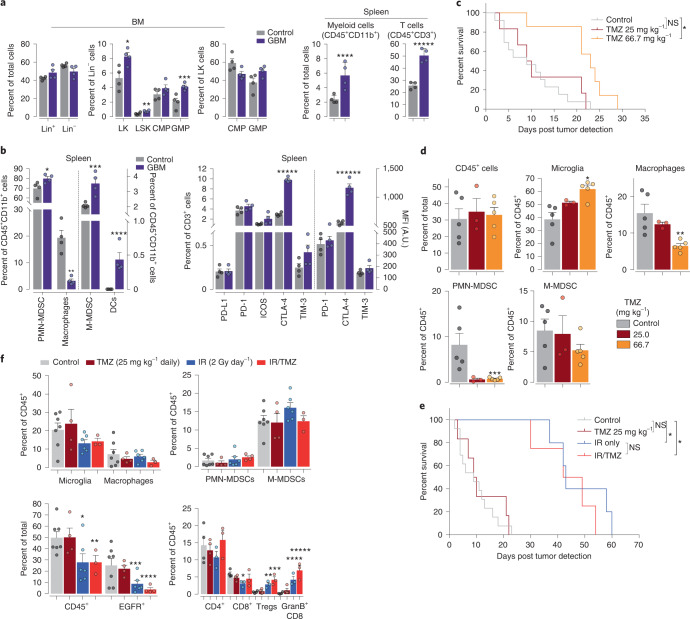
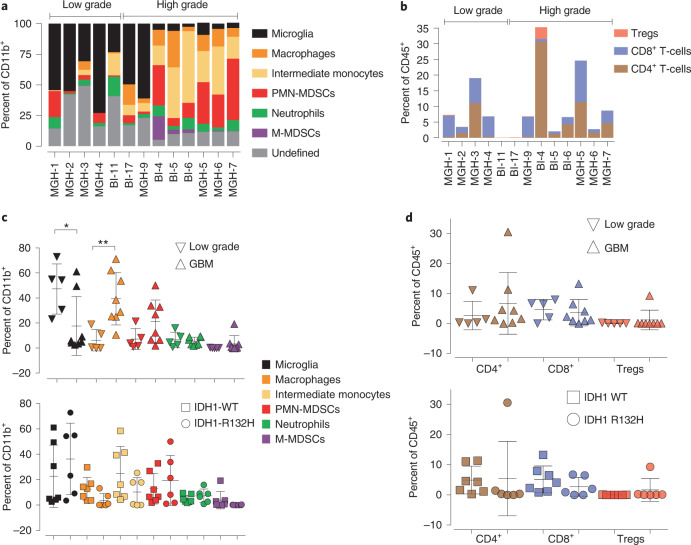
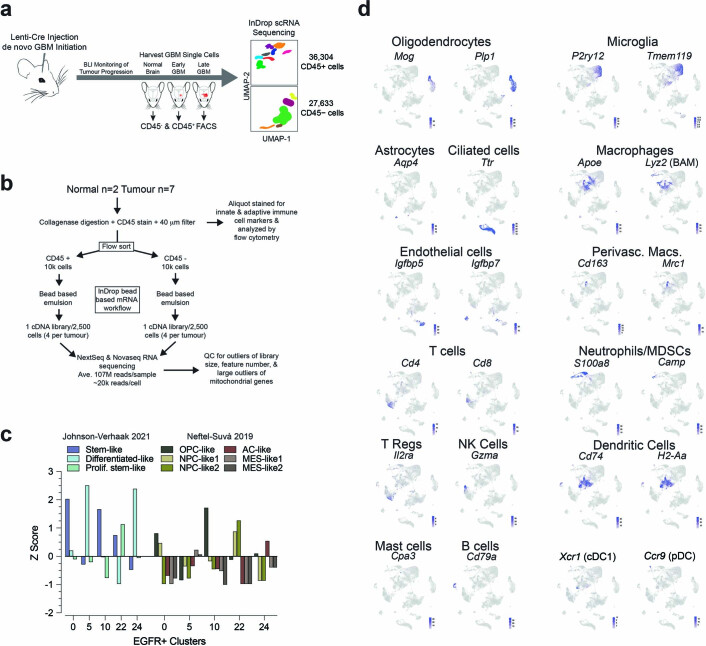
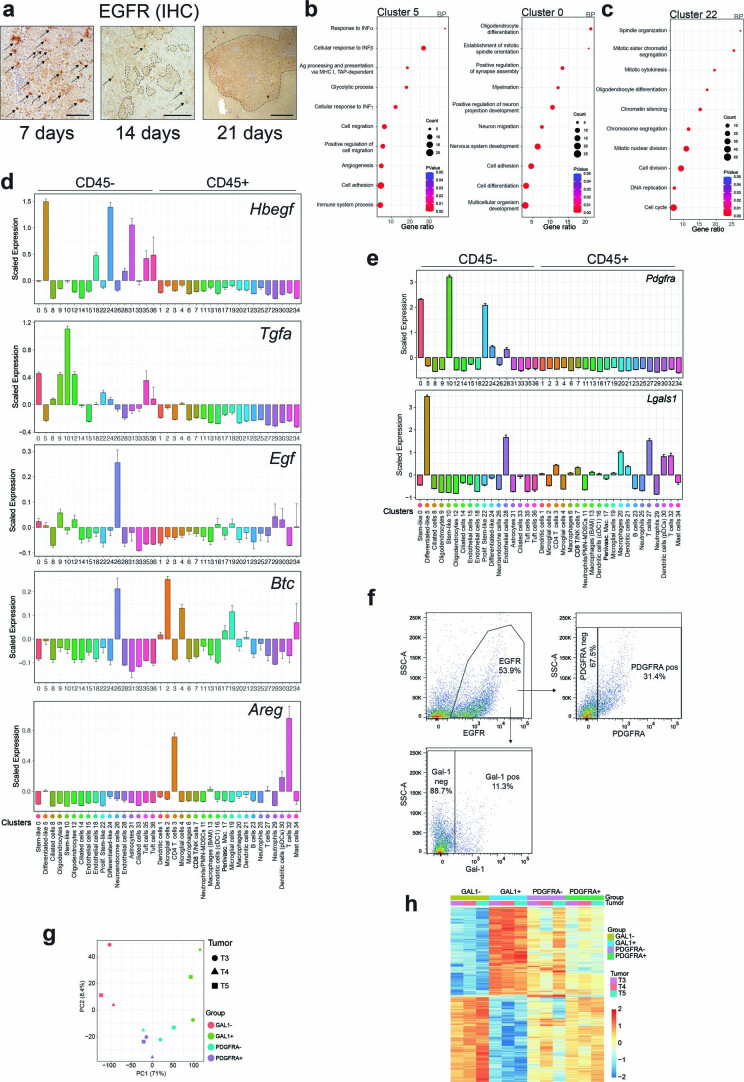
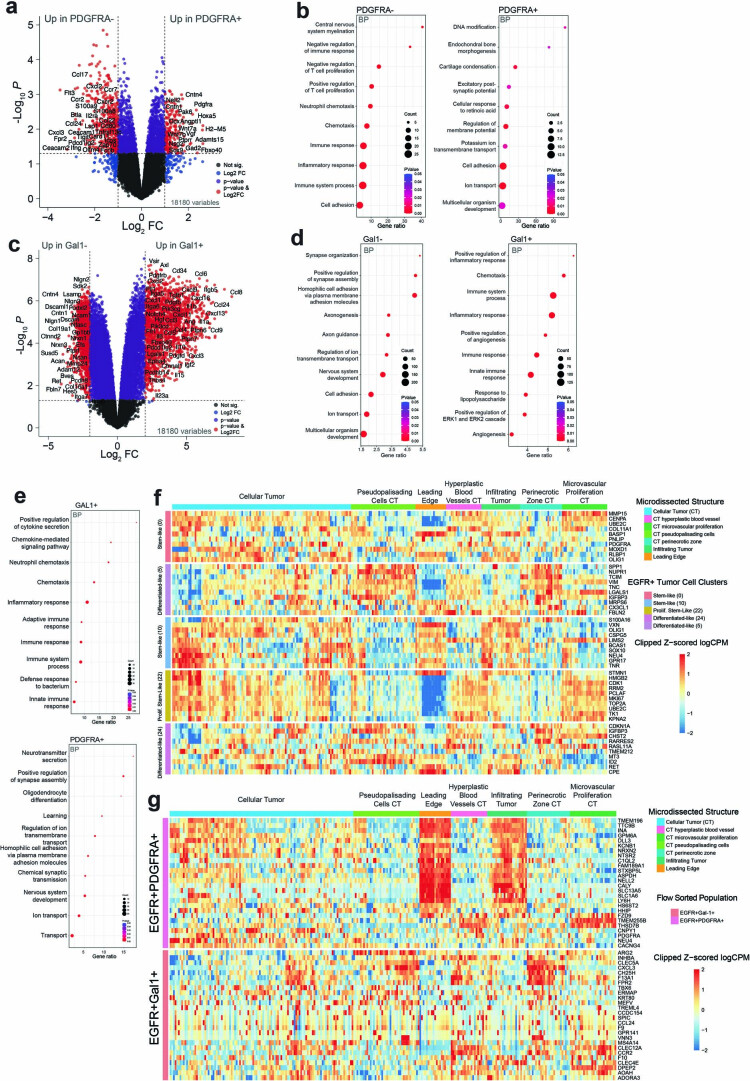
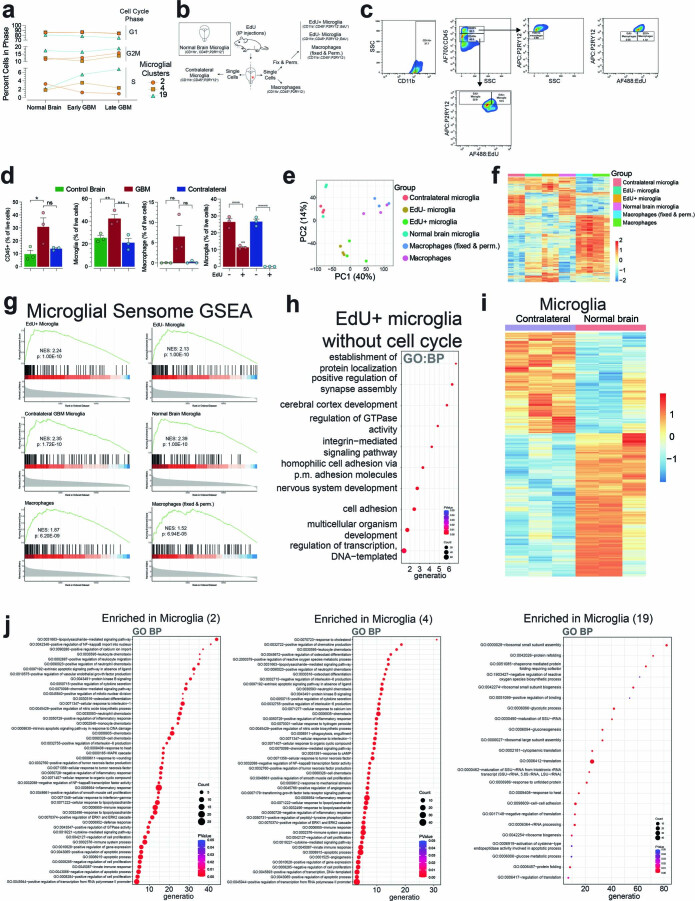
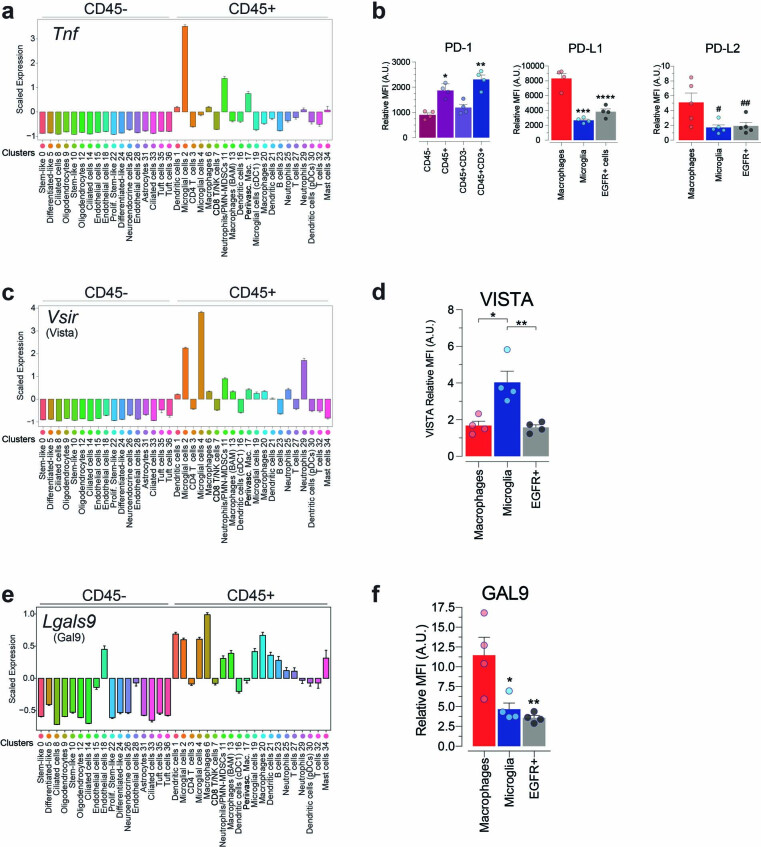
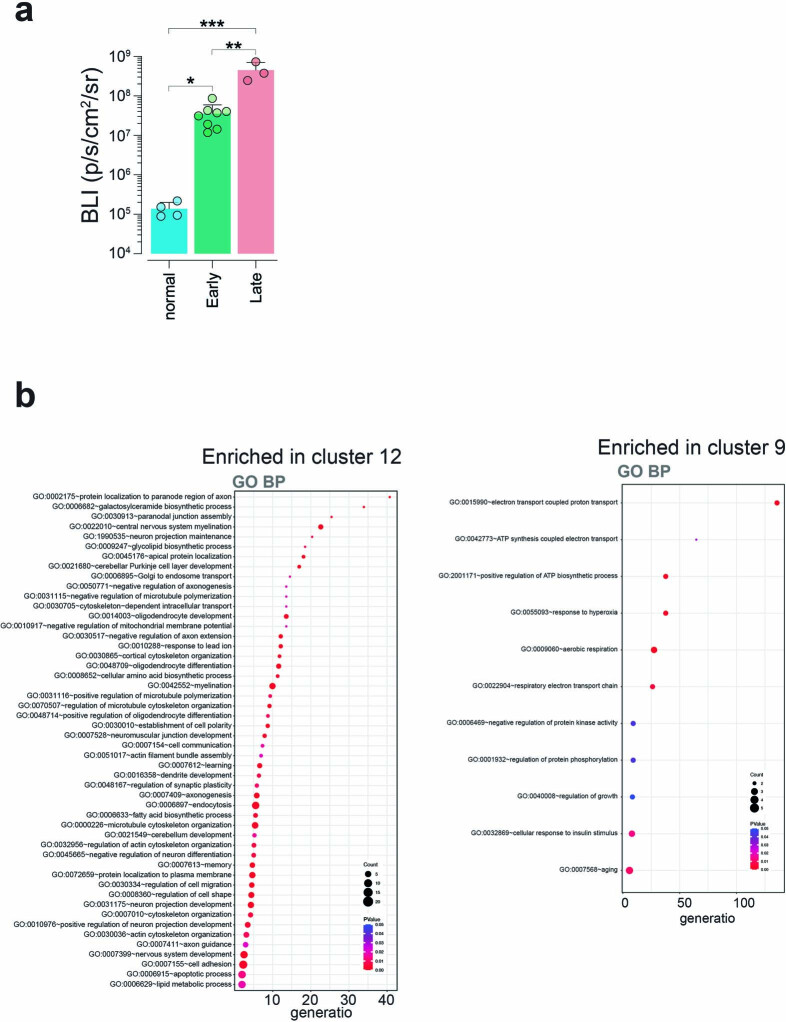
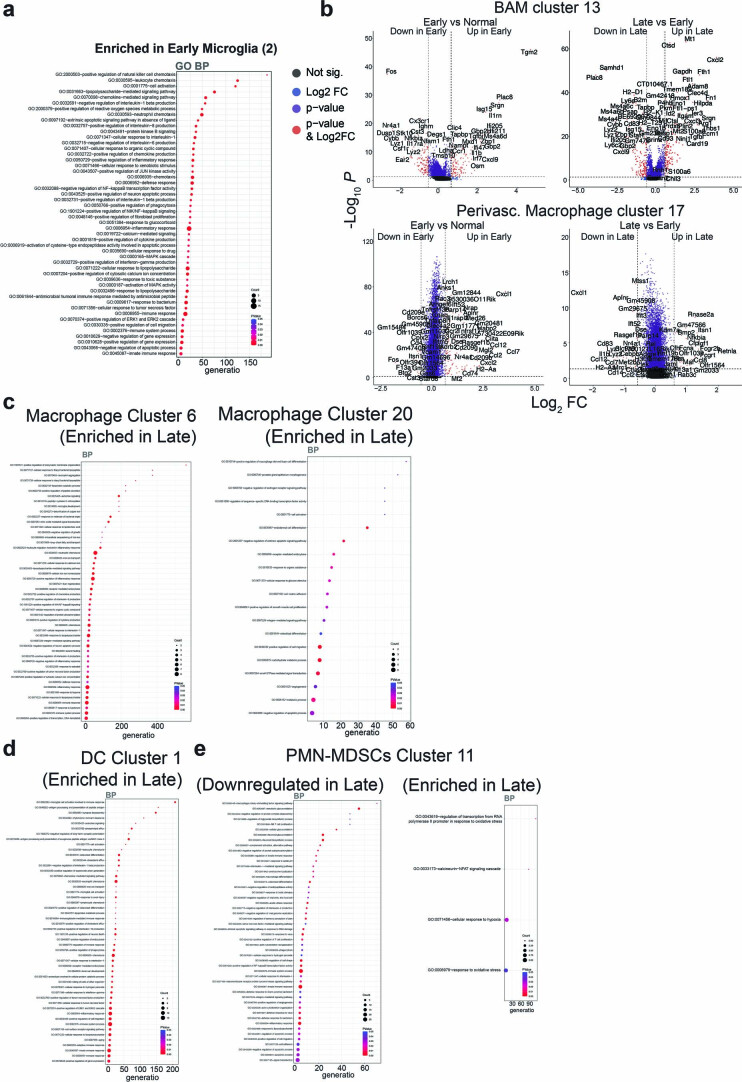
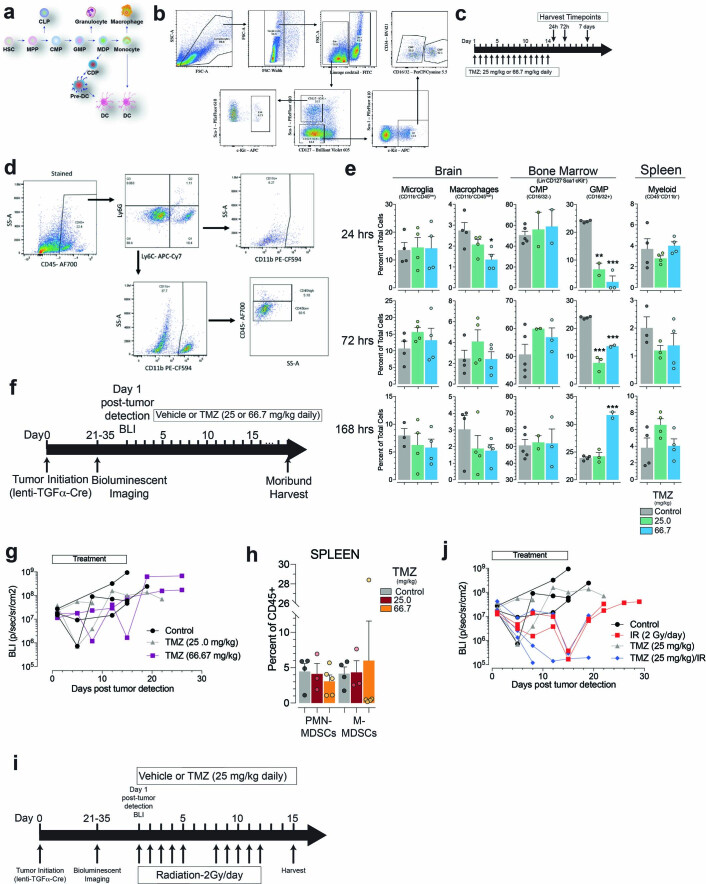
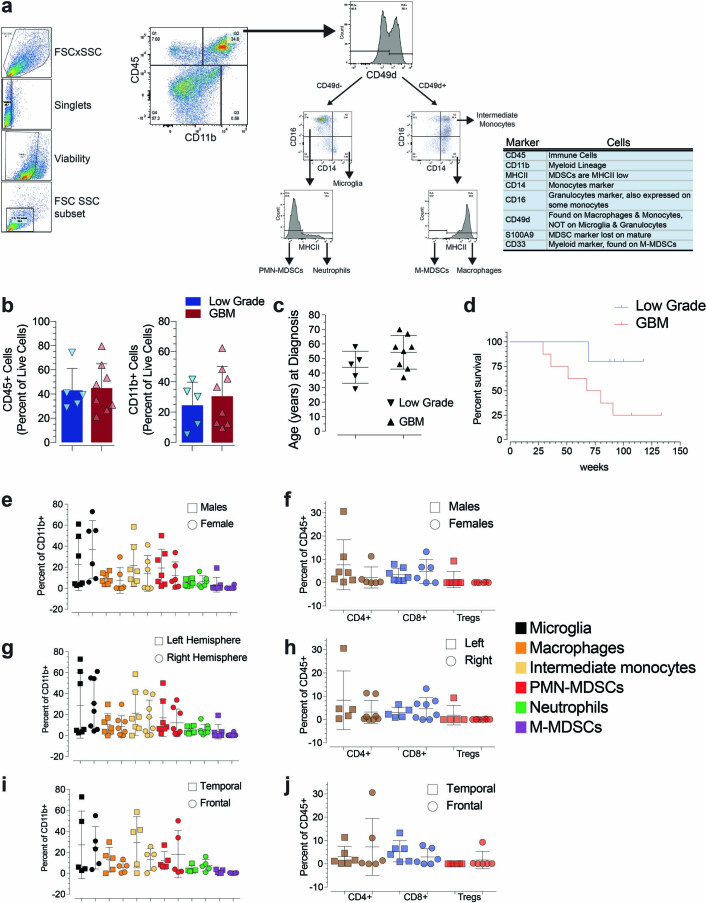
Glioblastoma (GBM) is an incurable primary malignant brain cancer hallmarked with a substantial protumorigenic immune component. Knowledge of the GBM immune microenvironment during tumor evolution and standard of care treatments is limited. Using single-cell transcriptomics and flow cytometry, we unveiled large-scale comprehensive longitudinal changes in immune cell composition throughout tumor progression in an epidermal growth factor receptor-driven genetic mouse GBM model. We identified subsets of proinflammatory microglia in developing GBMs and anti-inflammatory macrophages and protumorigenic myeloid-derived suppressors cells in end-stage tumors, an evolution that parallels breakdown of the blood-brain barrier and extensive growth of epidermal growth factor receptor+ GBM cells. A similar relationship was found between microglia and macrophages in patient biopsies of low-grade glioma and GBM. Temozolomide decreased the accumulation of myeloid-derived suppressor cells, whereas concomitant temozolomide irradiation increased intratumoral GranzymeB+ CD8+T cells but also increased CD4+ regulatory T cells. These results provide a comprehensive and unbiased immune cellular landscape and its evolutionary changes during GBM progression.


Conflict of interest statement

V.A.B. has patents on the PD-1 pathway licensed by Bristol-Myers Squibb, Roche, Merck, EMD-Serono, Boehringer Ingelheim, AstraZeneca, Novartis and Dako. The other authors declare no competing interests.

Figures

Fig. 1
Fig. 1. scRNA-seq identifies CD45 and CD45+ cell populations in GBM.
a, Representative MRIs of GBM development over time with associated BLI outputs. Scale bar, 2 mm. b, MRI–BLI, data are presented as mean values ± s.d. of biologically independent replicates, *P = 0.013, **P = 0.0045, unpaired t test, two-tailed, n = 10, 12 and 10 for BLI 105–107, 107–108 and >108, respectively. c, UMAP of cell types clustered by single-cell transcriptional analysis of brain CD45 (n = 27,633) and CD45+ (n = 36,304) cells isolated from normal and GBM mice. d,e, Expression of Ptprc (CD45) (d), human EGFR gene (EGFR) and iCre recombinase (e) transcripts overlaid on the CD45 and CD45+ UMAP space. f, Percentage of cells expressing G1, G2M and S phase markers from the indicated EGFR+ GBM cell clusters. g, Hierarchical clustering of CD45 and CD45+ cells grouped by top expression of genes. Source data
Fig. 2
Fig. 2. GBMs are composed of transcriptionally distinct populations of EGFR+ cancer cells.
a, Area (in mm2) of EGFR+ cell clusters at 7, 14 and 21 days post Cre virus injection. Data are presented as mean ± s.e.m. of biologically independent tumors, *P < 0.0001, unpaired t test, two-tailed, n = 9 (three or four sections per tumor), 16 and 11 for 7, 14 and 21 days, respectively. b, Confetti sections of a > 30 days late-stage GBM. Scale bars, left panel 100 μm, right panel 500 μm. NB, normal brain. c, Fluorescent cells (A and B) or clusters (C and D) from biologically independent mice bearing early-stage (10 days) and late-stage (>30 days) post Cre virus injection. Data are presented as mean ± s.e.m. of n = 4–6 fields of view per section and n = 4–5 sections per biologically independent tumors were quantified. d, Monocle3 trajectory inference on EGFR+ clusters. e, DEGs between EGFR+ clusters 0 and 5. NS, not significant. f, Expression of EGFR ligands Hbegf and Tgfa overlaid on UMAPs. g, Expression of Lgals1 (GAL1) and Pdgfra overlaid on UMAPs. h,i, Heat map (h) and volcano plot (i) of DEGs from bulk RNAseq of hsEGFR+PDGFRA+ and hsEGFR+GAL1+ flow-sorted cells. j, Reactome analysis of upregulated genes in hsEGFR+PDGFRA+ and hsEGFR+GAL1+ cell populations. Source data
Fig. 3
Fig. 3. Proliferative microglia are present in EGFR GBMs.
a, Expression of cell cycle genes in microglia clusters 2, 4 and 19 populations. b, EdU flow plots and quantitation of microglia. Data are mean ± s.d. of biologically independent replicates GBM n = 4, normal brain n = 3. *P = 0.028, unpaired t test, two-tailed. c, Proliferative index of GBM microglia over time. Ki67 positive microglia as percentage of total microglia. Data are mean ± s.d. of biologically independent replicates, control brain day 0 n = 3, GBM and contralateral n = 7, 4 and 3 for days 10–15, 20–25 and >30, respectively. Statistical analysis, without brackets relative to control brain microglia (day 0). *P = 0.0171; **P = 0.0104; ***P = 0.0477; ****P = 0.0039; *****P = 0.0449; NS, not significant, unpaired t test two-tailed. d, Increase in microglia content during GBM progression plotted as percentage of live cells. Data are mean ± s.d. of biologically independent replicates. Control brain day 0 n = 5, GBM n = 8, 7 and 5 and contralateral n = 8, 5 and 5 for days 10–15, 20–25 and >30, respectively. Statistical analysis, without brackets relative to control brain microglia (day 0). *P = 0.0008; **P = 0.0055; ***P < 0.0054; ****P = 0.0072; NS, not significant, unpaired t test two-tailed. e, Heat map of DEGs from bulk RNAseq of EdU+ and EdU flow-sorted microglia. f, Spearman correlation of transcriptomes of flow-sorted microglia (EdU+, EdU), macrophage and contralateral microglia to indicated bulk RNAseq datasets. g, DEGs and GO analysis between EdU+ and EdU flow-sorted microglia populations. h, DEGs and GO analysis between flow-sorted normal brain microglia and GBM-bearing contralateral microglia. i, DEGs between microglia clusters 2 and 4 and between clusters 2 and 19. j, Monocle3 trajectory inference on microglia clusters. k, Reactome analysis of EdU+ and EdU microglia populations. Source data
Fig. 4
Fig. 4. Cytokines, checkpoint receptors and their ligands are expressed mostly in the CD45+ compartment.
a, RT-PCR log2FC for the indicated cytokines from flow-sorted CD45+ and CD45 cells from GBM. Data are mean ± s.d. of biologically independent tumors n = 3. b, Scaled expression of the indicated cytokines and their receptors from the CD45 and CD45+ scRNA-seq datasets. s.e.m. indicated. The lines between the two panels represent receptor ligand pairs. c, Expression of Tnf overlaid on UMAP. d, TNF mean fluorescence intensity (MFI) expression by flow cytometry of GBM tumors. Data are mean ± s.d. of biologically independent tumors, n = 3, 5 and 5 of normal brain microglia, tumor-associated microglia and macrophages, respectively *P = 0.0472, **P = 0.0097. e, Expression of Cxcl12 and Cxcr4 transcripts overlaid on UMAPs. f, Scaled expression for the indicated checkpoint receptors and ligands from the CD45 and CD45+ scRNA-seq datasets. g, Scaled expression of Cd274 (PD-L1), Pdcd1lg2 (PD-L2) and Pdcd1 (PD-1) transcripts. Data are mean ± s.e.m. Source data
Fig. 5
Fig. 5. Dynamics of immune cell infiltration over time.
a, UMAPs of normal brain, Early and Late stage GBMs. b,c, Relative number of EGFR+ (b) and the indicated cell types (c) from scRNA-seq data and flow cytometry of the GBM samples used for scRNA-seq. d, Cluster composition of microglia and macrophages from scRNA-seq. e, Flow cytometry of EGFR+ and CD45+ cells from GBMs. Data are mean ± s.e.m. of biologically independent replicates. Control brain day 0 n = 3, GBM n = 6, 6 and 3 for days 10–15, 20–25 and >30, respectively. At >30 days relative to day 0, *P = 0.0001, **P = 0.0285, unpaired t test two-tailed. f, Longitudinal flow cytometry of the indicated GBM cell types. Data are mean ± s.e.m. of biologically independent replicates. Left panel, control brain day 0 n = 3, GBM n = 8, 8 and 9 for days 10–15, 20–25 and >30, respectively, *P = 0.0122, **P = 0.0236, ***P = 0.0488, ****P = 0.0006, *****P = 0.0079, unpaired t test two-tailed. Right panel, day 0 n = 3, GBM n = 7, 5 and 3 for days 10–15, 20–25 and >30, respectively. At >30 days relative to day 0, all P > 0.05 and considered not significant, unpaired t test two-tailed. g,h, Pseudotime trajectory (seed cluster 12) (g) and DEGs (h) of oligodendrocyte clusters 9 and 12. i,j, Assessment of GBM BBB integrity. Representative photomicrographs of GBM brains post EB and NaF administration and quantification (i). Data are mean ± s.e.m. of biologically independent replicates. EB, n = 3, 5, 4, 5 and 4, for days 0, 10, 20, 25 and 30+, respectively and NaF, n = 2, 5, 4, and 3 for days 0, 10, 20, and 30+, respectively. *P = 0.0209, **P = 0.0012, ***P = 0.0089 when compared with day 0, unpaired t test two-tailed. Representative gadolinium-enhanced T1-weighted MRIs and quantification of a developing GBM imaged at 22, 26 and 32 days post-tumor initiation (j). Tumor volumes (in mm3) were measured using T2 weighted images. Scale bar, 2 mm; data represent mean ± s.d. of technical replicates. *P < 0.0001, **P = 0.0071, ***P = 0.0029, ****P = 0.0002 when compared with 22-day voxel intensities, unpaired t test two-tailed. Source data
Fig. 6
Fig. 6. Loss of macrophage and microglia proinflammatory polarization over time.
a, Volcano plots of DEGs of microglia clusters 2 and 4 between Early versus normal and Late versus Early GBM tumors. b, Volcano plots of DEGs of DC cluster 1, Neutrophils/PMN-MDSCs cluster 11 and macrophage clusters 6 and 20 in Late versus Early GBM tumors. c, Cytokine ligand:receptor pairs analysis. Expression levels of the indicated ligands and receptors for the indicated cell type clusters in normal, Early and Late GBM samples are plotted. d, NES from GSEA of the indicated microglia and macrophage clusters from normal, Early and Late GBM samples analyzed for proinflammatory ‘M1-like’ markers and anti-inflammatory, protumorigenic alternatively polarized ‘M2-like’ markers. Source data
Fig. 7
Fig. 7. TMZ and radiation change GBM immune microenvironment and prolong survival.
a, Flow cytometry of BM and spleens of control non-GBM-bearing mice and early-stage (BLI 107 p s−1 cm−2 sr−1) GBM mice for the indicated cell type and progenitors. Data are represented as mean ± s.e.m. of biologically independent replicates. Comparisons between control (n = 4) and GBM (n = 4) mice. *P = 0.0266, **P = 0.015, ***P = 0.0081, ****P = 0.0139 and *****P = 0.0002, unpaired t test, two-tailed. b, Flow cytometry of spleen cells as in a for the indicated cell markers and checkpoint molecules. Data are represented as mean ± s.e.m. of biologically independent replicates. Comparisons between control (n = 4) and GBM-bearing (n = 4) mice, *P = 0.0491, **P = 0.0094, ***P = 0.0087, ****P = 0.0053, *****P = 0.0001 and ******P < 0.0001, unpaired t test, two-tailed. c, Kaplan–Meier survival analysis of GBM mice treated with control vehicle or 25 or 66.7 mg kg−1 TMZ daily. TMZ 66.7 g kg−1 versus control *P < 0.0001, NS, not significant, log-rank (Mantel–Cox). Data are represented from biologically independent replicates, n = 13, 6 and 7 for control, 25 and 66.7 mg kg−1 TMZ, respectively. d, Flow cytometry for the indicated cell types from GBM of control and TMZ-treated (25 mg kg−1 or 66.7 mg kg−1 daily) mice. Comparisons of control and TMZ-treated. Data are represented as mean ± s.e.m. of biologically independent replicates, n = 5, 3, and 5 for control, 25.0 and 66.7 mg kg−1 TMZ respectively, *P = 0.0051, **P = 0.0074, ***P = 0.0194, unpaired t test, two-tailed. e, Kaplan–Meier survival analysis of GBM mice treated with control vehicle, 25 mg kg−1 TMZ, IR and IR/TMZ as indicated. Data represent biologically independent replicates, n = 13, 6, 4 and 5 for control, 25 mg kg−1 TMZ, IR and IR/TMZ, respectively. *P < 0.0001 log-rank (Mantel–Cox). f, Flow cytometry of GBMs for the indicated cell type from control and TMZ (25 mg kg−1), IR (2 Gy/day) and IR/TMZ-treated GBM mice. Comparisons of control and treatment. Data represent mean ± s.e.m. of biologically independent tumors. Microglia/macrophages, PMN-MDSCs/M-MDSCs and CD45+/EGFR+ panels n = 7, 4, 6, 3 for control, TMZ, IR and IR/TMZ, respectively. *P = 0.0397, **P = 0.0456, ***P = 0.0487, ****P = 0.034, unpaired t test, two-tailed. CD4+/CD8+/Tregs/GranB+CD8+ panel n = 4, 4, 3, 3, for control, TMZ, IR and IR/TMZ, respectively of the *P = 0.0125, **P = 0.0065, ***P = 0.0049, ****P = 0.0054, *****P = 0.0026. Unpaired t test, two-tailed. Source data
Fig. 8
Fig. 8. Patient immune heterogeneity in low-grade gliomas and GBMs.
a, Flow cytometry from low-grade and GBM patient tumor samples analyzed for the indicated cell types. bd, Flow cytometry of tumors in a for Tregs, CD4+ and CD8+ lymphocytes (b), the indicated cell types as percent of CD11b+ population in low-grade and GBM tumors and IDH1 R132H mutant and IDH1 wild-type gliomas (c); note that in low-grade and GBM panel, monocytes and macrophages were combined and for Tregs, CD4+ and CD8+ lymphocytes in low-grade, GBM, IDH1 R132H mutant and IDH1 wild-type gliomas (d). Data are presented as biologically independent tumours. n = 5 and 8 low-grade and GBM, respectively. *P = 0.04, **P = 0.007 unpaired t test, two-tailed. Source data
Extended Data Fig. 1
Extended Data Fig. 1. Single cell RNAseq.
a, Overview of the experimental procedure. See Methods and main text for details. b, Schematic of the single-cell RNA-seq experimental pipeline procedure. c, Alignment (Z scored) of mouse GBM cells to human GBM tumor cells subtype markers from scRNA-seq-derived independent analyses. d, Expression of characteristic cell-type-specific genes overlaid on the UMAP space. Source data
Extended Data Fig. 2
Extended Data Fig. 2. Characteristics of EGFR positive GBM cells.
a, Representative photomicrographs of EGFR IHC of GBMs at 7, 14 and 21 days post initiation. Scale bars, 7 days 100 μm, 14 days 200 μm and 21 days 500 μm. b, GO analysis of DEGs between clusters 0 and 5. BP, biological processes. c, GO analysis of cluster 22. d, Scaled expression of indicated EGFR ligands in all clusters. e, Scaled expression of Pdgfra and Lgals1 (GAL1) in all clusters. f, Representative flow cytometry gating scheme used to sort PDGFRA and GAL1 positive and negative populations. g, Principal component analysis of the tumor samples’ RNAseq datasets. h, Unsupervised hierarchical clustering of the bulk RNAseq from PDGFRA, PDGFRA+, GAL1 and GAL1+ samples.
Extended Data Fig. 3
Extended Data Fig. 3. Transcriptomic characteristics of EGFR positive PDGFRA+ and GAL1+ GBM cells.
a, b, Volcano plot of Log2FC expression levels of genes (a) and GO analysis of DEGs (b) from PDGFRA+ vs PDGFRA samples. c, d, Volcano plot of Log2FC expression levels of genes (c) and GO analysis of DEGs (d) from GAL1+ vs GAL1 samples. e, GO analysis of the DEGs DEGs from bulk RNAseq of hsEGFR+PDGFRA+ and hsEGFR+GAL1+ flow-sorted cells.BP; biological processes. f, Alignment of the top expressed genes from EGFR+ clusters 0, 5, 10, 22 and 24 to the IVY GAP datasets. g, Alignment of the top expressed genes from EGFR+ PDGFRA+ and EGFR+ GAL1+ populations to the IVY GAP datasets.
Extended Data Fig. 4
Extended Data Fig. 4. Isolation and analysis of proliferating microglia cells.
a, Percent microglia expressing cell cycle phase marker genes from clusters 2, 4 and 19 in normal brain control, Early and Late GBM samples. b, Scheme to flow sort EdU-labeled microglia. c, Flow sorting gating strategy. d, Relative numbers of CD45+, microglia and macrophage cells from normal brain controls, GBM and contralateral CNS tissue from GBM brains by flow cytometry. Data is mean ± SEM of biologically independent replicates n = 3 each control brain, GBM and contralateral. One-way analysis of variance (ANOVA) *p = 0.0435, *p = 0.02, panel 4 *p = 0.0018, ** p = 0.0324, ***p = 0.0119, ****p = 0.0008, *****p < 0.0001. ns, not significant. e, Principal component analysis of the indicated samples, n = 3. f, Heatmap from unsupervised hierarchical clustering of the bulk RNAseq from indicated flow-sorted bulk RNAseq samples. g, Gene set enrichment analysis of microglial sensome genes applied to flow-sorted bulk RNAseq samples. h, GO analysis of EdU+ microglia DEGs with cell cycle genes removed. BP, biological process. i, Heat map of DEGs between GBM contralateral microglia and normal brain microglia. j, GO analysis of DEGs enriched in microglia clusters 2, 4, and 19. Source data
Extended Data Fig. 5
Extended Data Fig. 5. Expression of cytokines and checkpoint receptors and ligands is restricted to CD45+ cell populations.
a, Scaled expression levels of Tnf transcripts in CD45 and CD45+ clusters. b, Flow cytometry MFI expression levels of PD-1, PD-L1, and PD-L2 in GBM. Data is mean ± SD of biologically independent tumors n = 4, *p = 0.0008, **p = 0.0024, ***p = 0.0002, ****p = 0.001, #p = 0.0328, ##p = 0.0474 unpaired t test, two-tailed. c, Scaled expression levels of Vsir (Vista) transcripts in CD45 and CD45+ populations. d, Flow cytometry MFI expression levels of VISTA in GBM. Data is mean ± SD of biologically independent tumors n = 4, *p = 0.0118, **p = 0.0081, unpaired t test, two-tailed. e, Scale expression levels of Lgals9 transcripts in CD45 and CD45+ populations. f, Flow cytometry MFI expression GAL9 in GBM tumors. Data is mean ± SD of biologically independent tumors n = 4, *p = 0.0297, **p = 0.0136, unpaired t test, two-tailed. Source data
Extended Data Fig. 6
Extended Data Fig. 6. Bioluminescence imaging of mice and oligodendrocyte molecular changes during GBM progression.
a, BLI output of normal control mice (showing background levels of bioluminescence), and mice used in Early and Late samples. Data is presented as mean ± SD of biologically independent replicates. Normal brain n = 4, Early GBM n = 8, and Late GBM n = 3, *p = 0.0162, **p = 0.0135, ***p = 0.0006,, unpaired t test two-tail. b, GO analysis of oligodendrocyte DEGs enriched between clusters 9 and 12. BP, biological processes. Source data
Extended Data Fig. 7
Extended Data Fig. 7. Changes in GBM infiltrating immune cells during progression.
a, GO analysis of DEGs from microglia cluster 2 enriched in Early GBM. b, DEGs of barrier associated macrophage (BAM) cluster 13 and perivascular macrophage cluster 17 enriched in Late and Early GBM samples. c-e, GO analysis of DEGs upregulated in Late vs Early GBM samples for macrophage cluster 6 (c) and DC cluster 1 (d) and enriched and downregulated in Late neutrophil/PMN-MDSCs cluster 11 (e).
Extended Data Fig. 8
Extended Data Fig. 8. Gating strategies and treatment schemes.
a, Hematopoesis schema. HSC: hematopoietic stem cell, MPP: multipotent progenitor, CLP: common lymphoid progenitor, CMP: common myeloid progenitor, GMP: granulocyte-monocyte progenitor, MDP: monocyte-dendritic cell progenitor, CDP: common dendritic progenitor, DC: dendritic cell. b, Flow cytometry gating strategy of cells isolated from bone marrow. The schema represents the sequential steps of the gating strategy. The various cell populations within the bone marrow are depicted. LSK (Linneg, Sca1pos, CD127neg, c-kitpos) and LK (Linneg, Sca1neg, CD127neg, c-kitpos) hematopoietic precursors and CMP (Linneg, Sca1neg, CD127neg, c-kitpos, CD16/CD32neg) and GMP (Linneg, Sca1neg, CD127neg, c-kitpos, CD16/CD32pos) myeloid precursors. c, Schematic of the TMZ treatment strategy. d, Flow cytometry gating strategy of cells isolated from normal brain. The schema represents the sequential steps of the gating strategy. The various immune cell populations within the brain are depicted. e, Flow cytometry data for the indicated cell types from brain, bone marrow and spleen tissues of control and TMZ (25 mg/kg or 66.7 mg/kg daily) treated mice. Data represent mean ± SEM of biologically independent replicates. n = 4, 4, and 4 for control, 25 and 66.7 mg/kg of TMZ respectively for brain microglia, brain macrophages and spleen myeloid 24, 72 and 168 hrs. n = 5, 2 and 3 for control, 25 and 66.7 mg/kg of TMZ respectively for bone marrow CMP. n = 4, 3 and 2 for control, 25 and 66.7 mg/kg of TMZ respectively for bone marrow GMP. *p = 0.0228, **p = 0.0002, ***p < 0.0001, unpaired t test two-tailed. f, Schematic of the TMZ treatment strategy. g, Longitudinal BLI from representative GBM mice undergoing TMZ treatments. h, Flow cytometry from spleens of GBM mice treated with control vehicle, 25 and 66.7 mg/kg of TMZ. Data is presented as mean ± SD of biologically independent replicates n = 4, 3 and 5 for control, 25 and 66.7 mg/kg TMZ respectively, no statistically significant differences were identified. i, Schematic of the TMZ/IR treatment strategy. j, Longitudinal BLI from representative GBM mice undergoing TMZ and/or IR treatments. Source data
Extended Data Fig. 9
Extended Data Fig. 9. Characterization of human low-grade glioma and GBM immune composition by flow cytometry.
a, Representative flow cytometry plots depicting the gating strategy used to analyzed and quantitate single cells from patient samples. b, Flow cytometry of CD45+ and CD11b+ cells biologically independent low-grade and GBM patient samples n = 5, 8 respectively. Data is presented as mean ± SD. c, Median age of low-grade glioma and GBM patients at diagnosis from (b), data is mean ± SD. d, Kaplan-Meier survival analysis of low-grade glioma and GBM patients in (b). e-j, Flow cytometry of the indicated cells types as percent of CD45+ or CD11b+ cells based on gender (e,f) or anatomical location (g-j). No statistically significant differences were identified, unpaired t test two-tailed. Data is mean ± SD. Source data

Comment in

References

    1. Brennan CW, et al. The somatic genomic landscape of glioblastoma. Cell. 2013;155:462–477. - PMC - PubMed
    1. Acquaviva J, et al. Chronic activation of wild-type epidermal growth factor receptor and loss of Cdkn2a cause mouse glioblastoma formation. Cancer Res. 2011;71:7198–7206. - PMC - PubMed
    1. Jun HJ, et al. Acquired MET expression confers resistance to EGFR inhibition in a mouse model of glioblastoma multiforme. Oncogene. 2012;31:3039–3050. - PMC - PubMed
    1. Zhu H, et al. Oncogenic EGFR signaling cooperates with loss of tumor suppressor gene functions in gliomagenesis. Proc. Natl. Acad. Sci. USA. 2009;106:2712–2716. - PMC - PubMed
    1. Yeo AT, et al. EGFRvIII tumorigenicity requires PDGFRA co-signaling and reveals therapeutic vulnerabilities in glioblastoma. Oncogene. 2021;40:2682–2696. - PMC - PubMed

Publication types