. 2022 May 27;10(1):78.
doi: 10.1186/s40168-022-01258-3.

The functional evolution of termite gut microbiota

Affiliations

The functional evolution of termite gut microbiota

Jigyasa Arora et al. Microbiome. .

Abstract

Background: Termites primarily feed on lignocellulose or soil in association with specific gut microbes. The functioning of the termite gut microbiota is partly understood in a handful of wood-feeding pest species but remains largely unknown in other taxa. We intend to fill this gap and provide a global understanding of the functional evolution of termite gut microbiota.

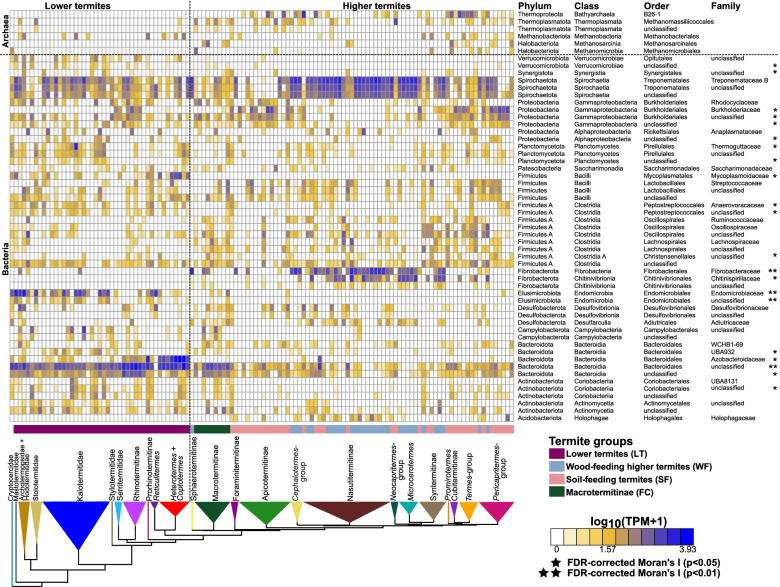
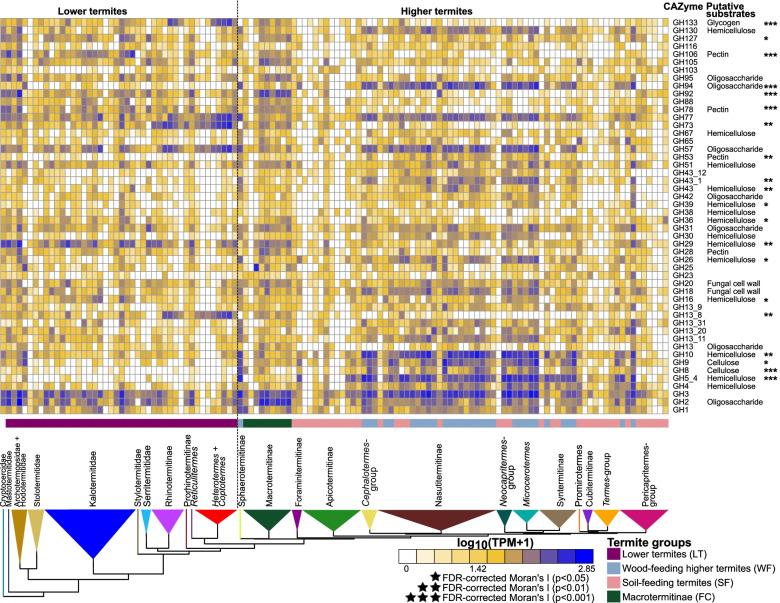
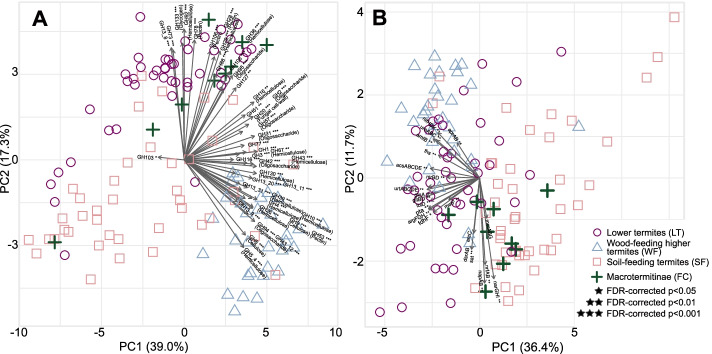
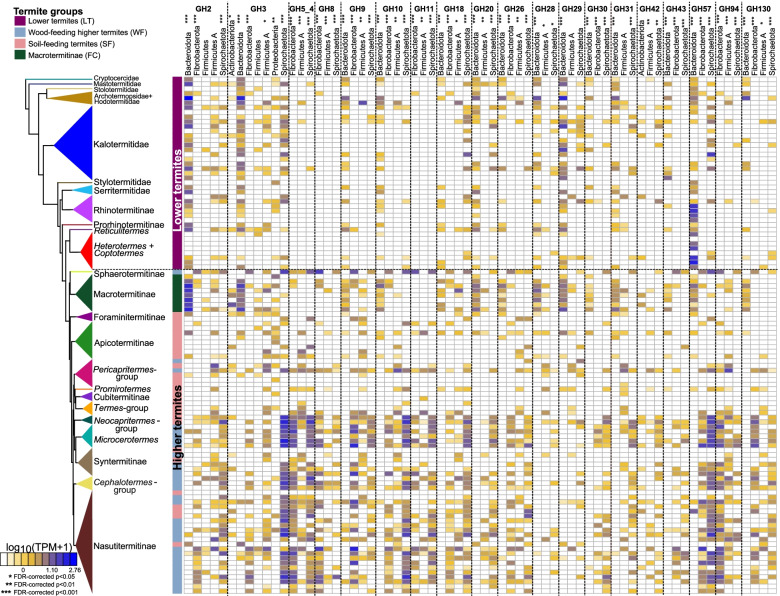
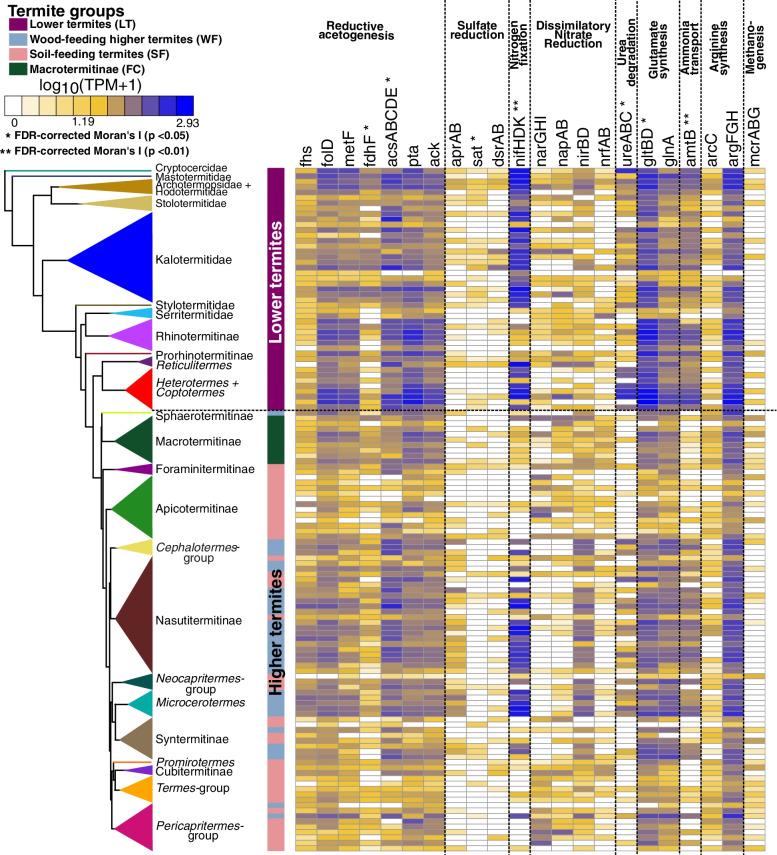
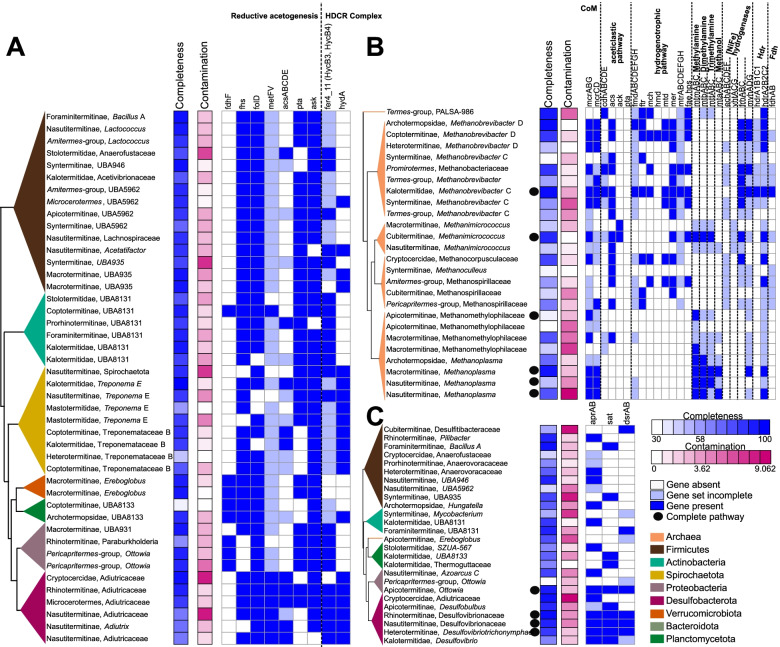
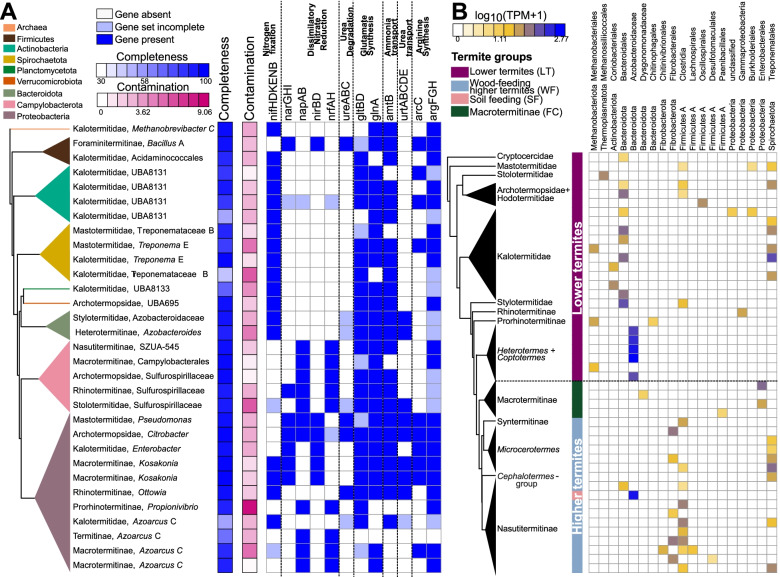
Results: We sequenced the gut metagenomes of 145 samples representative of the termite diversity. We show that the prokaryotic fraction of the gut microbiota of all termites possesses similar genes for carbohydrate and nitrogen metabolisms, in proportions varying with termite phylogenetic position and diet. The presence of a conserved set of gut prokaryotic genes implies that essential nutritional functions were present in the ancestor of modern termites. Furthermore, the abundance of these genes largely correlated with the host phylogeny. Finally, we found that the adaptation to a diet of soil by some termite lineages was accompanied by a change in the stoichiometry of genes involved in important nutritional functions rather than by the acquisition of new genes and pathways.

Conclusions: Our results reveal that the composition and function of termite gut prokaryotic communities have been remarkably conserved since termites first appeared ~ 150 million years ago. Therefore, the "world's smallest bioreactor" has been operating as a multipartite symbiosis composed of termites, archaea, bacteria, and cellulolytic flagellates since its inception. Video Abstract.

Keywords: Endosymbionts; Isoptera; Metagenomics; Vertical inheritance.


Conflict of interest statement

The authors declare that they have no competing interests.

Figures

Fig. 1
Fig. 1
Relative abundance of the top 50 bacterial lineages and the major archaeal orders found in the gut metagenomes of termites. The relative abundance of prokaryotic taxa was inferred from 40 single-copy marker genes. The color scale represents the logarithm of transcripts per million (TPM). The tree represents a simplified time-calibrated phylogenetic tree reconstructed using host termite mitochondrial genome sequences. Prokaryotic taxa presenting significant phylogenetic autocorrelation with the host phylogeny at a 5% false discovery rate (FDR) are indicated with an asterisk (*p < 0.05; **p < 0.01)
Fig. 2
Fig. 2
Relative abundance of CAZymes found in gut metagenomes of termites. The heatmap shows the 50 most abundant CAZymes. The color scale represents the logarithm of transcripts per million (TPM). The tree represents a simplified time-calibrated phylogenetic tree reconstructed using host termite mitochondrial genomes. Genes showing significant phylogenetic autocorrelation with the host phylogeny at a 5% false discovery rate (FDR) are indicated with asterisks (*p < 0.05; **p < 0.01)
Fig. 3
Fig. 3
Principle component analysis (PCA) bi-plots showing the distribution of prokaryotic genes involved in lignocellulose digestion in the gut of termites. A PCA performed on the relative abundance of 346 CAZymes found in 129 gut metagenome assemblies. The 50 glycoside hydrolases (GHs) that contributed the most to separation of termite diets are plotted (see Table S7). B PCA inferred from relative abundance of metabolic genes involved in lignocellulose digestion after carbohydrate degradation. The symbols indicate host feeding habits. The species identity of each data point is available in Table S1. Asterisks indicate significant differences among the four termite groups at 5% false discovery rate (FDR, *p < 0.05; **p < 0.01; ***p < 0.001)
Fig. 4
Fig. 4
CAZyme families, and their taxonomic origin, for enzymes derived from contigs longer than 5000 bps and present in 10% of gut metagenomes. The color scale represents the log-transformed transcripts per million (TPM). The tree represents a simplified time-calibrated phylogenetic tree reconstructed using host termite mitochondrial genomes. Asterisks indicate significant differences among the four termite groups at 5% false discovery rate (FDR, *p < 0.05; **p < 0.01; ***p < 0.001)
Fig. 5
Fig. 5
Relative abundance of prokaryotic genes belonging to metabolic pathways involved in the final steps of the lignocellulose digestion in the gut of termites. The color scale represents the logarithm of transcripts per million (TPM). The tree represents a simplified time-calibrated phylogenetic tree reconstructed using host termite mitochondrial genomes. Full names of the gene families and their corresponding KEGG IDs are available in Table S11
Fig. 6
Fig. 6
Metabolic pathways involved in the final steps of lignocellulose digestion found in gut metagenome-assembled genomes (MAGs) reconstructed in this study. A Genes involved in reductive acetogenesis, B methanogenesis, and C sulfate reduction found in MAGs. The trees represent simplified maximum likelihood phylogenetic trees of the MAGs reconstructed using 43 single-copy marker genes. MAG completeness and contamination, based on CheckM analyses, is shown beside the tree. Dark blue squares indicate gene presence, light blue squares indicate incomplete gene sets, and open squares indicate gene absence. Detailed information on the gene families and their KEGG IDs are available in Tables S12, S14, and S15
Fig. 7
Fig. 7
Nitrogen metabolism in the gut of termites. A Metagenome-assembled genomes (MAGs) with complete nitrogen fixation or dissimilatory nitrate reduction pathways. All pathways potentially involved in the nitrogen metabolism, namely nitrogen fixation, dissimilatory nitrate reduction, ureases, glutamate metabolism, ammonia transport, urea transport, and arginine metabolism are represented. The tree represents a simplified maximum likelihood phylogenetic tree of the MAGs inferred from 43 marker genes. Completeness and contamination of MAGs, based on CheckM analysis, are shown beside the tree. Dark blue squares indicate gene presence, light blue squares indicate incomplete gene sets, and open squares indicate gene absence. B Abundance of NifHDK operons (nifHDK, vnfHDK, or anfHDK) present in contigs longer than 5000 bps across gut metagenomes. The color scale represents the log-transformed transcripts per million (TPM). The tree represents a simplified time-calibrated phylogenetic tree reconstructed using host termite mitochondrial genomes

References

    1. Abdul Rahman N, Parks DH, Willner DL, Engelbrektson AL, Goffredi SK, Warnecke F, Scheffrahn RH, Hugenholtz P. A molecular survey of Australian and North American termite genera indicates that vertical inheritance is the primary force shaping termite gut microbiomes. Microbiome. 2015;3:5. doi: 10.1186/s40168-015-0067-8. - DOI - PMC - PubMed
    1. Adams DC, Otárola-Castillo E. Geomorph: An R package for the collection and analysis of geometric morphometric shape data. Methods Ecol Evol. 2013;4:393–399. doi: 10.1111/2041-210X.12035. - DOI
    1. Alneberg J, Bjarnason BS, De Bruijn I, Schirmer M, Quick J, Ijaz UZ, Lahti L, Loman NJ, Andersson AF, Quince C. Binning metagenomic contigs by coverage and composition. Nat Methods. 2014;11:1144–1146. doi: 10.1038/nmeth.3103. - DOI - PubMed
    1. Altschup SF, Warren G, Miller W, Myers EW, Lipman D. Basic local alignment search tool. J Mol Biol. 1990;215:403–410. doi: 10.1016/S0022-2836(05)80360-2. - DOI - PubMed
    1. Apprill A, Mcnally S, Parsons R, Weber L. Minor revision to V4 region SSU rRNA 806R gene primer greatly increases detection of SAR11 bacterioplankton. Aquat Microb Ecol. 2015;75:129–137. doi: 10.3354/ame01753. - DOI

Publication types

LinkOut - more resources