. 2022 Apr 25;11(5):835.
doi: 10.3390/antiox11050835.

Anti-Inflammatory Effect of Resveratrol Derivatives via the Downregulation of Oxidative-Stress-Dependent and c-Src Transactivation EGFR Pathways on Rat Mesangial Cells

Affiliations

Anti-Inflammatory Effect of Resveratrol Derivatives via the Downregulation of Oxidative-Stress-Dependent and c-Src Transactivation EGFR Pathways on Rat Mesangial Cells

I-Ta Lee et al. Antioxidants (Basel). .

Abstract

In Taiwan, the root extract of Vitis thunbergii Sieb. et Zucc. (Vitaceae, VT) is rich in stilbenes, with resveratrol (Res) and its derivatives being the most abundant. Previously, we showed that the effect of Res derivatives against tumor necrosis factor-α (TNF-α)-stimulated inflammatory responses occurs via cPLA2/COX-2/PGE2 inhibition. This study compared and explored the underlying anti-inflammatory pharmacological mechanisms. Before stimulation with TNF-α, RMCs were treated with/without pharmacological inhibitors of specific protein kinases. The expression of inflammatory mediators was determined by Western blotting, gelatin zymography, real-time PCR, and luciferase assay. Cellular and mitochondrial ROS were measured by H2DHFDA or DHE and MitoSOX™ Red staining, respectively. The RNS level was indirectly measured by Griess reagent assay. Kinase activation and association were assayed by immunoprecipitation followed by Western blotting. TNF-α binding to TNFR recruited Rac1 and p47phox, thus activating the NAPDH oxidase-dependent MAPK and NF-κB pathways. The TNF-α-induced NF-κB activation via c-Src-driven ROS was independent from the EGFR signaling pathway. The anti-inflammatory effects of Res derivatives occurred via the inhibition of ROS derived from mitochondria and NADPH oxidase; RNS derived from iNOS; and the activation of the ERK1/2, JNK1/2, and NF-κB pathways. Overall, this study provides an understanding of the various activities of Res derivatives and their pharmacological mechanisms. In the future, the application of the active molecules of VT to health foods and medicine in Taiwan may increase.

Keywords: Res derivatives; anti-inflammation; anti-oxidation; transactivation EGFR.


Conflict of interest statement

The authors declare no conflict of interest.

Figures

Figure 1
Figure 1
Res and its derivatives attenuated TNF-α-induced MMP-9 expression in RMCs. (a,b) Cells were treated with different concentrations of AC, AF, PD, or Res for 2 h, followed by stimulation with TNF-α for 48 h (a) or 24 h (b). (a) MMP-9 enzyme activity was determined by gelatin zymography, and Western blotting analyses were used to determine the expression of GAPDH (as a loading control). (b) The MMP-9 mRNA transcripts were determined by real-time PCR. (c) Cells were transformed with the MMP-9 promoter-luciferase plasmids by electroporation. After the same treatment, a luciferase assay was used to analyze the promoter activity of MMP-9. The results are presented as the mean ± standard deviation (SD) from 4–6 experiments and analyzed using one-way ANOVA followed by Dunnett’s post hoc test. ** p < 0.01, compared with the untreated group. # p < 0.05, ## p < 0.01, compared with the TNF-α treatment group.
Figure 2
Figure 2
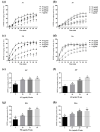
Effects of AC, AF, Res, and PD on the scavenging ability of DPPH free radicals. (a,e) AC; (b,f) AF; (c,g) PD; and (d,h) Res reacted with DPPH radicals for various times, and a SpectraMax i3 microplate reader detected the absorbance values at 520 nm. The results are presented as the mean ± SD from 4 experiments and analyzed (ad) using two-way ANOVA followed by Tukey’s multiple comparisons post hoc test. a p < 0.05, A p < 0.01, compared with the untreated group at the same concentration of the drugs; (eh) using one-way ANOVA followed by Tukey’s multiple comparisons post hoc test. p < 0.05, and different letters represent significant differences between groups.
Figure 3
Figure 3
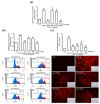
Antioxidant ability of AC, AF, Res, and PD in cells. (a) H2DCFDA (4 µM) was added to starved cells at 37 °C for 30 min, and cells were pre-treated with Res, AC, AF, and PD (10 μg/mL), cultured for 2 h, and then stimulated with TNF-α (10 ng/mL) for 6 h. Cell lysates were collected and the H2DCF fluorescence values were read on a SpectraMax i3 microplate reader (excitation at 485 nm, emission detection at 530 nm); n = 4–8. (b) After the same treatment as that described in (a), cells were harvested (1 × 10⁶ cells/mL), free radicals were stained with DHE, and a Muse® Cell Analyzer was used for analysis; n = 3–4. (c) Cells seeded on glass slides were treated as in (a), and 5 μM MitoSOX™ Red reagent was added in the dark for 1 h at 37 °C. A fluorescence microscope was used to photograph the distribution of free radicals in the cells; n = 4–7. The results are presented as the mean ± SD and were analyzed using one-way ANOVA followed by Dunnett’s post hoc test. ** p < 0.01, compared with the untreated group. # p < 0.05, ## p < 0.01, compared with the TNF-α treatment group.
Figure 4
Figure 4
AC, AF, Res, and PD affected the TNF-α-induced iNOS expression and intracellular NO production. (a,b) TNF-α was used to stimulate RMCs at different concentrations and times. (c) Cells were treated with AC, AF, PD, and Res (10 μg/mL) for 2 h and then stimulated with TNF-α for 24 h. (a) The cell lysate was collected, and the expression of iNOS was analyzed by Western blotting using GAPDH as a loading control. (b) Quantitative graph for (a). (c,d) The supernatant was collected, and the NO content was indirectly analyzed using the Griess reagent analysis method. The results are presented as the mean ± SD from 3 experiments and analyzed (b,c) using two-way ANOVA followed by Tukey’s multiple comparisons post hoc test. p < 0.01; different letters represent significant differences between groups and (d) using one-way ANOVA followed by Dunnett’s post hoc test. ** p < 0.01, compared with the untreated group. # p < 0.05, compared with the TNF-α treatment group.
Figure 5
Figure 5
The ROS generated by the complex of TNFR1/TRAF2/Rac1/p47phox participated in the TNF-α-induced upregulation of COX-2 and pro-MMP-9. (a) Cells seeded on glass slides were pre-treated with MCI186 and mito-TEMPO, followed by TNF-α treatment, then stained with MitoSOX™ Red reagent and photographed using a fluorescence microscope. (b) Cells were pre-treated with NAC, DPI, and APO, followed by TNF-α treatment. The cell lysate was collected, and the H2DCF fluorescence value was read. (c,d) Cells were pre-treated with MCI186, APO, DPI, and mito-TEMPO, followed by TNF-α treatment. (c) Real-time PCR was used to analyze the MMP-9 and COX-2 mRNA transcripts. (d) Luciferase assay was used to analyze the MMP-9 and COX-2 promoter activity. (e) Cells were pre-treated with various concentrations of DPI, followed by TNF-α treatment for 24 h (for COX-2) and 48 h (for MMP-9). MMP-9 enzyme activity was observed by gelatin zymography, and COX-2 expression was assessed by Western blotting. (f) The whole-cell lysate (input, 1 mg) was reacted with an anti-TNFR1 antibody. After the reaction, 50% protein A-agarose magnetic beads were mixed evenly at 4 °C for 1 day. The antigen–antibody conjugates were collected and prepared as the electrophoretic sample. Western blotting was used to analyze the binding of TNFR1, Rac1, or p47phox. The results are presented as the mean ± SD from 4–6 experiments and analyzed using one-way ANOVA followed by Dunnett’s post hoc test. ** p < 0.01, compared with the untreated group. # p < 0.05, ## p < 0.01, compared with the TNF-α treatment group.
Figure 5
Figure 5
The ROS generated by the complex of TNFR1/TRAF2/Rac1/p47phox participated in the TNF-α-induced upregulation of COX-2 and pro-MMP-9. (a) Cells seeded on glass slides were pre-treated with MCI186 and mito-TEMPO, followed by TNF-α treatment, then stained with MitoSOX™ Red reagent and photographed using a fluorescence microscope. (b) Cells were pre-treated with NAC, DPI, and APO, followed by TNF-α treatment. The cell lysate was collected, and the H2DCF fluorescence value was read. (c,d) Cells were pre-treated with MCI186, APO, DPI, and mito-TEMPO, followed by TNF-α treatment. (c) Real-time PCR was used to analyze the MMP-9 and COX-2 mRNA transcripts. (d) Luciferase assay was used to analyze the MMP-9 and COX-2 promoter activity. (e) Cells were pre-treated with various concentrations of DPI, followed by TNF-α treatment for 24 h (for COX-2) and 48 h (for MMP-9). MMP-9 enzyme activity was observed by gelatin zymography, and COX-2 expression was assessed by Western blotting. (f) The whole-cell lysate (input, 1 mg) was reacted with an anti-TNFR1 antibody. After the reaction, 50% protein A-agarose magnetic beads were mixed evenly at 4 °C for 1 day. The antigen–antibody conjugates were collected and prepared as the electrophoretic sample. Western blotting was used to analyze the binding of TNFR1, Rac1, or p47phox. The results are presented as the mean ± SD from 4–6 experiments and analyzed using one-way ANOVA followed by Dunnett’s post hoc test. ** p < 0.01, compared with the untreated group. # p < 0.05, ## p < 0.01, compared with the TNF-α treatment group.
Figure 6
Figure 6
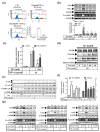
The c-Src/EGFR/PI3K/Akt/GSK3α/β pathway in TNF-α-induced COX-2 and pro-MMP-9 expression. (a) Cells were pre-treated with various concentrations of PP1, followed by TNF-α treatment for 6 h, collection of cells (1 × 10⁶ cells/mL), staining of free radicals with DHE, and analysis using a Muse® Cell Analyzer. (b,g) Cells were pre-treated with various concentrations of (b) PP1 and (g) AG1478, LY294002, or BML257, followed by TNF-α treatment for 24 h (for COX-2 and iNOS) or 48 h (for MMP-9). MMP-9 enzyme activity was observed by gelatin zymography, and COX-2 and iNOS expression was detected by Western blotting. (c) Real-time PCR was used to analyze the MMP-9 and COX-2 mRNA transcripts. (d,e) After stimulation with TNF-α for various times, (d) the whole-cell lysate (input, 1 mg) was reacted with the anti-EGFR antibody. After co-immunoprecipitation, Western blotting was used with anti-EGFR, anti-P-EGFR, or anti-P-c-Src antibodies. (e) Western blotting was used to analyze the P-c-Src, P-Akt, and P-Gskα/β antibodies. (f) Cells were pre-treated with PP1, LY294002, and BML257, followed by TNF-α treatment. Luciferase assay was used to analyze the MMP-9 and COX-2 promoter activity. The results are presented as the mean ± SD from 4–6 experiments and analyzed using one-way ANOVA followed by Dunnett’s post hoc test. ** p < 0.01, compared with the untreated group. # p < 0.05, ## p < 0.01, compared with the TNF-α treatment group.
Figure 7
Figure 7
Involvement of MAPKs and NF-κB in TNF-α-induced, pro-MMP-9 expression. Cells were pre-treated with U0126, SB202190, SP600125, or Bay11-7082, followed by TNF-α treatment for 24 h (a) or 48 h (b). (a) Luciferase assay was used to analyze the MMP-9 and COX-2 promoter activity. (b) MMP-9 enzyme activity was observed by gelatin zymography, and Western blotting was used to analyze the expression of GAPDH (as a loading control). The results are presented as the mean ± SD from 4–6 experiments and analyzed using one-way ANOVA followed by Dunnett’s post hoc test. ** p < 0.01, compared with the untreated group. # p < 0.05, ## p < 0.01, compared with the TNF-α treatment group.
Figure 8
Figure 8
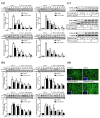
The TNF-α-induced NF-κB activation via c-Src-driven ROS was independent from the EGFR signaling pathway. (a,b) Cells were pre-treated with NAC, DPI, APO, or PP1, followed by TNF-α treatment for various times. (a) IκBα and (b) NF-κB activation was analyzed by Western blotting. (c,d) Cells were pre-treated with AG1478, LY294002, or BML257, followed by TNF-α treatment for 5 min. NF-κB activation was analyzed by (c) Western blotting and (d) immunofluorescence staining. The results are presented as the mean ± SD from 4–6 experiments and analyzed using one-way ANOVA followed by Dunnett’s post hoc test. **p < 0.01, compared with the untreated group. # p < 0.05, ## p < 0.01, compared with the TNF-α treatment group.
Figure 9
Figure 9
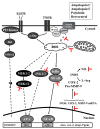
Pharmacological diagram of the inhibition of TNF-α-induced inflammatory proteins by Res derivatives. The TNF-α-induced activation of MAPKs and NF-κB was mediated by ROS derived from mitochondria and NADPH oxidase. TNF-α binding to TNFR recruited Rac1 and p47phox, thus activating NAPDH oxidase. In addition, the expression of MMP-9 induced by TNF-α was mediated by the MAPK, EGFR, and classical NF-κB pathways, respectively. However, Res derivatives inhibited the ROS derived from mitochondria and NADPH oxidase, the RNS derived from iNOS, the activation of ERK1/2 and JNK1/2, and NF-κB, which were induced by TNF-α.

References

    1. Avraham S., Korin B., Chung J.J., Oxburgh L., Shaw A.S. The Mesangial cell—the glomerular stromal cell. Nat. Rev. Nephrol. 2021;17:855–864. doi: 10.1038/s41581-021-00474-8. - DOI - PubMed
    1. Du Y., Shi X., Li J., Jia Y. MicroRNA-98-5p inhibits human mesangial cell proliferation and TNF-α and IL-6 secretion by targeting BTB and CNC homology 1. Exp. Ther. Med. 2021;22:1436. doi: 10.3892/etm.2021.10871. - DOI - PMC - PubMed
    1. Nezu M., Suzuki N., Yamamoto M. Targeting the KEAP1-NRF2 System to Prevent Kidney Disease Progression. Am. J. Nephrol. 2017;45:473–483. doi: 10.1159/000475890. - DOI - PubMed
    1. Daenen K., Andries A., Mekahli D., Van Schepdael A., Jouret F., Bammens B. Oxidative stress in chronic kidney disease. Pediatr. Nephrol. 2019;34:975–991. doi: 10.1007/s00467-018-4005-4. - DOI - PubMed
    1. Che R., Yuan Y., Huang S., Zhang A. Mitochondrial dysfunction in the pathophysiology of renal diseases. Am. J. Physiol. Ren. Physiol. 2014;306:F367–F378. doi: 10.1152/ajprenal.00571.2013. - DOI - PubMed