. 2022 Apr 26;11(5):847.
doi: 10.3390/antiox11050847.

NiONP-Induced Oxidative Stress and Mitochondrial Impairment in an In Vitro Pulmonary Vascular Cell Model Mimicking Endothelial Dysfunction

Affiliations

NiONP-Induced Oxidative Stress and Mitochondrial Impairment in an In Vitro Pulmonary Vascular Cell Model Mimicking Endothelial Dysfunction

Ophélie Germande et al. Antioxidants (Basel). .

Abstract

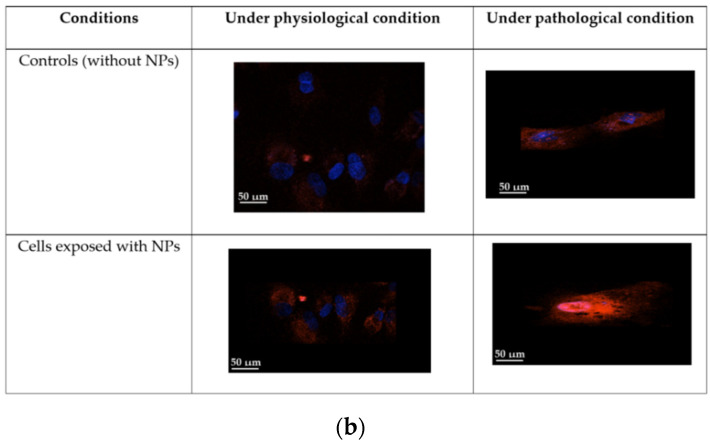
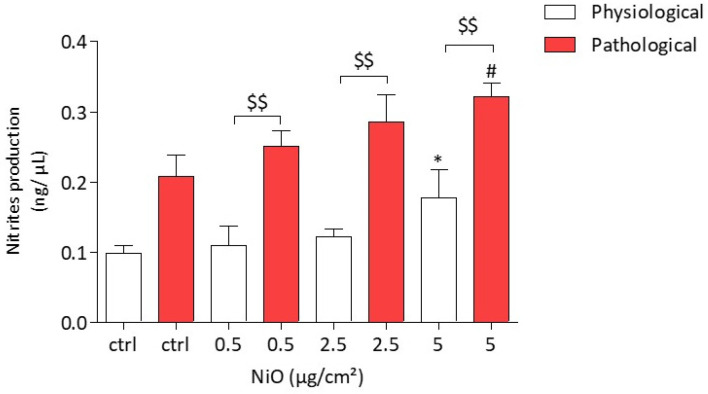
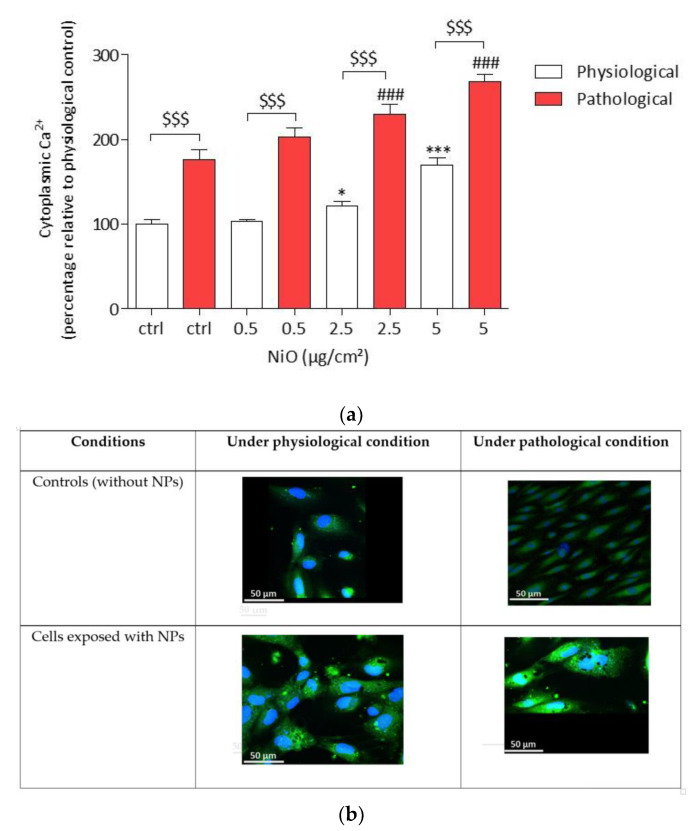
The development and use of nanomaterials, especially of nickel oxide nanoparticles (NiONPs), is expected to provide many benefits but also has raised concerns about the potential human health risks. Inhaled NPs are known to exert deleterious cardiovascular side effects, including pulmonary hypertension. Consequently, patients with pulmonary hypertension (PH) could be at increased risk for morbidity. The objective of this study was to compare the toxic effects of NiONPs on human pulmonary artery endothelial cells (HPAEC) under physiological and pathological conditions. The study was conducted with an in vitro model mimicking the endothelial dysfunction observed in PH. HPAEC were cultured under physiological (static and normoxic) or pathological (20% cycle stretch and hypoxia) conditions and exposed to NiONPs (0.5-5 μg/cm2) for 4 or 24 h. The following endpoints were studied: (i) ROS production using CM-H2DCF-DA and MitoSOX probes, (ii) nitrite production by the Griess reaction, (iii) IL-6 secretion by ELISA, (iv) calcium signaling with a Fluo-4 AM probe, and (v) mitochondrial dysfunction with TMRM and MitoTracker probes. Our results evidenced that under pathological conditions, ROS and nitrite production, IL-6 secretions, calcium signaling, and mitochondria alterations increased compared to physiological conditions. Human exposure to NiONPs may be associated with adverse effects in vulnerable populations with cardiovascular risks.

Keywords: calcium; cyclic stretch; endothelial dysfunction; human pulmonary artery endothelial cells; mitochondria alteration; nickel oxide nanoparticles; reactive oxygen species.


Conflict of interest statement

The authors declare no conflict of interest.

Figures

Figure 1
Figure 1
(a) Acellular NiONP ROS production measured by spectrofluorimetry with the H2DCF-DA probe. The results were expressed as the H2DCF probe fluorescence intensity relative to controls (medium without NiONPs). *** p < 0.001 vs. control according to Kruskal–Wallis test followed by a Dunn’s multiple comparison test. (b,c) HPAEC after 20 h of culture, either under physiological or pathological conditions, observed by phase contrast microscopy (PCM) at 600× magnification. (b) Untreated cells under static conditions in normoxia. (c) Untreated cells under 20% CS in hypoxia.
Figure 1
Figure 1
(a) Acellular NiONP ROS production measured by spectrofluorimetry with the H2DCF-DA probe. The results were expressed as the H2DCF probe fluorescence intensity relative to controls (medium without NiONPs). *** p < 0.001 vs. control according to Kruskal–Wallis test followed by a Dunn’s multiple comparison test. (b,c) HPAEC after 20 h of culture, either under physiological or pathological conditions, observed by phase contrast microscopy (PCM) at 600× magnification. (b) Untreated cells under static conditions in normoxia. (c) Untreated cells under 20% CS in hypoxia.
Figure 2
Figure 2
ROS production in HPAEC after a 4 h exposure to NiONPs (0.5–5 μg/cm2) under physiological and pathological conditions, as measured by spectrofluorimetry with the CMH2DCF-DA probe. The results were expressed as the percentage of CMH2DCF probe fluorescence intensity relative to physiological controls. Data were mean ± SEM of three independent experiments (n = 3) performed in quadruplicate. *** p < 0.001 vs. untreated cells in 0% CS in normoxic conditions. # p < 0.05 and ### p < 0.001 vs. untreated cells in pathological conditions. $ p < 0.05 and $$ p < 0.01 between both conditions. According to Kruskal–Wallis test followed by a Dunn’s multiple comparison test.
Figure 3
Figure 3
Mitochondrial O2 production in HPAEC after a 4 h exposure to NiONPs (0.5–5 μg/cm2) under physiological and pathological conditions, measured by confocal microscopy. (a) The values were normalized to the untreated physiological cells and results were expressed as the percentage of the MitoSox probe fluorescence intensity relative to the control cells. (b) HPAEC observed by confocal microscopy at focus 60×, under physiological and pathological conditions, without or with NiONPs (2.5 µg/cm²), with mitochondria marked in red, with MitoSox probe and nucleus in blue, with Hoechst probe. Data were mean ± SEM of three independent experiments (n = 3) performed in quadruplicate. * p < 0.05 and *** p < 0.001 vs. untreated cells in 0% CS in normoxic conditions. ## p < 0.01 and ### p < 0.001 vs. untreated cells in pathological conditions. $$ p < 0.01 and $$$ p < 0.001 between both conditions. According to one-way ANOVA followed by Tukey’s post hoc test for multiple comparisons.
Figure 3
Figure 3
Mitochondrial O2 production in HPAEC after a 4 h exposure to NiONPs (0.5–5 μg/cm2) under physiological and pathological conditions, measured by confocal microscopy. (a) The values were normalized to the untreated physiological cells and results were expressed as the percentage of the MitoSox probe fluorescence intensity relative to the control cells. (b) HPAEC observed by confocal microscopy at focus 60×, under physiological and pathological conditions, without or with NiONPs (2.5 µg/cm²), with mitochondria marked in red, with MitoSox probe and nucleus in blue, with Hoechst probe. Data were mean ± SEM of three independent experiments (n = 3) performed in quadruplicate. * p < 0.05 and *** p < 0.001 vs. untreated cells in 0% CS in normoxic conditions. ## p < 0.01 and ### p < 0.001 vs. untreated cells in pathological conditions. $$ p < 0.01 and $$$ p < 0.001 between both conditions. According to one-way ANOVA followed by Tukey’s post hoc test for multiple comparisons.
Figure 4
Figure 4
Nitrite production in HPAEC after a 24 h exposure to NiONPs (0.5–5 μg/cm2) under physiological and pathological conditions, measured by Griess reaction. The results were expressed as ng/µL in the supernatant. Data are mean ± SEM of five independents experiments (n = 5) performed in quadruplicate. * p < 0.05 vs. untreated cells in 0% CS in normoxic conditions. # p < 0.05 vs. untreated cells in pathological conditions. $$ p < 0.01 between both conditions. According to Kruskal–Wallis test followed by a Dunn’s multiple comparison test.
Figure 5
Figure 5
IL-6 production in HPAEC after a 24 h exposure to NiONPs (0.5–5 μg/cm2) under physiological and pathological conditions measured by ELISA. The results were expressed as pg/mg of protein. Data are mean ± SEM of five independents experiments (n = 5) performed in quadruplicate. * p < 0.05 vs. untreated cells in 0% CS in normoxic conditions. ## p < 0.01 vs. untreated cells in pathological conditions. $ p < 0.05 between both conditions. According to Kruskal–Wallis test followed by a Dunn’s multiple comparison test.
Figure 6
Figure 6
Resting [Ca2+]c in HPAEC cells after a 4 h exposure to NiONPs (0.5–5 μg/cm2) in physiological and pathological conditions, measured with Fluo-4 probe (1 µM) by confocal microscopy. (a) The values were normalized to the untreated physiological cells and results were expressed as the percentage of the Fluo-4-AM probe fluorescence intensity relative to the physiological controls. (b) HPAEC observed by confocal microscopy at focus ×60, under physiological and pathological conditions, without or with NiONPs (5 µg/cm2), with cytoplasmic calcium marked in green with Fluo-4-AM probe and nucleus in blue with Hoechst probe. Data were mean ± SEM of three independents experiments (n = 3) performed in quadriplicate. * p < 0.05 and *** p < 0.001 vs. untreated cells in 0% CS in normoxic conditions. ### p < 0.001 vs. untreated cells in pathological conditions. $$$ p < 0.001 between both conditions. According to one-way ANOVA followed by Tukey’s post-test for multiple comparisons.
Figure 7
Figure 7
(a) ΨMP in HPAEC after a 4 h exposure to NiONPs (0.5–5 μg/cm2) in physiological and pathological conditions was measured with TMRM probe (100 nM) by confocal microscopy. (b) HPAEC observed by confocal microscopy at focus 60×, under physiological and pathological conditions, without or with NiONPs (5 µg/cm2), with ΨMP marked in red with TMRM probe and nucleus in blue with Hoechst probe. (c) Mitochondrial mass in HPAEC after a 4 h exposure to NiONPs (0.5–5 μg/cm2) in physiological and pathological conditions was measured with MitoTracker probe (1 µM) by confocal microscopy. The values were normalized to the untreated physiological cells and results were expressed as the fold change of the probes fluorescence intensity relative to the control cells. (d) HPAEC observed by confocal microscopy at focus 60×, under physiological and pathological conditions, without or with NiONPs (5 µg/cm2), with mitochondrial mass marked in green with MitoTracker probe and nucleus in blue with Hoechst probe. Data were mean ± SEM of three independents experiments (n = 3) performed in quadriplicate. *** p < 0.001 vs. untreated cells in 0% CS in normoxic conditions. ### p < 0.001 vs. untreated cells in pathological conditions. $$$ p < 0.001 between both conditions. According to one-way ANOVA followed by Tukey’s post hoc test for multiple comparisons.
Figure 7
Figure 7
(a) ΨMP in HPAEC after a 4 h exposure to NiONPs (0.5–5 μg/cm2) in physiological and pathological conditions was measured with TMRM probe (100 nM) by confocal microscopy. (b) HPAEC observed by confocal microscopy at focus 60×, under physiological and pathological conditions, without or with NiONPs (5 µg/cm2), with ΨMP marked in red with TMRM probe and nucleus in blue with Hoechst probe. (c) Mitochondrial mass in HPAEC after a 4 h exposure to NiONPs (0.5–5 μg/cm2) in physiological and pathological conditions was measured with MitoTracker probe (1 µM) by confocal microscopy. The values were normalized to the untreated physiological cells and results were expressed as the fold change of the probes fluorescence intensity relative to the control cells. (d) HPAEC observed by confocal microscopy at focus 60×, under physiological and pathological conditions, without or with NiONPs (5 µg/cm2), with mitochondrial mass marked in green with MitoTracker probe and nucleus in blue with Hoechst probe. Data were mean ± SEM of three independents experiments (n = 3) performed in quadriplicate. *** p < 0.001 vs. untreated cells in 0% CS in normoxic conditions. ### p < 0.001 vs. untreated cells in pathological conditions. $$$ p < 0.001 between both conditions. According to one-way ANOVA followed by Tukey’s post hoc test for multiple comparisons.

Similar articles

Cited by

References

    1. Miller M.R., Raftis J.B., Langrish J.P., McLean S.G., Samutrtai P., Connell S.P., Wilson S., Vesey A.T., Fokkens P.H.B., Boere A.J.F., et al. Inhaled Nanoparticles Accumulate at Sites of Vascular Disease. ACS Nano. 2017;11:4542–4552. doi: 10.1021/acsnano.6b08551. - DOI - PMC - PubMed
    1. Mills N.L., Donaldson K., Hadoke P.W., Boon N.A., MacNee W., Cassee F.R., Sandstrom T., Blomberg A., Newby D.E. Adverse cardiovascular effects of air pollution. Nat. Clin. Pract. Cardiovasc. Med. 2009;6:36–44. doi: 10.1038/ncpcardio1399. - DOI - PubMed
    1. Schulz H., Harder V., Ibald-Mulli A., Khandoga A., Koenig W., Krombach F., Radykewicz R., Stampfl A., Thorand B., Peters A. Cardiovascular effects of fine and ultrafine particles. J. Aerosol Med. Off. J. Int. Soc. Aerosols Med. 2005;18:1–22. doi: 10.1089/jam.2005.18.1. - DOI - PubMed
    1. Oberdorster G. Pulmonary effects of inhaled ultrafine particles. Int. Arch. Occup. Environ. Health. 2001;74:1–8. doi: 10.1007/s004200000185. - DOI - PubMed
    1. Imran Din M., Rani A. Recent Advances in the Synthesis and Stabilization of Nickel and Nickel Oxide Nanoparticles: A Green Adeptness. Int. J. Anal. Chem. 2016;2016:3512145. doi: 10.1155/2016/3512145. - DOI - PMC - PubMed

LinkOut - more resources