. 2022 Apr 27;11(5):855.
doi: 10.3390/antiox11050855.

OPDAylation of Thiols of the Redox Regulatory Network In Vitro

Affiliations

OPDAylation of Thiols of the Redox Regulatory Network In Vitro

Madita Knieper et al. Antioxidants (Basel). .

Abstract

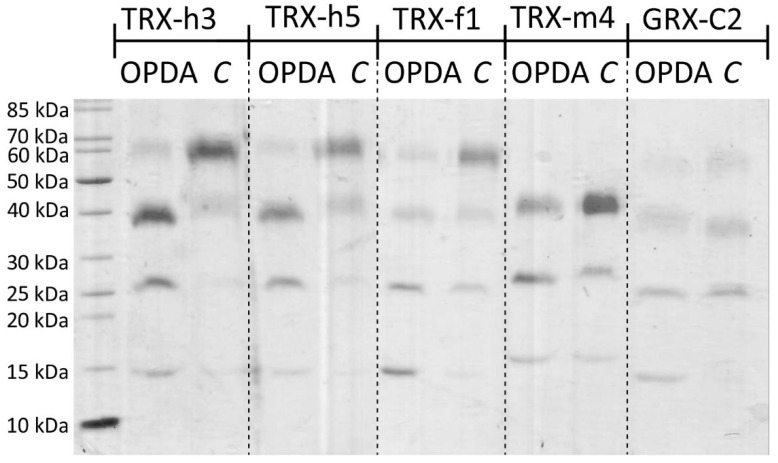
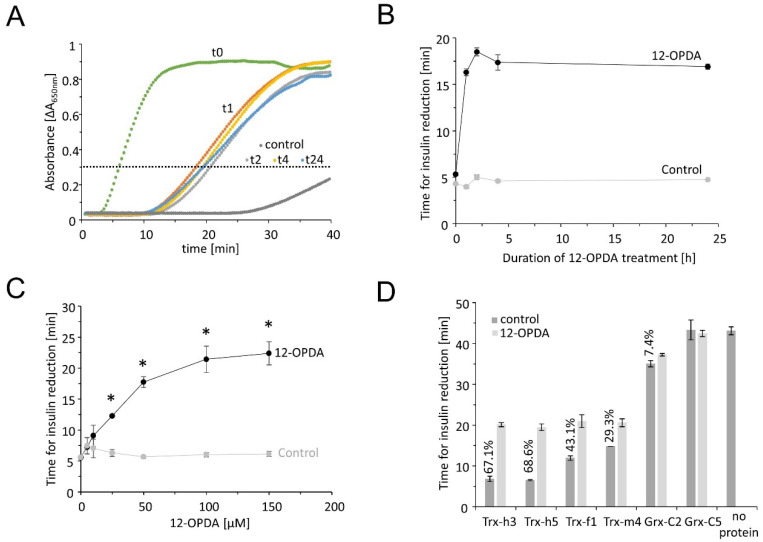
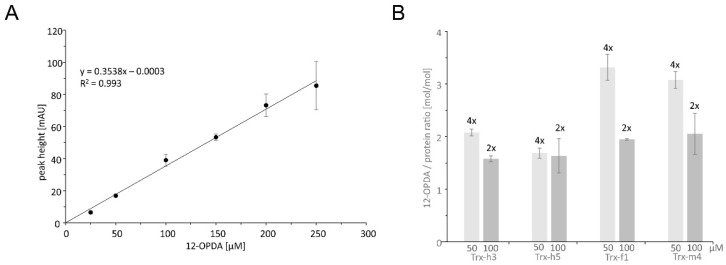
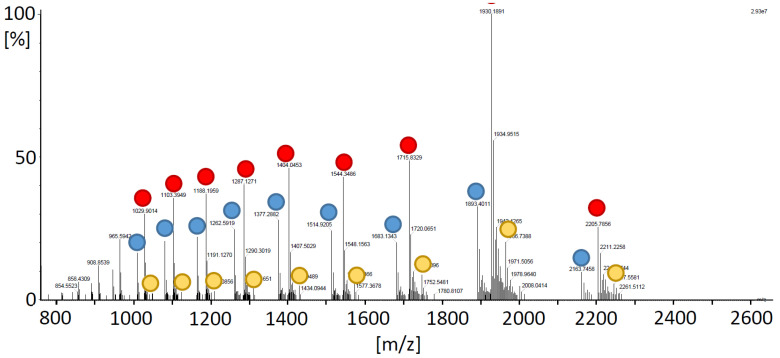
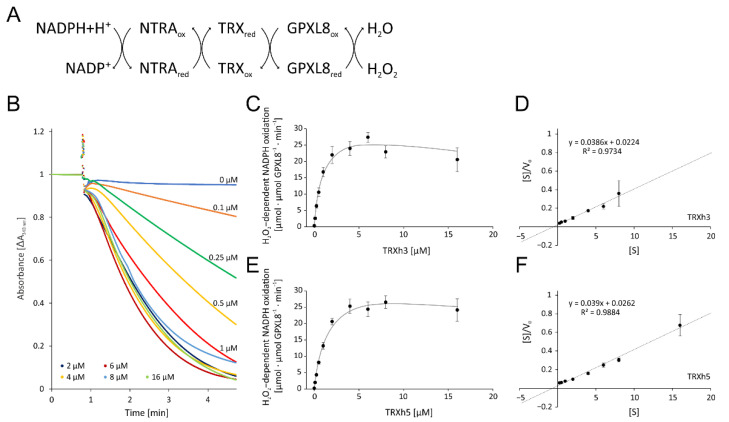
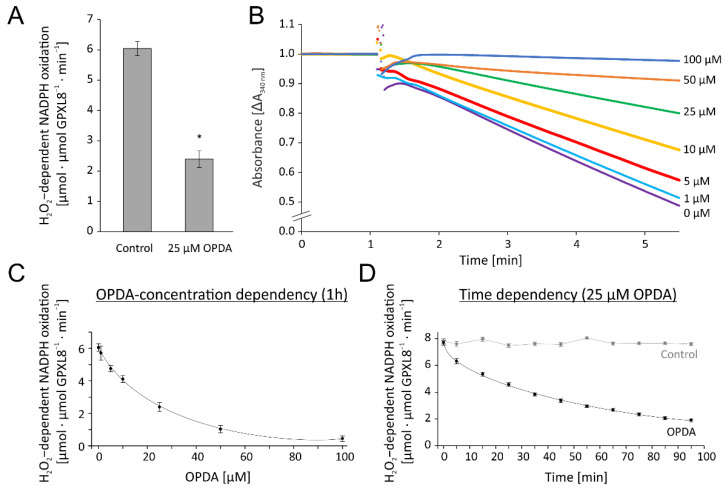
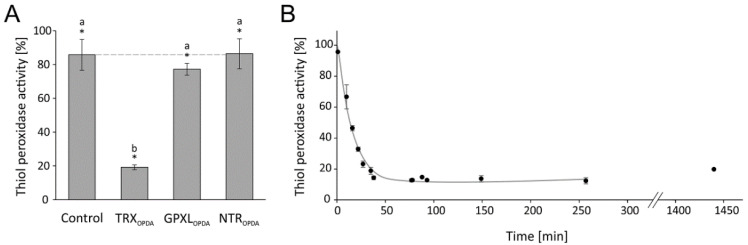
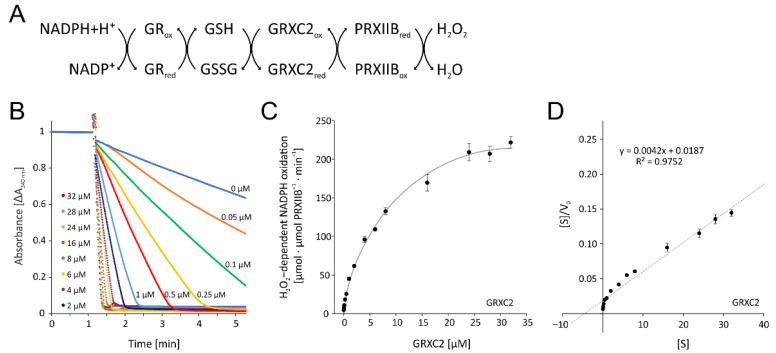
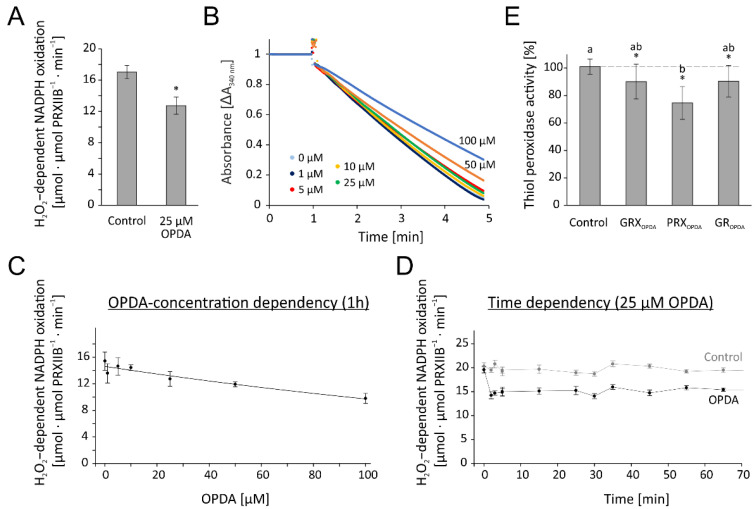
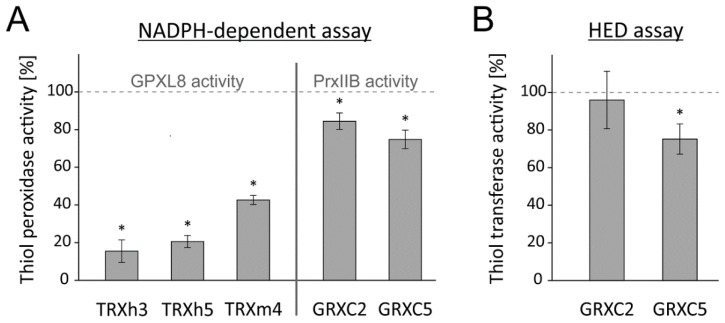
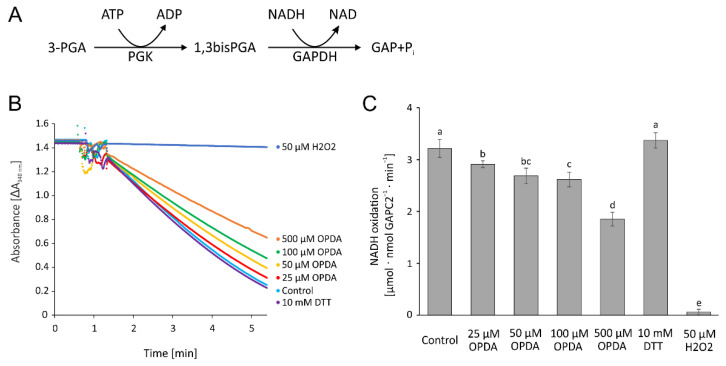
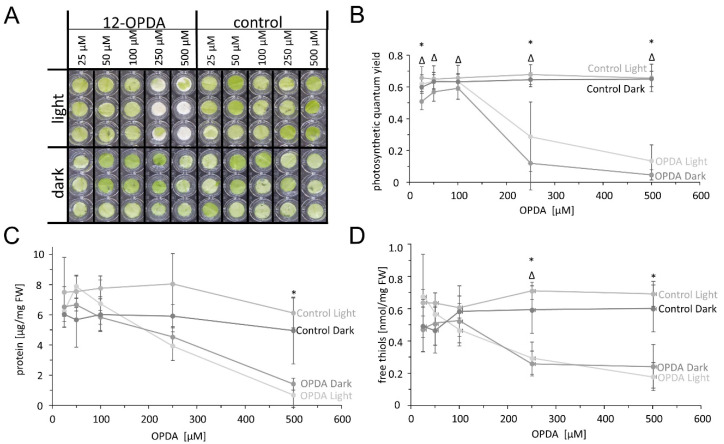
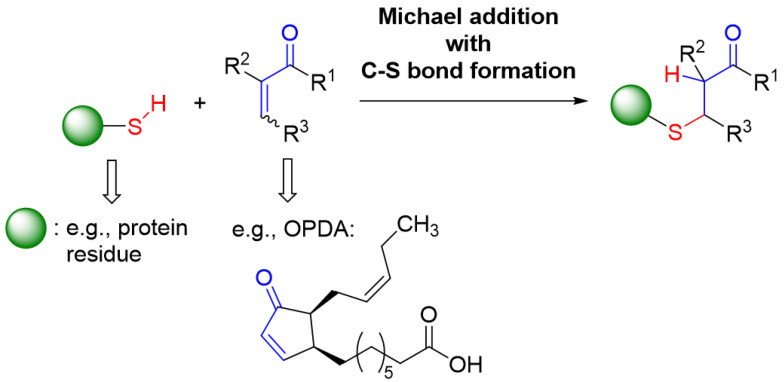
cis-(+)-12-Oxophytodienoic acid (OPDA) is a reactive oxylipin produced by catalytic oxygenation of polyunsaturated α-linolenic acid (18:3 (ω - 3)) in the chloroplast. Apart from its function as precursor for jasmonic acid synthesis, OPDA serves as a signaling molecule and regulator on its own, namely by tuning enzyme activities and altering expression of OPDA-responsive genes. A possible reaction mechanism is the covalent binding of OPDA to thiols via the addition to the C=C double bond of its α,β-unsaturated carbonyl group in the cyclopentenone ring. The reactivity allows for covalent modification of accessible cysteinyl thiols in proteins. This work investigated the reaction of OPDA with selected chloroplast and cytosolic thioredoxins (TRX) and glutaredoxins (GRX) of Arabidopsis thaliana. OPDA reacted with TRX and GRX as detected by decreased m-PEG maleimide binding, consumption of OPDA, reduced ability for insulin reduction and inability to activate glyceraldehyde-3-phosphate dehydrogenase and regenerate glutathione peroxidase (GPXL8), and with lower efficiency, peroxiredoxin IIB (PRXIIB). OPDAylation of certain protein thiols occurs quickly and efficiently in vitro and is a potent post-translational modification in a stressful environment.

Keywords: Arabidopsis thaliana; oxylipin; posttranslational modification; thiol; thioredoxin.


Conflict of interest statement

The authors declare that they encounter no conflict of interest.

Figures

Figure 1
Figure 1
Blocking of exposed thiols of TRXs and GRXC2 by OPDA as indicated by less mPEGmal binding. Recombinant TRX-h3, TRX-h5, TRX-f1, TRX-m4 and GRX-C2 were reduced and desalted, and either treated with 150 µM OPDA or the equivalent amount of the solvent ethanol (“C”). Samples were treated with mPEG-maleimide 5000 to label free thiols. Shifts to increased apparent molecular mass indicates thiol accessibility for modification, while the lack of shifts indicates inaccessibility of thiols after treatment with OPDA. Similar results were seen in 4 experiments. Band quantification is presented in Supplementary Figure S1.
Figure 2
Figure 2
Insulin reduction catalyzed by the redox transmitters TRX-f1, -m4, -h3, -h5 or GRX-C2 with or without 150 µM OPDA pretreatment. Recombinant TRX-f1, TRX-m4, TRX-h3, TRX-h5 and GRX-C2 were reduced and desalted, and either treated with OPDA or the equivalent amount of ethanol as solvent control. In total, 160 µM insulin was placed in the well of a 96-well plate and 5 µM test protein added at t = 0 min. Absorbance increase indicates reduction and precipitation of insulin. (A) Exemplary spectroscopic recordings with TRX-h3. The horizontal line indicates the threshold for detailed analysis. Protein was incubated with 12-OPDA for 0 (referred to as t0), 1 (t1), 2 (t2), 4 (t4) or 24 (t24) hours prior to the insulin reduction assay. Additionally, the DTT control is shown in grey. In this case, the absorbance recording remained below the threshold throughout the recorded time span. (B) Time-dependent effect of OPDA on reduction activity of TRX-h3. Data are means ± SD of n = 5. Time [min] refers to the time needed to reach the threshold of ΔA650 nm = 0.3. (C) Concentration-dependent effect of OPDA treatment for 1 h on activity of TRX-h3. Data are means ± SD of n ≥ 4. Significance of difference was determined using t-test (p < 0.001) and is marked with *. (D) Comparison of activity of the redox transmitters and inhibitory effect of OPDA [%]. Data are means ± SD of n = 5.
Figure 3
Figure 3
Quantification of OPDA residues bound to TRX-f1, -m4, -h3 and -h5 by HPLC analysis. In total, 200 µM of 12-OPDA was incubated with either 50 or 100 µM of recombinant TRX-h3, TRX-h5, TRX-f1 and TRX-m4 or an equivalent amount of phosphate buffer. Proteins were reduced and desalted prior to the incubation. After 2 h, the amount of free unbound OPDA was determined by reverse phase HPLC. The determined remaining free OPDA was then subtracted from the total amount used for incubation with protein to obtain the amount of OPDA bound to the protein. This value was further divided by the protein concentration to obtain the molar OPDA/protein ratio. (A) Different OPDA concentrations were used to generate a standard curve based on peak height [mAU] at the retention time of 14.200 ± 0.014 min. Data are means ± SD of n ≥ 3. (B) Ratio of OPDA bound to recombinant TRX-f1, TRX-m4, TRX-h3 and TRX-h5 with molar excess of OPDA indicated above each bar. The change in free OPDA concentration was calculated using the standard curve shown in (A). Data are means ± SD of n ≥ 3.
Figure 4
Figure 4
MS analysis of OPDAylated TRX-h3. TRX-h3 (20 µM, in 50 mM NH4Ac) was incubated with 150 µM OPDA overnight and applied to the mass spectrometer. The mass spectrum shows several charge states (z = 7 to 15) of the free TRX-h3 (mass of 15139.12 ± 0.07 Da; blue dots), single OPDA-bound form with a mass of 15,433.43 ± 0.02 Da (red dots) and double OPDAylated form of 15,725.80 ± 0.22 Da (yellow dots).
Figure 5
Figure 5
Optimization of the glutathione peroxidase-dependent H2O2 detoxification assay. (A) Scheme of the reaction sequence. (B) Representative spectrophotometric recordings adjusted to identical time point of H2O2 addition and similar baselines of TRXh3 concentration-dependent reduction of H2O2 by 3 µM GPXL8. The assay contained 1 µM NTRA, 200 µM NADPH, 300 µM H2O2 and variable TRXh3 concentrations as indicated. The initial linear rate was used for quantification. (C) TRXh3 concentration dependency. (D) Hanes–Woolf plot of GPXL8 and 0.25–8 µM TRXh3 as electron donor according to (C). (E) TRXh5 concentration dependency. (F) Hanes–Woolf plot of GPXL8 and 0.25–16 µM TRXh5 as electron donor according to (E). Data are means ± SD of n ≥ 6 (CF).
Figure 6
Figure 6
OPDA effect on glutathione peroxidase-like (GPXL)-dependent H2O2 detoxification using the reconstituted assay. (A) Effect of 25 µM OPDA on TRXh3-dependent GPXL8 activity. The reaction mix contained 200 µM NADPH, 1 µM NTRA, 0.25 µM TRX-h3, 3 µM GPXL8 and was incubated for 1h with 25 µM OPDA. After recording a baseline, the reaction was started by the addition of 300 µM H2O2 at t = 1 min. Significance of difference was determined using t-test (p < 0.001) and is marked with *. (B) Representative absorbance recordings matched to the time point prior to H2O2 addition and similar baselines of OPDA concentration-dependent activity of GPXL8. The tests were performed in the presence of 0–100 µM OPDA. The control (0 µM OPDA) contained the maximum content of the solvent ethanol according to 100 µM OPDA. Other parameters were as in (A). (C) OPDA concentration dependency of GPXL8-mediated H2O2 reduction with 0.25 µM TRX-h3 according to (B). (D) Time-dependent effect of 25 µM OPDA on GPXL8-mediated H2O2 reduction with 0.25 µM TRXh3. Other parameters were as in (A). Data are means ± SD of n ≥ 6 (A,C,D).
Figure 7
Figure 7
Relative glutathione peroxidase-dependent H2O2 detoxification after preincubation of single components with OPDA. (A) In total, 20 µM reduced and desalted recombinant protein (NTRA, TRX-h3 or GPXL8) was preincubated with 150 µM OPDA for 1h. The pretreated proteins were added to the otherwise untreated assay components as described before: 200 µM NADPH, 1 µM NTRA, 0.25 µM TRX-h3, 3 µM GPXL8 and 300 µM H2O2. To ensure comparative results, the final OPDA concentration in the reaction mix was 22.5 µM OPDA always. The GPXL8 activity was measured and related to measurements in absence of OPDA but pretreated with the solvent ethanol. Data are means ± SD of n = 6. Significance of difference between the components was determined using ANOVA, followed by post hoc Tukey test and is marked with letters a and b. * marks significant differences to corresponding measurements without OPDA as determined by t-test (p < 0.05). (B). In total, 20 µM reduced TRX-h3 was incubated with 150 µM OPDA and the time-dependent effect of OPDA on TRX-h3-dependent GPXL8 activity was measured for 24 h. The assay contained 200 µM NADPH, 1 µM NTRA, 0.25 µM preincubated TRX-h3, 3 µM GPXL8 and 300 µM H2O2. Data are means ± SD of n = 3.
Figure 8
Figure 8
Optimization of the peroxiredoxin IIB-dependent peroxide detoxification assay using the reconstituted system. (A) Scheme of the reaction sequence. (B) Representative spectroscopic recordings matched to the time point of H2O2 addition and similar baselines of GRXC2 concentration-dependent reduction of H2O2 by 3 µM PRXIIB. The assay contained 200 µM NADPH, 1 µM GR, 2 mM glutathione, 3 µM PRXIIB, 300 µM H2O2 and variable GRXC2 concentrations as indicated. The initial linear rate was used for quantification. (C) GRXC2 concentration dependency of H2O2 reduction by PRXIIB. (D) Hanes–Woolf plot of PRXIIB and 0.05–32 µM GRXC2 as electron donor according to (C). Data are means ± SD of n = 6 (C,D).
Figure 9
Figure 9
OPDA effect on peroxiredoxin IIB-dependent peroxide detoxification using the reconstituted system. (A) Effect of 25 µM OPDA on GRXC2-dependent PRXIIB activity. The reaction mix was incubated for 1 h. The assay was performed with 200 µM NADPH, 2 mM glutathione, 1 µM GR, 0.25 µM GRXC2, 3 µM PRXIIB and 300 µM H2O2. Data are means ± SD of n = 6. Significance of difference was determined using t-test (p = 0.0013) and is marked with *. (B) Representative absorbance recordings adjusted to the identical time point of H2O2 addition and similar baselines. The reaction started by the addition of 300 µM H2O2 at t = 1 min. The tests were performed in the presence of 0–100 µM OPDA. (C) OPDA concentration dependency of PRXIIB-mediated H2O2 reduction with 0.25 µM GRXC2 according to (B). Other parameters were as in (A). Data are means ± SD of n = 6. (D) Time-dependent effect of 25 µM OPDA on PRXIIB-mediated H2O2 reduction with 0.25 µM GRXC2. Other parameters were as in (A). Data are means ± SD of n ≥ 6. (E) Relative glutathione peroxidase-dependent H2O2 detoxification after preincubation of single components with OPDA. In total, 20 µM reduced and desalted recombinant protein (GR, GRXC2, PRXIIB) was preincubated with 150 µM OPDA for 1 h. The pretreated proteins were added to the otherwise untreated assay components as described in (A). To ensure comparative results, the final OPDA concentration within the reaction mix was 22.5 µM OPDA in all assays. The PRXIIB activity was measured and related to results in absence of OPDA but pretreated with the solvent ethanol. Data are means ± SD of n ≥ 12. Significance of difference between the components was determined using ANOVA, followed by post hoc Tukey test and is marked with letters a and b. * marks significant differences to corresponding measurements without OPDA as determined by t-test (p < 0.05).
Figure 10
Figure 10
OPDA effect on thiol peroxidase-dependent H2O2 detoxification using the reconstituted system and on the thiol reduction activity of GRXs. (A) In total, 20 µM reduced TRX-h3, TRX-h5, TRX-m4, GRXC2 and GRXC5 were incubated with 150 µM OPDA for 1 h. The GPXL8-dependent activity was measured using TRX-h3 (0.25 µM), TRX-h5 (0.25 µM) or TRX-m4 (5 µM) and the PRXIIB-dependent activity using GRXC2 (0.25 µM) and GRXC5 (0.25 µM), after 1 h preincubation as described before. Data are means ± SD of n ≥ 6. Significance of difference was determined using t-test (p < 0.05) and is marked with *. (B) HED assay to determine GRX-dependent reduction activity. In total, 20 µM reduced GRXC2 and GRXC5 were incubated with 150 µM OPDA for 1 h. The activity in the HED assay was measured after 1 h preincubation. The assay contained 200 µM NADPH, 2 mM GSH, 0.7 mM HED, 1 µM GR and 0.1 µM GRXC2. Data are means ± SD of n ≥ 12. * marks significant differences to corresponding measurements without OPDA as determined by t-test (p < 0.001).
Figure 11
Figure 11
OPDA effect on cytosolic glyceraldehyde-3-phosphate dehydrogenase C2 activity. (A) Reaction scheme. (B) Representative absorbance recordings normalized to the identical time point of GAPC2 addition and similar baselines after the addition of 15 nM GAPC2. In total, 1 µM reduced and desalted GAPC2 was pre-incubated with 25–500 µM OPDA, 50 µM H2O2, and 10 mM DTT, respectively, and in the presence of 140 µM NAD for 1 h and then transferred to the GAPC2-activity test. The control containing the equivalent amount of the solvent ethanol was also preincubated for 1 h. The test contained 4 mM ATP, 8 mM 3-phosphoglycerate, 90 nM A. thaliana phosphoglycerate kinase, 260 µM NADH+H+ and 15 nM GAPC2. (C) OPDA concentration-dependent GAPC2 activity as described in (B). Data are means ± SD of n ≥ 6. Significance of difference was determined using ANOVA, followed by post hoc Tukey test and is marked with letters a–e.
Figure 12
Figure 12
Concentration-dependent effect of OPDA on leaf disc metabolism. (A) Exemplary phenotype documentation after 24 h continuous light or darkness. (B) Changes in photosynthetic quantum yield of PSII in response to treatment with OPDA. Photosynthetic quantum yield was determined by chlorophyll a fluorescence analysis using the Mini-PAM. Data are means ± SD (n = 24). (C) Protein and (D) free thiol contents were measured after the treatment. Data represent means ± SD of n = 3. * and Δ mark significant differences to control in light and dark, respectively, as determined by t-test (p < 0.05).
Figure 13
Figure 13
General reaction scheme for the addition of a thiol moiety (e.g., being present in a protein) to an α,β-unsaturated carbonyl compound as a Michael acceptor such as, e.g., OPDA.

Similar articles

Cited by

References

    1. Maynard D., Gröger H., Dierks T., Dietz K.J. The function of the oxylipin 12-oxophytodienoic acid in cell signaling, stress acclimation, and development. J. Exp. Bot. 2018;69:5341–5354. doi: 10.1093/jxb/ery316. - DOI - PubMed
    1. Wasternack C., Feussner I. The oxylipin pathways: Biochemistry and function. Ann. Rev. Plant Biol. 2018;69:363–386. doi: 10.1146/annurev-arplant-042817-040440. - DOI - PubMed
    1. Zhao X., Li N.N., Song Q., Li X.H., Meng H.J., Luo K.M. OPDAT1, a plastid envelope protein involved in 12-oxo-phytodienoic acid export for jasmonic acid biosynthesis in Populus. Tree Physiol. 2021;41:1714–1728. doi: 10.1093/treephys/tpab037. - DOI - PubMed
    1. Guan L., Denkert N., Eisa A., Lehmann M., Sjuts I., Weiberg A., Soll J., Meinecke M., Schwenkert S. JASSY, a chloroplast outer membrane protein required for jasmonate biosynthesis. Proc. Natl. Acad. Sci. USA. 2019;116:10568–10575. doi: 10.1073/pnas.1900482116. - DOI - PMC - PubMed
    1. Monte I., Zamarreno A.M., Hamberg M., Lassueur S., Reymond P., Weiss S., Stintzi A., Schaller A., Porzel A., Garcia-Mina J.M., et al. An OPR3-independent pathway uses 4,5-didehydrojasmonate for jasmonate synthesis. Nat. Chem. Biol. 2018;14:171–178. - PubMed

LinkOut - more resources