. 2022 Apr 22;10(5):975.
doi: 10.3390/biomedicines10050975.

Incorporation of Oxidized Phenylalanine Derivatives into Insulin Signaling Relevant Proteins May Link Oxidative Stress to Signaling Conditions Underlying Chronic Insulin Resistance

Affiliations

Incorporation of Oxidized Phenylalanine Derivatives into Insulin Signaling Relevant Proteins May Link Oxidative Stress to Signaling Conditions Underlying Chronic Insulin Resistance

Judit Mohás-Cseh et al. Biomedicines. .

Abstract

A link between oxidative stress and insulin resistance has been suggested. Hydroxyl free radicals are known to be able to convert phenylalanine (Phe) into the non-physiological tyrosine isoforms ortho- and meta-tyrosine (o-Tyr, m-Tyr). The aim of our study was to examine the role of o-Tyr and m-Tyr in the development of insulin resistance. We found that insulin-induced uptake of glucose was blunted in cultures of 3T3-L1 grown on media containing o- or m-Tyr. We show that these modified amino acids are incorporated into cellular proteins. We focused on insulin receptor substrate 1 (IRS-1), which plays a role in insulin signaling. The activating phosphorylation of IRS-1 was increased by insulin, the effect of which was abolished in cells grown in m-Tyr or o-Tyr media. We found that phosphorylation of m- or o-Tyr containing IRS-1 segments by insulin receptor (IR) kinase was greatly reduced, PTP-1B phosphatase was incapable of dephosphorylating phosphorylated m- or o-Tyr IRS-1 peptides, and the SH2 domains of phosphoinositide 3-kinase (PI3K) bound the o-Tyr IRS-1 peptides with greatly reduced affinity. According to our data, m- or o-Tyr incorporation into IRS-1 modifies its protein-protein interactions with regulating enzymes and effectors, thus IRS-1 eventually loses its capacity to play its role in insulin signaling, leading to insulin resistance.

Keywords: IRS-1; dephosphorylation; hydroxyl free radical; insulin resistance; meta-tyrosine; ortho-tyrosine; oxidative stress; phosphorylation.


Conflict of interest statement

The authors declare no conflict of interest. The funders had no role in the design of the study; in the collection, analyses, or interpretation of data; in the writing of the manuscript, or in the decision to publish the results.

Figures

Figure 1
Figure 1
Chronic exposure leading to oxidative stress and insulin resistance [6,10,11,12,13,14,15,16,17,18,19,20,21,22,23,24,25,26,27,28,29,30,31,32,33]. Those factors are listed which cause oxidative stress and insulin resistance at the same time in a chronic setting. The arrows indicate a causal relationship between alterations in the circulation leading to intracellular abnormalities.
Figure 2
Figure 2
Hydroxyl free radical induced production of tyrosine isomers.
Figure 3
Figure 3
Insulin-dependent uptake of deoxy-D-glucose 2-[1 2-3H(N)] into differentiated 3T3-L1 adipocytes was assessed in media containing (i) para-tyrosine with 5 mmol/L glucose content (white column and first striated column in each block), (ii) meta-tyrosine with 5 mmol/L glucose (dark grey column and second striated column in each block), (iii) ortho-tyrosine with 5 mmol/L glucose (light grey column and third striated column in each block), and (iv) para-tyrosine with 25 mmol/L glucose content (black column and fourth striated column in each block). Cells were treated with 2, 20, 200, and 400 nmol/L insulin as shown (#, p < 0.05 vs. control para-tyrosine using one-sample t-test, *, p < 0.05 vs. 5 mmol/L glucose para-tyrosine using independent samples t-tests). Glucose uptake of untreated cells grown on para-tyrosine and 5 mmol/L glucose containing medium was set to 100%. Results are shown as a mean ± SEM for n = 5–10 individual measurements.
Figure 4
Figure 4
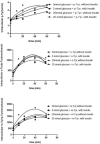
Insulin-dependent uptake of deoxy-D-glucose 2-[1 2-3H(N)] into 3T3-L1 adipocytes after cells were grown in media containing para-tyrosine meta-tyrosine or ortho-tyrosine for 1, 2, 3, 4, 5, or 12 days, with or without insulin treatment (200 nmol/L). The glucose uptake of untreated adipocytes grown on 5 mmol/L glucose medium containing para-tyrosine was set to 100%. Results are shown as a mean ± SEM for n = 5–8 individual measurements. #, p < 0.05 vs. para-tyrosine control (one-sample t-test); *, p< 0.05 vs. para-tyrosine + insulin (independent samples t-test), NS: non-significant. Bars indicate para-tyrosine (white column), meta-tyrosine (dark grey columns), ortho-tyrosine (light grey columns), control (simple columns), and insulin-treated (striated columns).
Figure 5
Figure 5
para-Tyr reverses the inhibitory effects of o- and m-Tyr. Examination of deoxy-D-glucose 2-[1 2-3H(N)] uptake of 3T3-L1 adipocytes depending on the ortho- and meta-tyrosine content of the medium in the absence of insulin (non-striated bars) or in the presence of 400 nmol/L insulin (corresponding striated bars). The basal glucose uptake of the cells, grown on the original 0.39 mmol/L para-tyrosine containing medium was considered to be 100%. Results are shown as mean ± SEM after n = 10 individual measurements. *, p < 0.05 vs. para-tyrosine + insulin (independent samples t-test), #, p < 0.05 vs. identical control (one sample t-test or independent samples t-test accordingly), NS: non-significant.
Figure 6
Figure 6
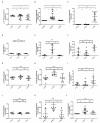
HPLC measurement of non-protein-bound, cytosolic, intracellular para- (upper panel), meta- (middle panel), and ortho-tyrosine (lower panel) content of 3T3-L1 adipocytes after time-dependent incubation with different tyrosines, without insulin, and after grown either in 5 mmol/L glucose containing medium or in 25 mmol/L glucose containing medium, or with insulin treatment (400 nmol/L), either in 5 mmol/L glucose containing medium or in 25 mmol/L glucose containing medium. Note that p-Tyr is shown as an absolute concentration, while o- and m-Tyr are depicted as their ratios to p-Tyr. There was no significant difference between the measurements (ANOVA).
Figure 7
Figure 7
p-, m-, and o-Tyr content of the total proteins of cells grown in different Tyr media. HPLC measurement of protein-bound different tyrosine isomeres in cell lysates, grown in media containing para-, ortho-, or meta-tyrosine.* p < 0.05, NS: non-significant (using Kruskal–Wallis test for multiple comparisons and subsequently Mann–Whitney U test for pairwise comparison, as data were non-normally distributed). Results are mean ± SEM for n = 5–10 individual measurements. Note that the amount of p-Tyr is shown as p-Tyr/Phe ratio and is expressed in µmol/µmol units (panel A,D,G,J), while o- and m-Tyr are depicted as their ratio to p-Tyr (i.e., o-Tyr/p-Tyr and m-Tyr/p-Tyr, respectively) and the units are nmol/µmol (m-Tyr, panel B,E,H,K; o-Tyr, panel C,F,I,L).
Figure 8
Figure 8
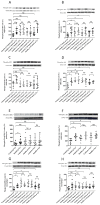
Western blot analysis of activating phosphorylation of IRS-1 (Tyr612, panel A,C,E,G) and Akt (Ser473, panel B,D,F,H) in the four cell lines (adipocytes, panel A,B; HEK cells panel C,D; podocytes, E,F; macrophages, panel G,H). Insulin-induced phosphorylation of IRS-1 (insulin receptor substrate-1) at the tyrosine of the first YXXM motif (Tyr612) in cells grown in media containing para-, meta-, or ortho-tyrosine with and without insulin treatment (400 nmol/L). Results are mean ± SEM for n= 4–8 individual measurements. * p < 0.05 (for non-normally distributed data, a Kruskal–Wallis test and, upon significance, pairwise comparisons with Mann–Whitney U test were carried out. Pairwise comparisons of normally distributed data were carried out using independent samples t-tests).
Figure 9
Figure 9
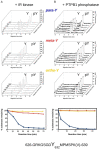
The role of IRS YXXM motifs in insulin mediated signaling. (A) Schematic of IR kinase mediated signaling: IR kinase, IRS-1 (PTB, PH domains and C-tail with YXXM motif positions and sequences indicated), PTP1B and PI3K regulatory subunits with SH2 domains. IRS-1 contains six YxxM motifs that play a central role in downstream signaling from the insulin receptor. The insulin receptor (IR)—comprised of two subunits—is dimerized upon binding to insulin (Ins). This activates the IR kinase which then creates a recruitment site in its juxtamembrane region for the PTB domain of IRS-1 by tyrosine phosphorylation. The PH domain helps recruiting IRS-1 to the cell membrane. (B) Crystallographic models of p-Tyr containing peptides binding to the deep substrate binding pocket of PTP1B, to the shallow substrate binding pocket of the IR kinase, and to the N-terminal SH2 domain of PI3K regulatory subunit (from left to right). IRS-1 partners are shown in surface representation, while substrate or ligand peptides from various proteins are shown with sticks. Structural figures were made by using the following protein–peptide PDB structures: 4zrt, PTP1B─Nephrin substrate phospho-peptide [49]; 3bu5, IR kinase IRS2─KRLB region peptide [50]; 2iuh, PI3KR-(N)SH2─c-Kit phospho-peptide [51]; 5aul, PI3KR-(C)SH2─CDC28 phospho-peptide [52].
Figure 10
Figure 10
Phosphorylation and dephosphorylation of p-, m-, and o-Tyr containing IRS-1 peptides. (A) Results of in vitro kinase assays using recombinant IR kinase. Phosphorylation of IRS1 YXXM motif containing peptides with para-, meta-, and ortho-tyrosines was analyzed by capillary electrophoresis. After starting the reactions, sample aliquots were injected to the capillary at the indicated time points. Characteristic migration times for the unphosphorylated peptide are indicated by a dashed line (~3.2 min). Notice the appearance of a slower migrating peak (at ~4.2 min) corresponding to the phosphorylated peptide in the case of the peptide with para-tyrosine. (B) Results of PTP1B dephosphorylation assays. Experiments were performed similarly to kinase reactions, but the substrate peptides were previously phosphorylated. Characteristic migration times for the phosphorylated peptide are indicated by a dashed line (~4.2 min). Notice the appearance of a faster migrating peak (at ~3.2 min) corresponding to the dephosphorylated peptide in the case of the peptide with para-tyrosine.
Figure 11
Figure 11
Binding of m- and o-Tyr IRS1 peptides to the SH2 domains of PI3K regulatory subunit. The error in the Kd values show the uncertainty of the numerical fit to the direct (top) and competitive (bottom) binding curves plotted as the mean of three technical replicates. For the GRKV6 peptide, the binding was so weak that its binding affinity could only be estimated. Please also take note that the binding affinity of the para-Tyr peptide is nanomolar (nM), while for the meta- and ortho-Tyr peptides this value is micromolar (μM), making statistical comparison unnecessary.
Figure 12
Figure 12
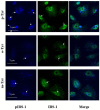
Immunofluorescence staining of insulin-treated podocytes for p-IRS-1 (blue) and total IRS-1 (green). p-IRS-1 (indicated by the white arrows) is located in the membrane when cells cultured in the presence of p-Tyr, which is not characteristic in cell treated with o- and m-Tyr. Moreover, p-IRS-1 is more intense in cells cultured in medium containing p-Tyr and the signal almost disappears in cells treated with o-Tyr. Total IRS-1 localization is mainly perinuclear.
Figure 13
Figure 13
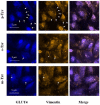
Immunofluorescence staining of insulin-treated podocytes for GLUT4 (blue) and vimentin (yellow). In p-Tyr-treated cells, GLUT4 aggregates are transported to the membrane. This localization is slightly visible in cells treated with m-Tyr, but it is not characteristic in o-Tyr treated cells, which shows rather a perinuclear localization. Typical localization of GLUT4 and vimentin is highlighted by the white arrows. Vimentin shows a colocalization with GLUT4. The arrowhead indicates the thicker vimentin filaments appearing in cells treated with m- and o-Tyr.
Figure 14
Figure 14
Suggested role of o- and m-Tyr in the development of insulin resistance.

Similar articles

Cited by

References

    1. De Fronzo R.A. From the triumvirate to the ominous octet: A new paradigm for the treatment of type 2 diabetes mellitus. Diabetes. 2009;58:773–795. doi: 10.2337/db09-9028. - DOI - PMC - PubMed
    1. Schwartz S.S., Epstein S., Corkey B.E., Grant S.F.A., Gavin J.R., Aguilar R.B. The time is right for a new classification system for diabetes: Rationale and implications of the beta-cell-centric classification schema. Diabetes Care. 2016;39:179–186. doi: 10.2337/dc15-1585. - DOI - PMC - PubMed
    1. Khan A.H., Pessin J.E. Insulin regulation of glucose uptake: A complex interplay of intracellular signalling pathways. Diabetologia. 2002;45:1475–1483. doi: 10.1007/s00125-002-0974-7. - DOI - PubMed
    1. Tangvarasittichai S. Oxidative stress, insulin resistance, dyslipidemia and type 2 diabetes mellitus. World J. Diabetes. 2015;6:456–480. doi: 10.4239/wjd.v6.i3.456. - DOI - PMC - PubMed
    1. Galiero R., Caturano A., Vetrano E., Cesaro A., Rinaldi L., Salvatore T., Marfella R., Sardu C., Moscarella E., Gragnano F., et al. Pathophysiological mechanisms and clinical evidence of relationship between Nonalcoholic fatty liver disease (NAFLD) and cardiovascular disease. Rev. Cardiovasc. Med. 2021;22:755–768. doi: 10.31083/j.rcm2203082. - DOI - PubMed

LinkOut - more resources