. 2022 May 5;10(5):1073.
doi: 10.3390/biomedicines10051073.

Toxic Exposure to Endocrine Disruptors Worsens Parkinson's Disease Progression through NRF2/HO-1 Alteration

Affiliations

Toxic Exposure to Endocrine Disruptors Worsens Parkinson's Disease Progression through NRF2/HO-1 Alteration

Ramona D'Amico et al. Biomedicines. .

Erratum in

Abstract

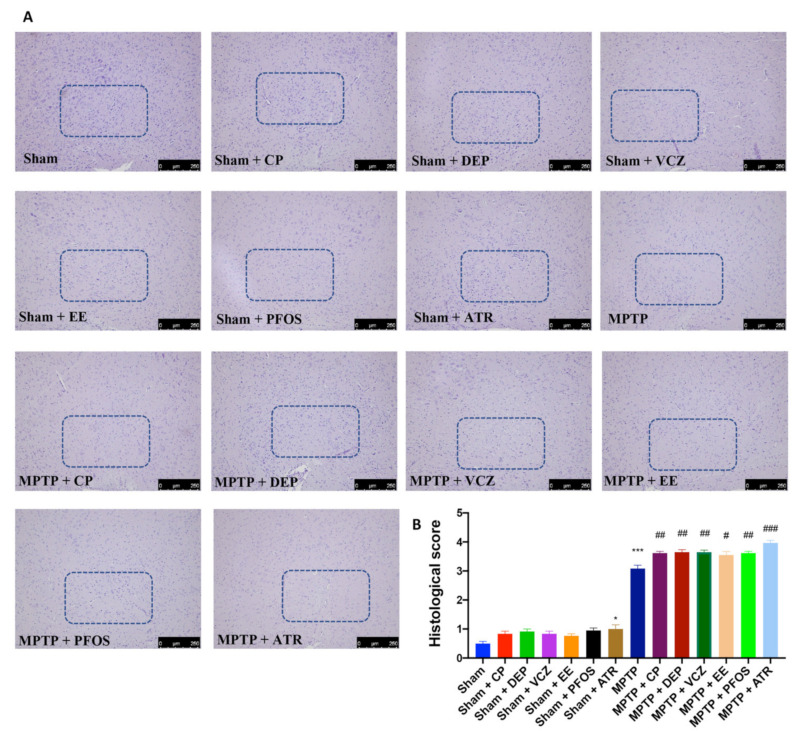
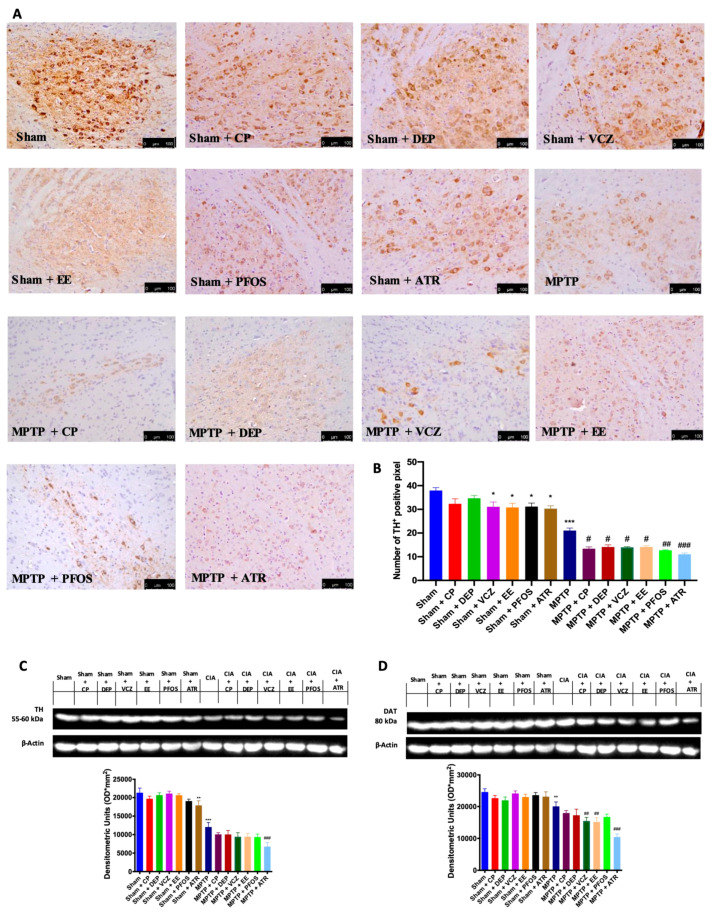
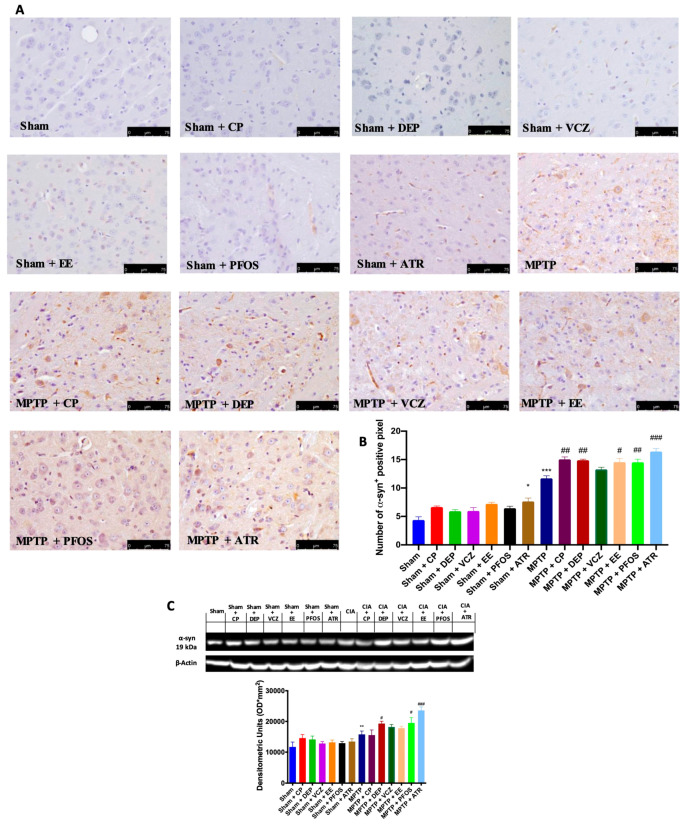
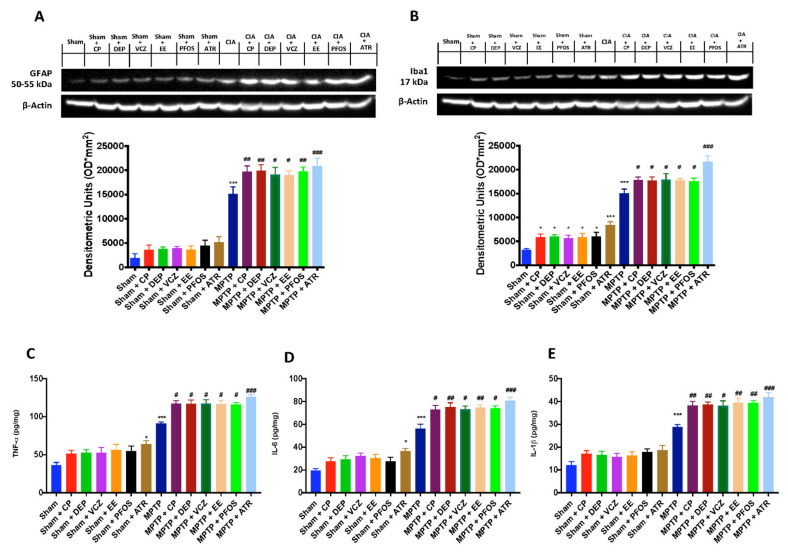
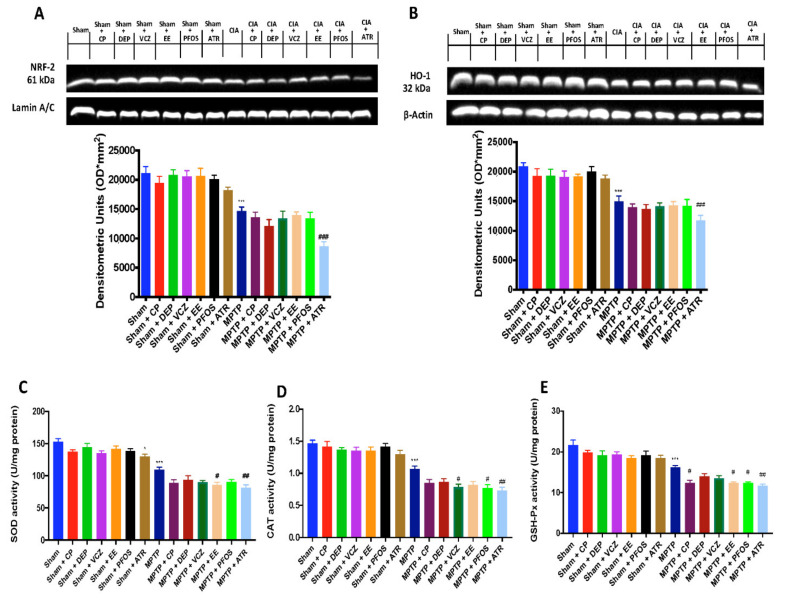
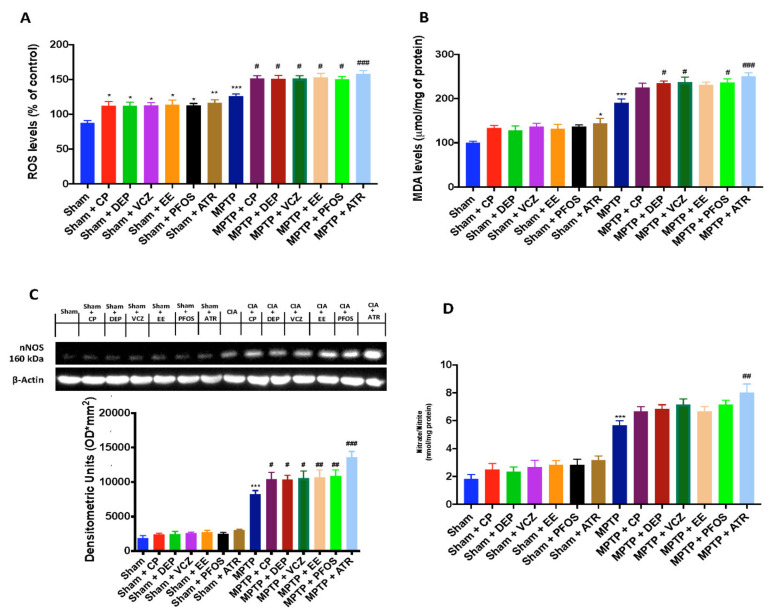
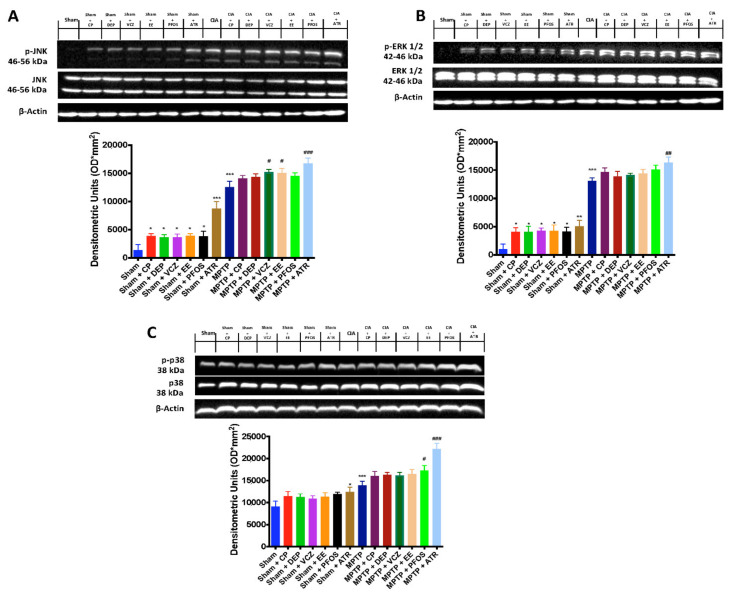
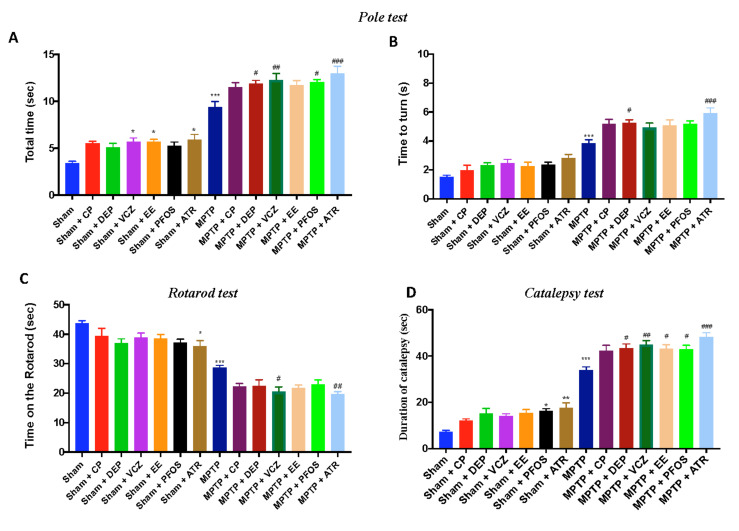
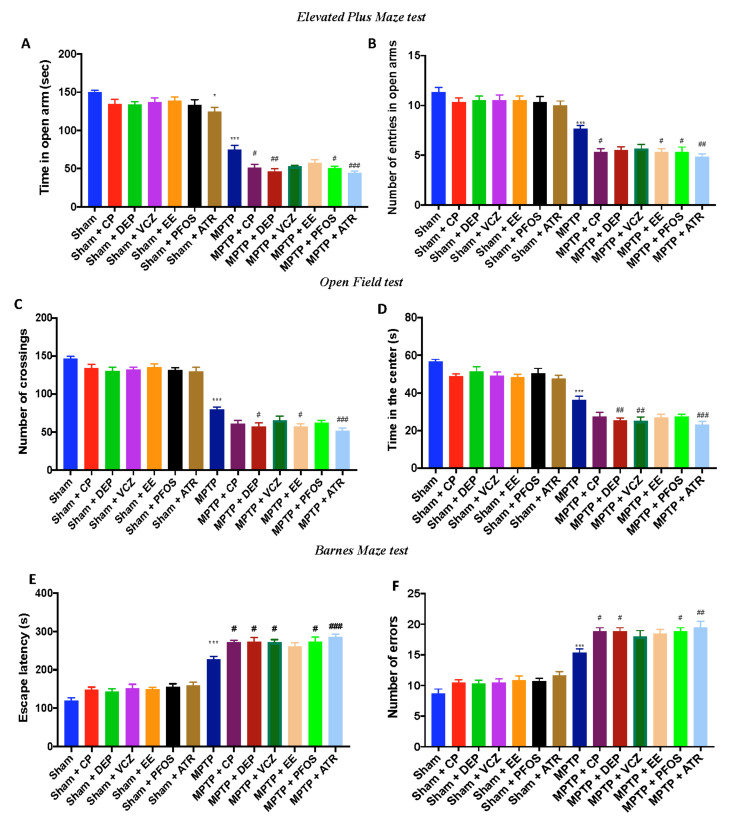
Human exposure to endocrine disruptors (EDs) has attracted considerable attention in recent years. Different studies showed that ED exposure may exacerbate the deterioration of the nervous system's dopaminergic capacity and cerebral inflammation, suggesting a promotion of neurodegeneration. In that regard, the aim of this research was to investigate the impact of ED exposure on the neuroinflammation and oxidative stress in an experimental model of Parkinson's disease (PD). PD was induced by intraperitoneally injections of MPTP for a total dose of 80 mg/kg for each mouse. Mice were orally exposed to EDs, starting 24 h after the first MPTP administration and continuing through seven additional days. Our results showed that ED exposure raised the loss of TH and DAT induced by the administration of MPTP, as well as increased aggregation of α-synuclein, a key marker of PD. Additionally, oral exposure to EDs induced astrocytes and microglia activation that, in turn, exacerbates oxidative stress, perturbs the Nrf2 signaling pathway and activates the cascade of MAPKs. Finally, we performed behavioral tests to demonstrate that the alterations in the dopaminergic system also reflected behavioral and cognitive alterations. Importantly, these changes are more significant after exposure to atrazine compared to other EDs. The results from our study provide evidence that exposure to EDs may play a role in the development of PD; therefore, exposure to EDs should be limited.

Keywords: Parkinson’s disease; atrazine; endocrine disruptors; inflammation; oxidative stress.


Conflict of interest statement

The authors declare no conflict of interest.

Figures

Figure 1
Figure 1
Histological evaluation of the midbrain from all groups (A). Histological score (B). A 10× magnification is shown (250-µm scale bar). The blue box highlights the area affected by the damage. Data are expressed as the mean ± SEM of N = 6 mice/group. * p < 0.05 vs. sham; *** p < 0.001 vs. sham; # p < 0.05 vs. MPTP; ## p < 0.01 vs. MPTP; ### p < 0.001 vs. MPTP.
Figure 2
Figure 2
Immunohistochemical evaluation in the midbrain for TH expression (A). Graphical quantification of TH expression (B). Western blots and densitometric analysis of TH (C) and DAT (D). A 20× magnification is shown (100-µm scale bar). A demonstrative blot of lysates with a densitometric analysis for all animals is shown. Data are expressed as the mean ± SEM of N = 6 mice/group. * p < 0.05 vs. sham; ** p < 0.01 vs. sham; *** p < 0.001 vs. sham; # p < 0.05 vs. MPTP; ## p < 0.01 vs. MPTP; ### p < 0.001 vs. MPTP.
Figure 3
Figure 3
Immunohistochemical evaluation for α-syn expression (A). Graphical quantification of α-syn expression (B). Western blot and densitometric analysis of α-syn (C). A 40× magnification is shown (75-µm scale bar). A demonstrative blot of lysates with a densitometric analysis for all animals is shown. Data are expressed as the mean ± SEM of N = 6 mice/group. * p < 0.05 vs. sham; ** p < 0.01 vs. sham; *** p < 0.001 vs. sham; # p < 0.05 vs. MPTP; ## p < 0.01 vs. MPTP; ### p < 0.001 vs. MPTP.
Figure 4
Figure 4
Western blots and densitometric analysis of GFAP (A) and Iba1 (B). Levels of TNF-α (C) IL-6 (D) and IL-1β (E). A demonstrative blot of lysates with a densitometric analysis for all animals is shown. Data are expressed as mean ± SEM of N = 6 mice/group. * p < 0.05 vs. sham; *** p < 0.001 vs. sham; # p < 0.05 vs. MPTP; ## p < 0.01 vs. MPTP; ### p < 0.001 vs. MPTP.
Figure 5
Figure 5
Western blots and densitometric analysis of NRF-2 (A) and HO-1 (B). Levels of SOD (C), CAT (D) and GSH-Px (E). A demonstrative blot of lysates with a densitometric analysis for all animals is shown. Data are expressed as the mean ± SEM of N = 6 mice/group. * p <0.05 vs. sham; *** p < 0.001 vs. sham; # p< 0.05 vs. MPTP; ## p < 0.01 vs. MPTP; ### p < 0.001 vs. MPTP.
Figure 6
Figure 6
Levels of ROS (A) and MDA (B). Western blots and densitometric analysis of nNOS (C). Nitrate/nitrite levels (D). A demonstrative blot of lysates with a densitometric analysis for all animals is shown. Data are expressed as the mean ± SEM of N = 6 mice/group. * p <0.05 vs. sham; ** p < 0.01 vs. sham; *** p < 0.001 vs. sham; # p < 0.05 vs. MPTP; ## p < 0.01 vs. MPTP; ### p < 0.001 vs. MPTP.
Figure 7
Figure 7
Western blots and densitometric analysis of p-JNK (A), p-ERK 1/2 (B) and p-p38 (C). A demonstrative blot of lysates with a densitometric analysis for all animals is shown. Data are expressed as the mean ± SEM of N = 6 mice/group. * p < 0.05 vs. sham; ** p < 0.01 vs. sham; *** p < 0.001 vs. sham; # p < 0.05 vs. MPTP; ## p < 0.01 vs. MPTP; ### p < 0.001 vs. MPTP.
Figure 8
Figure 8
Behavioral analysis motor impairments: Pole test (A,B). Rotarod test (C). Catalepsy test (D). Data are expressed as the mean ± SEM of N = 6 mice/group. * p <0.05 vs. sham; ** p < 0.01 vs. sham; *** p < 0.001 vs. sham; # p< 0.05 vs. MPTP; ## p < 0.01 vs. MPTP; ### p < 0.001 vs. MPTP.
Figure 9
Figure 9
Behavioral analysis for cognitive alteration: Elevated Plus Maze test (A,B); Open Field test (C,D); Bernes Maze test (E,F). Data are expressed as the mean ± SEM of N = 6 mice/group. * p < 0.05 vs. sham; *** p < 0.001 vs. sham; # p< 0.05 vs. MPTP; ## p < 0.01 vs. MPTP; ### p < 0.001 vs. MPTP.

References

    1. Yilmaz B., Terekeci H., Sandal S., Kelestimur F. Endocrine disrupting chemicals: Exposure, effects on human health, mechanism of action, models for testing and strategies for prevention. Rev. Endocr. Metab. Disord. 2020;21:127–147. doi: 10.1007/s11154-019-09521-z. - DOI - PubMed
    1. Koch C.A., Diamanti-Kandarakis E. Introduction to Endocrine Disrupting Chemicals--is it time to act? Rev. Endocr. Metab. Disord. 2015;16:269–270. doi: 10.1007/s11154-016-9338-3. - DOI - PubMed
    1. D’Amico R., Monaco F., Fusco R., Siracusa R., Impellizzeri D., Peritore A.F., Crupi R., Gugliandolo E., Cuzzocrea S., Di Paola R., et al. Atrazine Inhalation Worsen Pulmonary Fibrosis Regulating the Nuclear Factor-Erythroid 2-Related Factor (Nrf2) Pathways Inducing Brain Comorbidities. Cell. Physiol. Biochem. 2021;55:704–725. doi: 10.33594/000000471. - DOI - PubMed
    1. Genovese T., Siracusa R., Fusco R., D’Amico R., Impellizzeri D., Peritore A.F., Crupi R., Gugliandolo E., Morabito R., Cuzzocrea S., et al. Atrazine Inhalation Causes Neuroinflammation, Apoptosis and Accelerating Brain Aging. Int. J. Mol. Sci. 2021;22:7938. doi: 10.3390/ijms22157938. - DOI - PMC - PubMed
    1. Rebolledo-Solleiro D., Castillo Flores L.Y., Solleiro-Villavicencio H. Impact of BPA on behavior, neurodevelopment and neurodegeneration. Front. Biosci. 2021;26:363–400. doi: 10.2741/4898. - DOI - PubMed

LinkOut - more resources