. 2022 May 5;10(5):1075.
doi: 10.3390/biomedicines10051075.

Human iPSC Modeling of Genetic Febrile Seizure Reveals Aberrant Molecular and Physiological Features Underlying an Impaired Neuronal Activity

Affiliations

Human iPSC Modeling of Genetic Febrile Seizure Reveals Aberrant Molecular and Physiological Features Underlying an Impaired Neuronal Activity

Stefania Scalise et al. Biomedicines. .

Abstract

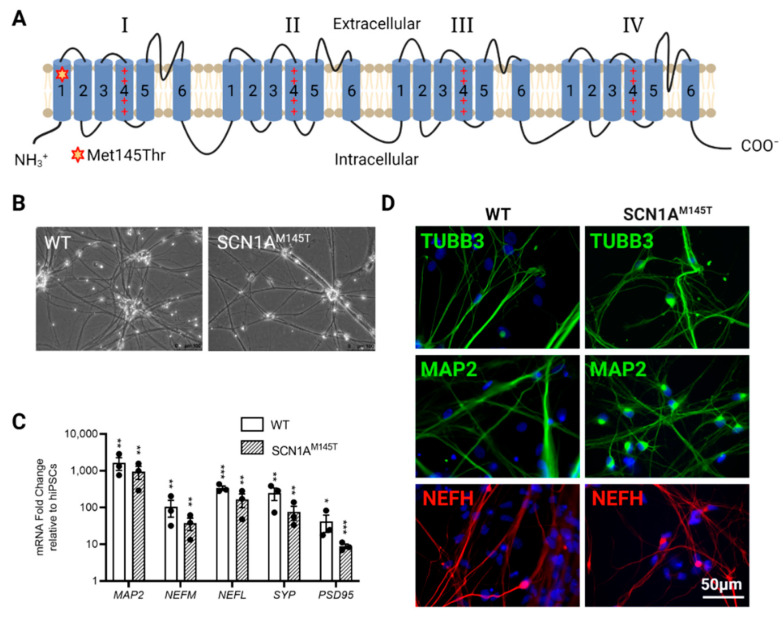
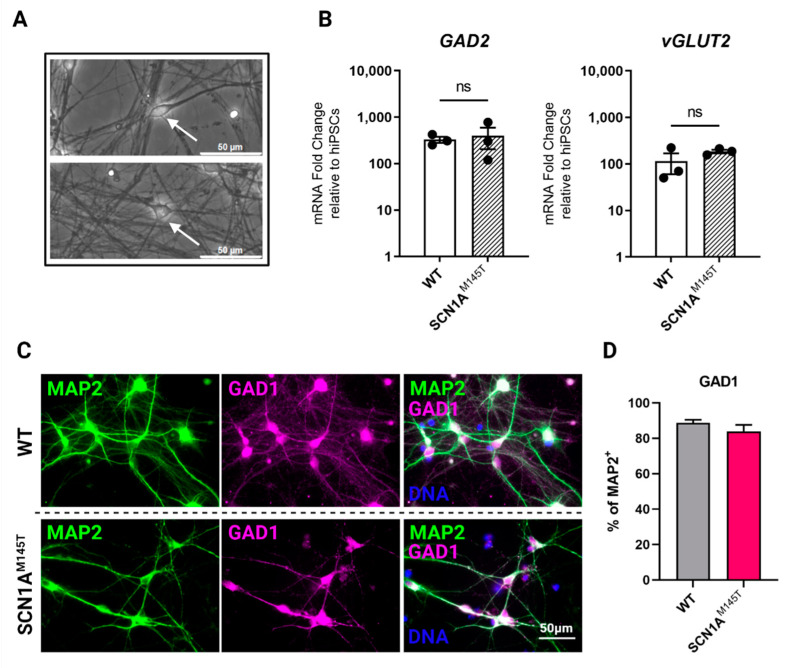
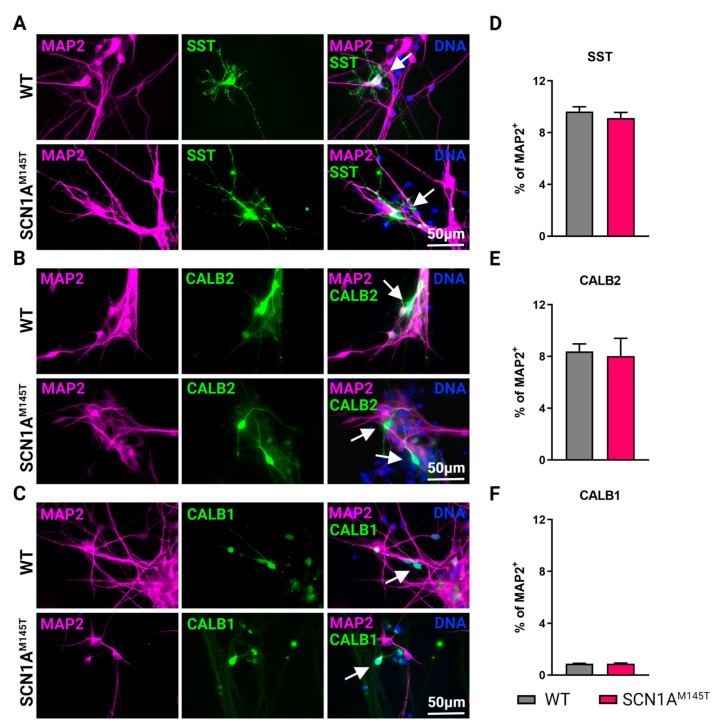
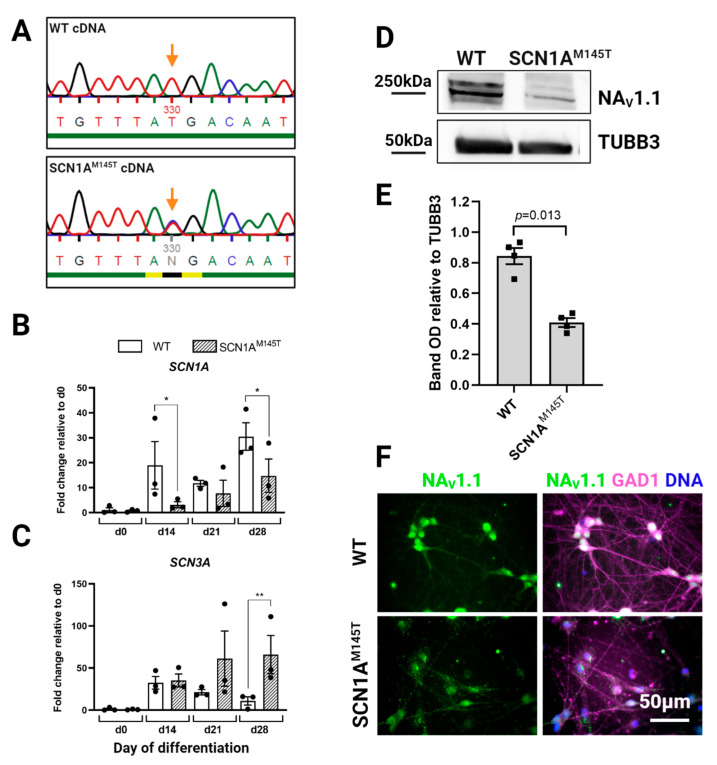
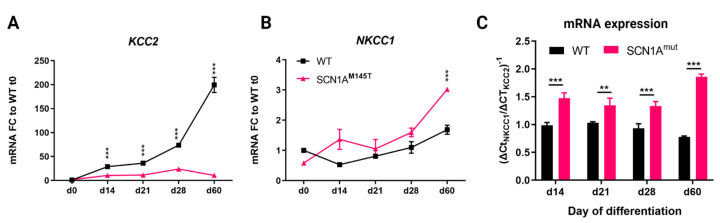
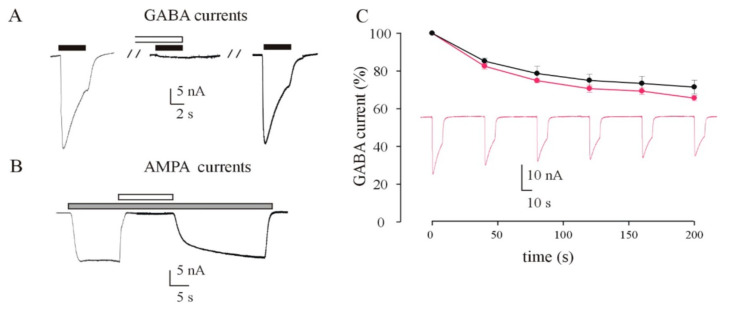
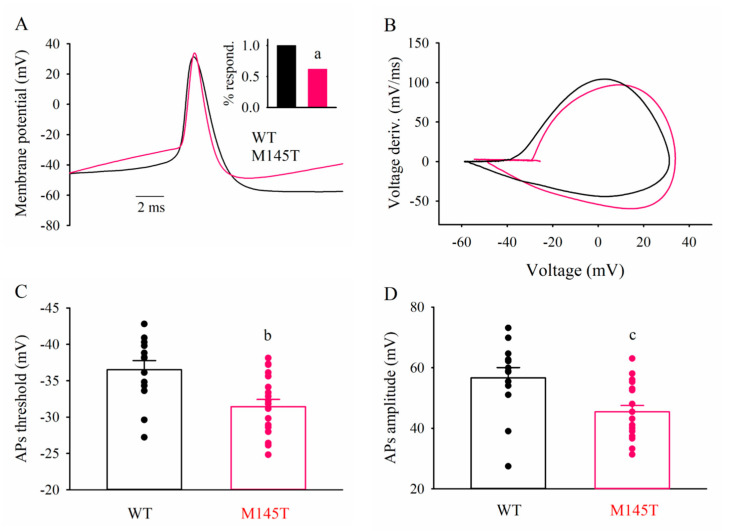
Mutations in SCN1A gene, encoding the voltage-gated sodium channel (VGSC) NaV1.1, are widely recognized as a leading cause of genetic febrile seizures (FS), due to the decrease in the Na+ current density, mainly affecting the inhibitory neuronal transmission. Here, we generated induced pluripotent stem cells (iPSCs)-derived neurons (idNs) from a patient belonging to a genetically well-characterized Italian family, carrying the c.434T > C mutation in SCN1A gene (hereafter SCN1AM145T). A side-by-side comparison of diseased and healthy idNs revealed an overall maturation delay of SCN1AM145T cells. Membranes isolated from both diseased and control idNs were injected into Xenopus oocytes and both GABA and AMPA currents were successfully recorded. Patch-clamp measurements on idNs revealed depolarized action potential for SCN1AM145T, suggesting a reduced excitability. Expression analyses of VGSCs and chloride co-transporters NKCC1 and KCC2 showed a cellular “dysmaturity” of mutated idNs, strengthened by the high expression of SCN3A, a more fetal-like VGSC isoform, and a high NKCC1/KCC2 ratio, in mutated cells. Overall, we provide strong evidence for an intrinsic cellular immaturity, underscoring the role of mutant NaV1.1 in the development of FS. Furthermore, our data are strengthening previous findings obtained using transfected cells and recordings on human slices, demonstrating that diseased idNs represent a powerful tool for personalized therapy and ex vivo drug screening for human epileptic disorders.

Keywords: disease model; febrile seizure; induced pluripotent stem cells; mesial temporal lobe epilepsy; voltage gated sodium channel NaV1.1.


Conflict of interest statement

The authors declare no conflict of interest.

Figures

Figure 1
Figure 1
Characterization of idNs. (A) Representation of NaV1.1 channel. The star in segment 1 of domain I shows the localization of the mutated aminoacid (Met145Thr). The relative missense mutation c.434T > C is found in the exon 3 of the translated sequence. (B) Bright-field images of idNs from WT and SCN1AM145T-iPSCs (20× magnification). (C) Differentiated idNs show high expression levels of neuronal specific genes such as MAP2, NEFM, NEFL, SYP and PSD95 compared to their undifferentiated counterparts (iPSCs). GAPDH was used as a housekeeping control. Data are presented as mean ± SEM of three biological replicates (black dots), * p < 0.05, ** p < 0.01, *** p < 0.001, t-test has been calculated vs. expression in iPSCs. (D) Immunostaining of neuronal markers TUBB3 (neurites marker), MAP2 (cell body and dendrites marker), and NEFH (axonal marker) in WT and SCN1AM145T idNs. DAPI nuclear counterstain is shown in all images in blue (63× magnification).
Figure 2
Figure 2
Expression of GABAergic and glutamatergic markers in idNs. (A) Generated idNs are composed of a mixed neuronal population containing neurons with both bipolar (upper panel, white arrow) and pyramidal (lower panel, white arrow) morphology. (B) Expression analysis of mRNAs relative to GABAergic (inhibitory) marker glutamate decarboxylase 2 (GAD2) and glutamatergic (excitatory) marker vesicular glutamate transporter 2 (vGLUT2) in idNs relative to undifferentiated iPSCs. GAPDH was used as a housekeeping gene. qRT-PCR analysis did not reveal significant differences in the expression of GAD2 and vGLUT2 between diseased and control idNs relatively to their undifferentiated iPSCs (p-value = non-significant (ns), t-test), even though a higher prevalence of GABAergic marker GAD2 was detected, as shown by its higher fold change relative to iPSCs. Data are presented as mean ± SEM of three biological replicates (dots). (C) Representative immunofluorescence images of GABA synthesis enzyme GAD1 compared to neuronal marker MAP2 in idNs of WT (upper line images) and SCN1AM145T (lower line images) cells (63× magnification). (D) The diagram shows that about 90% of MAP2+ cells co-express the GAD1 marker. For each cell line, at least 300 neurons were counted, and data are presented as mean ± SEM of two independent experiments.
Figure 3
Figure 3
Types of interneurons generated from iPSCs. Immunofluorescence analysis of idNs stained with antibodies against interneuronal subtypes markers (A) somatostatin (SST), (B) calretinin (CALB2), and (C) calbindin (CALB1). In each group of images, WT cells are shown in the upper panel, while SCN1AM145T idNs are shown in the lower panel. White arrows in the merged images indicate neurons expressing the interneuronal makers indicated (63× magnification). (DF) Quantification of percentage of MAP2+ neurons co-expressing interneuronal markers immunostained in panels (AC). About 9–1% of idNs express SST and CALB2, while CALB1 is present in less than 1% percent of neurons. At least 200 cells were counted for each bar, and data are presented as mean ± SEM of two independent experiments.
Figure 4
Figure 4
Expression of SCN1A gene and NaV1.1 protein in idNs. (A) Sequencing of cDNA obtained by reverse transcription of SCN1A mRNA from WT- and SCN1AM145T-idNs. In the SCN1AM145T cells, the double peak in the mutation site (indicated by the orange arrow) demonstrates that both alleles (one with the original nucleotide T and the other with the mutated one C) were transcribed. (B) qRT-PCR analysis of SCN1A gene in idNs at day of differentiation 0 (NSCs), d14, d21 and d28. SCN1AM145T cells showed a lower expression of SCN1A during differentiation compared to WT, although in both cell lines the expression increases following idNs maturation. (C) The expression of the embryonic isoform of sodium channel SCN3A increases with the progress of cell maturation in SCN1AM145T idNs, while it decreases in WT idNs as the cells become more differentiated. For both graphs, GAPDH was used as a housekeeping gene; data are mean ± SEM of three biological replicates (black dots), * p < 0.05, ** p < 0.01, t-test has been calculated vs. WT at the same day of differentiation. (D) Western blot analysis of NaV1.1 protein in lysates obtained from WT- and SCN1AM145T idNs at day 35 of differentiation. Tubulin Beta 3 Class III (TUBB3) was used as loading control. (E) Quantification of NaV1.1 Western blot bands in four biological replicates (n = 4, OD = relative optical density calculated as (NaV1.1 optical density)/(TUBB3 optical density), p-value calculated using t-test). (F) Immunofluorescence of idNs showing that GABAergic neurons (GAD1 positive) express NaV1.1, mainly in the cell body. Immunofluorescence data show a lower expression of the channel in the neurons differentiated from SCN1AM145T patient in respect to those of WT (63× magnification).
Figure 5
Figure 5
Expression of chloride co-transporters in idNs. (A,B) qRT-PCR analysis of chloride co-transporters KCC2 and NKCC1 in neurons from WT and SCN1AM145T tested at day of differentiation 0 (NSCs), d14, d21, d28 and d60. (C) NKCC1/KCC2 mRNA ratio in idNs at different days of differentiation. The ratio was calculated as the inverse of ΔCtNKCC1/ΔCtKCC2: (ΔCt = CtGene_Of_Interest − CtGAPDH). For all graphs, the mean ± SEM of three biological replicates is shown; ** p < 0.01, *** p < 0.001, t-test has been calculated vs. WT at the same day of differentiation.
Figure 6
Figure 6
Xenopus oocytes injected with membranes from idNs incorporated functional neurotransmitter receptors. (A) Sample currents evoked by 500 μM GABA or (B) 20 μM AMPA on oocytes microinjected with membranes extracted from cultured idNs obtained from a patient carrying the M145T mutation of the SCN1A gene. (A) GABA currents were completely inhibited by a brief pre-incubation (30 s) with bicuculline (100 μM) and subsequently recovered following the washout of the inhibitor. (B) AMPA currents were completely inhibited by co-administration of NBQX (50 μM), and they recovered to the original amplitude once NBQX administration was interrupted. AMPA currents were recorded in presence of CTZ (20 μM). Black bars = GABA; gray bars = AMPA; white bars in (A) bicuculline; in (B) NBQX. (C) Time course of the GABA current rundown evoked by six consecutive GABA applications (500 μM, 10 s) interspaced by a 40 s washout, in oocytes injected with membranes from control (black dots; ●) and M145T idNs (magenta; ●; p > 0.05). The dots represent GABA currents expressed as a percentage of the first evoked response (● = 16.6 ± 1.0 nA, n = 8; ● = 23.7 ± 1.1 nA, n = 10).
Figure 7
Figure 7
SCN1AM145T idNs exhibit depolarized action potential (AP) threshold. (A) superimposed typical AP traces recorded from one WT and one M145T neuron (black and magenta traces, respectively). Inset: bar graphs representing the frequency of AP-firing cells (a, p = 0.004, Fisher Exact test). (B) superimposed phase-plane plot obtained from the two APs shown in (A). (C) bar graphs representing the mean AP threshold values averaged from 13 WT- and 19 SCN1AM145T idNs, as indicated. Circles indicate the AP threshold of individual cells (b, p = 0.003). (D) bar graphs representing the mean AP amplitude values. Same cells as in (C) (c, p = 0.006).

Similar articles

Cited by

References

    1. Camfield P., Camfield C. Incidence, Prevalence and Aetiology of Seizures and Epilepsy in Children. Epileptic Disorders. 2015;17:117–123. doi: 10.1684/epd.2015.0736. - DOI - PubMed
    1. Saghazadeh A., Mastrangelo M., Rezaei N. Genetic Background of Febrile Seizures. Rev. Neurosci. 2014;25:129–161. doi: 10.1515/revneuro-2013-0053. - DOI - PubMed
    1. de Tisi J., Bell G.S., Peacock J.L., McEvoy A.W., Harkness W.F., Sander J.W., Duncan J.S. The Long-Term Outcome of Adult Epilepsy Surgery, Patterns of Seizure Remission, and Relapse: A Cohort Study. Lancet. 2011;378:1388–1395. doi: 10.1016/S0140-6736(11)60890-8. - DOI - PubMed
    1. Marini C., Scheffer I.E., Nabbout R., Suls A., De Jonghe P., Zara F., Guerrini R. The Genetics of Dravet Syndrome: Genetics of Dravet Syndrome. Epilepsia. 2011;52:24–29. doi: 10.1111/j.1528-1167.2011.02997.x. - DOI - PubMed
    1. Escayg A., Heils A., MacDonald B.T., Haug K., Sander T., Meisler M.H. A Novel SCN1A Mutation Associated with Generalized Epilepsy with Febrile Seizures Plus—And Prevalence of Variants in Patients with Epilepsy. Am. J. Hum. Genet. 2001;68:866–873. doi: 10.1086/319524. - DOI - PMC - PubMed

LinkOut - more resources