

Prediction of Non-Response to Neoadjuvant Chemoradiotherapy in Esophageal Cancer Patients with 18F-FDG PET Radiomics Based Machine Learning Classification
- PMID: 35626225
- PMCID: PMC9139915
- DOI: 10.3390/diagnostics12051070
Prediction of Non-Response to Neoadjuvant Chemoradiotherapy in Esophageal Cancer Patients with 18F-FDG PET Radiomics Based Machine Learning Classification
Abstract
Background: Approximately 26% of esophageal cancer (EC) patients do not respond to neoadjuvant chemoradiotherapy (nCRT), emphasizing the need for pre-treatment selection. The aim of this study was to predict non-response using a radiomic model on baseline 18F-FDG PET.
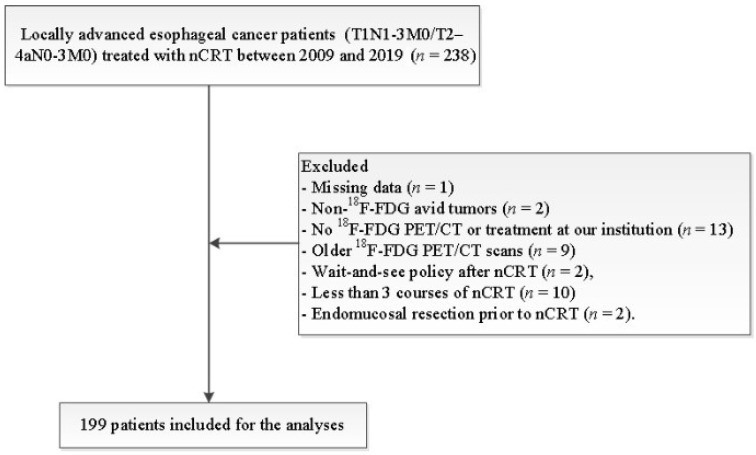
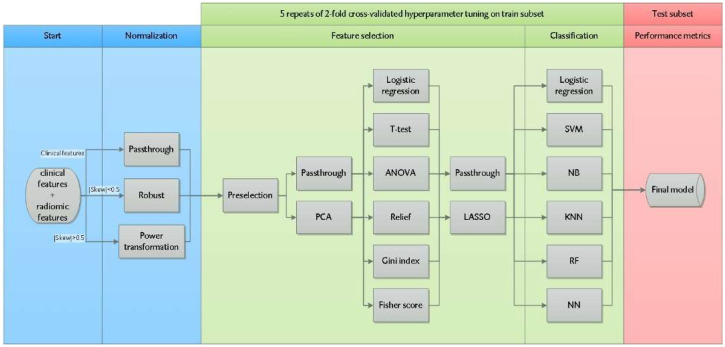
Methods: Retrospectively, 143 18F-FDG PET radiomic features were extracted from 199 EC patients (T1N1-3M0/T2-4aN0-3M0) treated between 2009 and 2019. Non-response (n = 57; 29%) was defined as Mandard Tumor Regression Grade 4-5 (n = 44; 22%) or interval progression (n = 13; 7%). Randomly, 139 patients (70%) were allocated to explore all combinations of 24 feature selection strategies and 6 classification methods towards the cross-validated average precision (AP). The predictive value of the best-performing model, i.e AP and area under the ROC curve analysis (AUC), was evaluated on an independent test subset of 60 patients (30%).
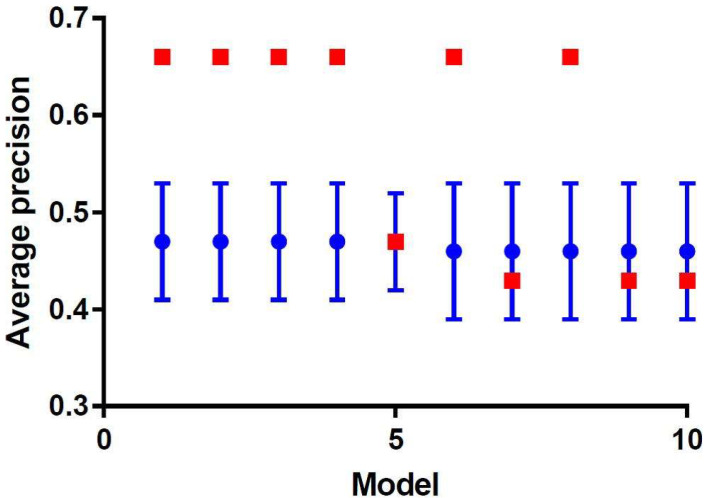
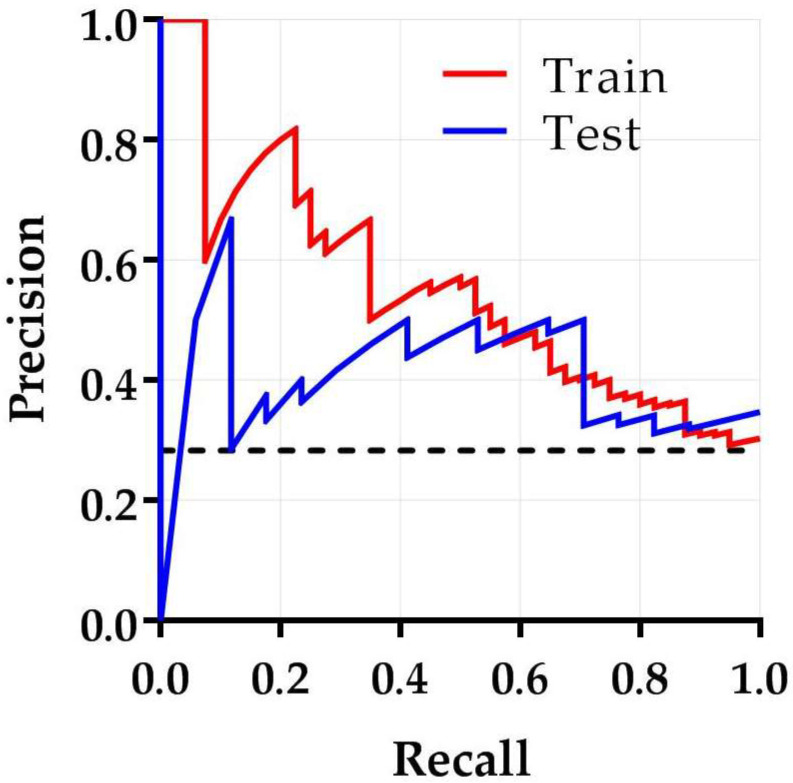
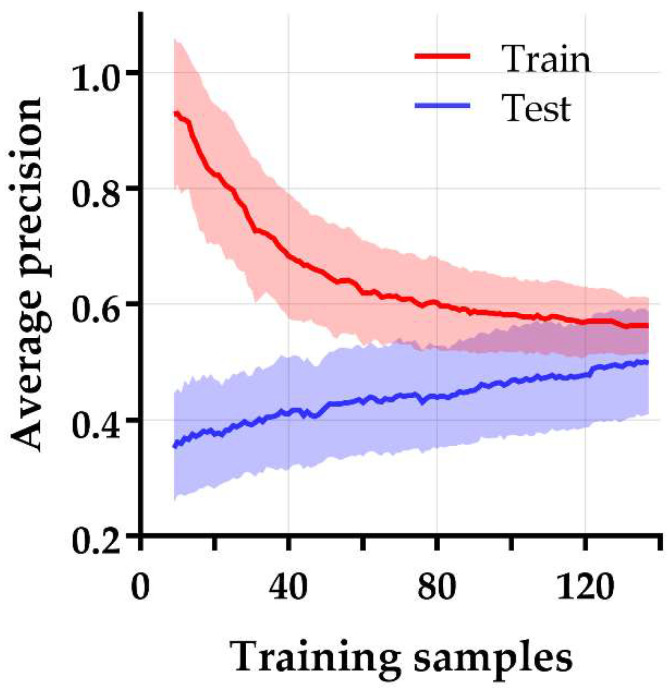
Results: The best performing model had an AP (mean ± SD) of 0.47 ± 0.06 on the training subset, achieved by a support vector machine classifier trained on five principal components of relevant clinical and radiomic features. The model was externally validated with an AP of 0.66 and an AUC of 0.67.
Conclusion: In the present study, the best-performing model on pre-treatment 18F-FDG PET radiomics and clinical features had a small clinical benefit to identify non-responders to nCRT in EC.
Keywords: esophageal neoplasms; neoadjuvant therapy; positron-emission tomography.
Conflict of interest statement
The authors declare no conflict of interest.
Figures
References
-
- van Hagen P., Hulshof M.C., van Lanschot J.J.B., Steyerberg E.W., Henegouwen M.V.B., Wijnhoven B.P.L., Richel D.J., Nieuwenhuijzen G.A.P., Hospers G.A.P., Bonenkamp J.J., et al. Preoperative chemoradiotherapy for esophageal or junctional cancer. N. Engl. J. Med. 2012;366:2074–2084. - PubMed
-
- Kroese T.E., Goense L., van Hillegersberg R., De Keizer B., Mook S., Ruurda J.P., Van Rossum P.S.N. Detection of distant interval metastases after neoadjuvant therapy for esophageal cancer with 18F-FDG PET(/CT): A systematic review and meta-analysis. Dis. Esophagus. 2018;31:doy055. doi: 10.1093/dote/doy055. - DOI - PubMed
-
- Chevrollier G.S., Giugliano D.N., Palazzo F., Keith S.W., Rosato E.L., Iii N.R.E., Berger A.C. Patients with Non-response to Neoadjuvant Chemoradiation for Esophageal Cancer Have No Survival Advantage over Patients Undergoing Primary Esophagectomy. J. Gastrointest. Surg. 2020;24:288–298. doi: 10.1007/s11605-019-04161-9. - DOI - PubMed
LinkOut - more resources
Full Text Sources
