

Image Quantification for TSPO PET with a Novel Image-Derived Input Function Method
- PMID: 35626315
- PMCID: PMC9140104
- DOI: 10.3390/diagnostics12051161
Image Quantification for TSPO PET with a Novel Image-Derived Input Function Method
Abstract
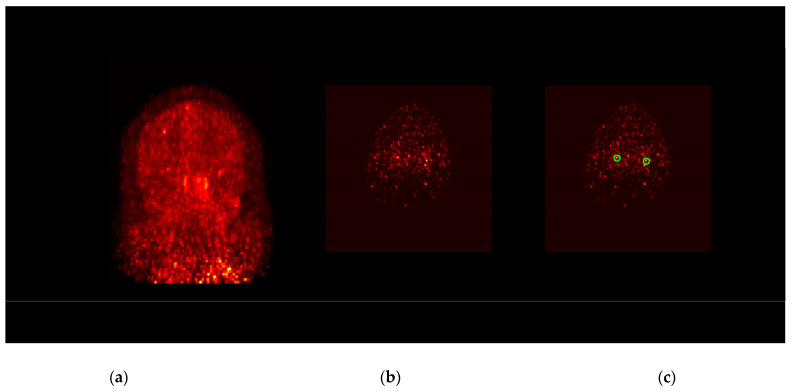
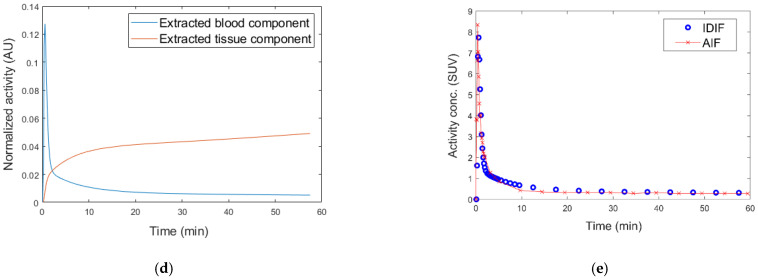
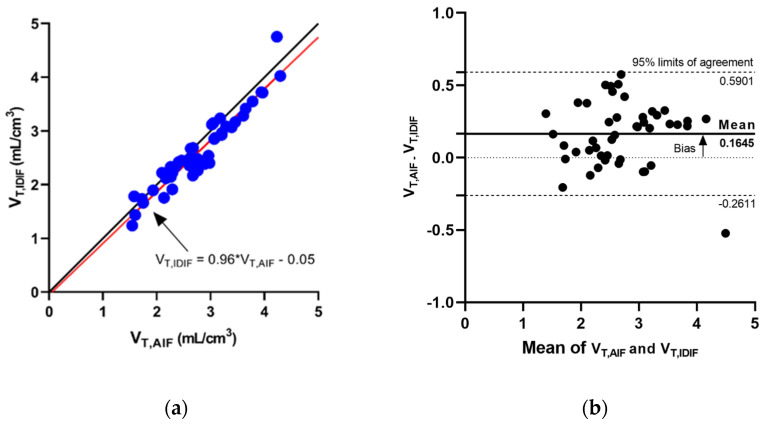
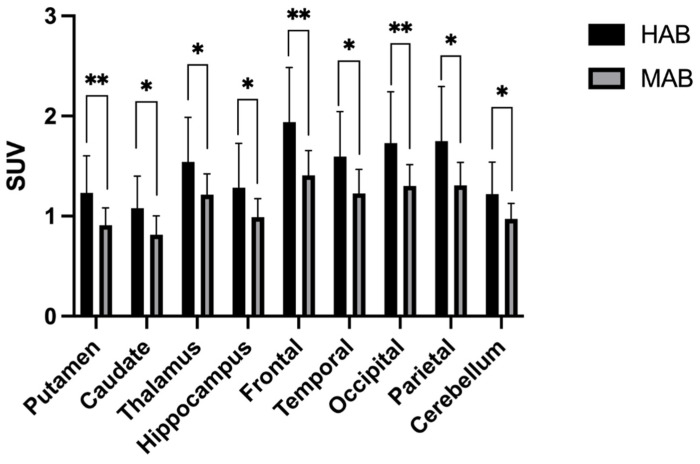
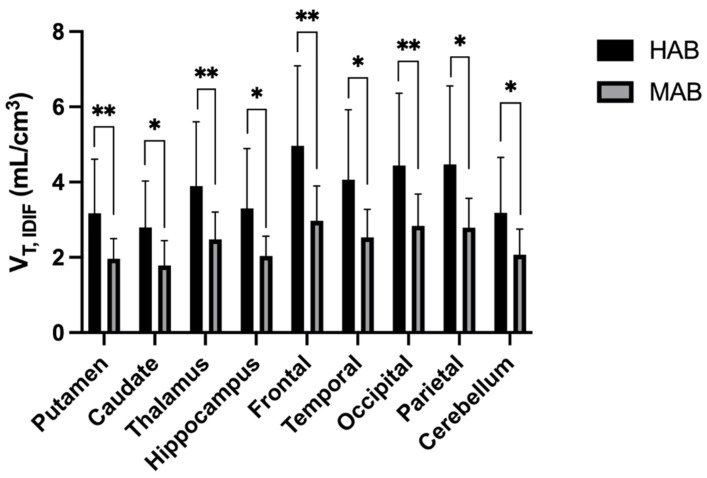
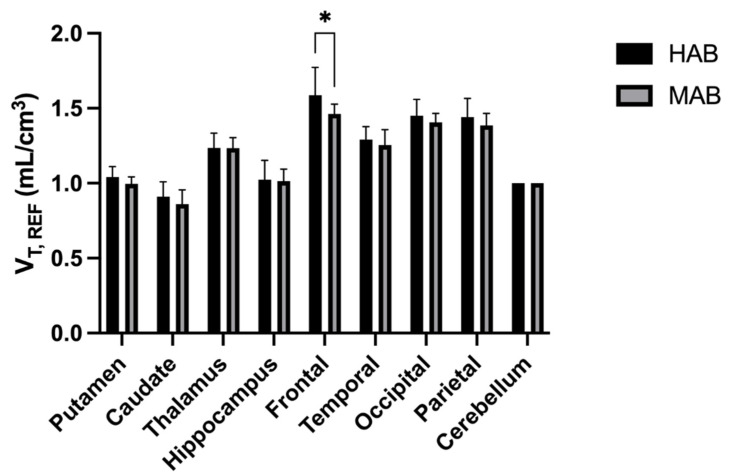
There is a growing interest in using 18F-DPA-714 PET to study neuroinflammation and microglial activation through imaging the 18-kDa translocator protein (TSPO). Although quantification of 18F-DPA-714 binding can be achieved through kinetic modeling analysis with an arterial input function (AIF) measured with blood sampling procedures, the invasiveness of such procedures has been an obstacle for wide application. To address these challenges, we developed an image-derived input function (IDIF) that noninvasively estimates the arterial input function from the images acquired for 18F-DPA-714 quantification. Methods: The method entails three fully automatic steps to extract the IDIF, including a segmentation of voxels with highest likelihood of being the arterial blood over the carotid artery, a model-based matrix factorization to extract the arterial blood signal, and a scaling optimization procedure to scale the extracted arterial blood signal into the activity concentration unit. Two cohorts of human subjects were used to evaluate the extracted IDIF. In the first cohort of five subjects, arterial blood sampling was performed, and the calculated IDIF was validated against the measured AIF through the comparison of distribution volumes from AIF (VT,AIF) and IDIF (VT,IDIF). In the second cohort, PET studies from twenty-eight healthy controls without arterial blood sampling were used to compare VT,IDIF with VT,REF measured using a reference region-based analysis to evaluate whether it can distinguish high-affinity (HAB) and mixed-affinity (MAB) binders. Results: In the arterial blood-sampling cohort, VT derived from IDIF was found to be an accurate surrogate of the VT from AIF. The bias of VT, IDIF was −5.8 ± 7.8% when compared to VT,AIF, and the linear mixed effect model showed a high correlation between VT,AIF and VT, IDIF (p < 0.001). In the nonblood-sampling cohort, VT, IDIF showed a significance difference between the HAB and MAB healthy controls. VT, IDIF and standard uptake values (SUV) showed superior results in distinguishing HAB from MAB subjects than VT,REF. Conclusions: A novel IDIF method for 18F-DPA-714 PET quantification was developed and evaluated in this study. This IDIF provides a noninvasive alternative measurement of VT to quantify the TSPO binding of 18F-DPA-714 in the human brain through dynamic PET scans.
Keywords: TSPO PET; image-derived input function; kinetic modeling analysis; neuroinflammation.
Conflict of interest statement
This study was supported by the Alabama Morris K. Udall Center of Excellence in Parkinson’s Research (NS108675) and the Parkinson Association of Central Alabama. Jonathan McConathy is an investigator in studies funded by NIH, Eli Lilly/Avid, Blue Earth Diagnostics, Cytosite Biopharma, and ImaginAb. He is a consultant for Eli Lilly/Avid, GE Healthcare, Blue Earth Diagnostics, ImaginAb, and Canon Medical. Talene Yacoubian has active grants from the American Parkinson Disease Association, Travere Therapeutics, and the NIH. She has received honoraria for presentations from the Movement Disorder Society and for grant reviews from the NIH and the Michael J. Fox Foundation. David Standaert is an investigator in studies funded by AbbVie Inc., the American Parkinson Disease Association, the Michael J. Fox Foundation for Parkinson Research, Alabama Department of Commerce, the Department of Defense, and the NIH. He has served as a consultant for or received honoraria from AbbVie Inc., the Parkinson Study Group, Curium Pharma, the International Parkinson Disease and Movement Disorder Society, Theravance, McGraw Hill, Gray Matter Technologies, and Sanofi-Aventis. No potential conflict of interest relevant to this article exist.
Figures
References
Grants and funding
LinkOut - more resources
Full Text Sources
