. 2022 May 23;12(5):1291.
doi: 10.3390/diagnostics12051291.

Comprehensive Development and Implementation of Good Laboratory Practice for NGS Based Targeted Panel on Solid Tumor FFPE Tissues in Diagnostics

Affiliations

Comprehensive Development and Implementation of Good Laboratory Practice for NGS Based Targeted Panel on Solid Tumor FFPE Tissues in Diagnostics

Anuradha Chougule et al. Diagnostics (Basel). .

Abstract

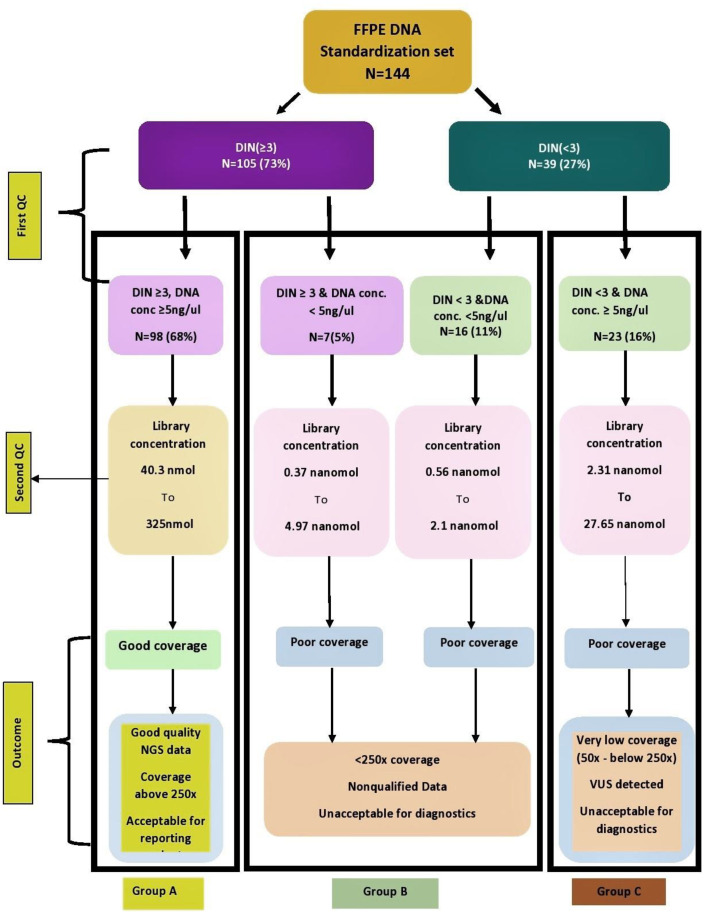
The speed, accuracy, and increasing affordability of next-generation sequencing (NGS) have revolutionized the advent of precision medicine. To date, standardized validation criteria for diagnostic accreditation do not exist due to variability across the multitude of NGS platforms and within NGS processes. In molecular diagnostics, it is necessary to ensure that the primary material of the FFPE sample has good quality and optimum quantity for the analysis, otherwise the laborious and expensive NGS test may result in unreliable information. Therefore, stringent quality control of DNA and RNA before, during, and after library preparation is an essential parameter. Considering the various challenges with the FFPE samples, we aimed to set a benchmark in QC metrics that can be utilized by molecular diagnostic laboratories for successful library preparation and high-quality NGS data output. In total, 144 DNA and 103 RNA samples of various cancer types with a maximum storage of 2 years were processed for 52 gene focus panels. During the making of DNA and RNA libraries, extensive QC check parameters were imposed at different checkpoints. The decision tree approach can be set as a benchmark for FFPE samples and as a guide to establishing a good clinical laboratory practice for targeted NGS panels.

Keywords: FFPE; diagnostics; libraries; next-generation sequencing (NGS); quality check (QC); solid tumors; standardization; targeted panel.


Conflict of interest statement

The authors declare no conflict of interest.

Figures

Figure 1
Figure 1
Quality check of FFPE DNA and RNA samples. (A,B): the fragment distribution of FFPE DNA and RNA samples on TapeStation, respectively. This shows the variation in nucleic acid extracted from FFPE samples before the library preparation (Left to Right). (C,D): the FFPE DNA library and RNA library, respectively. The average library size observed in the study for DNA is 255 bp and RNA is 245 bp (Left to Right).
Figure 2
Figure 2
Three-step quality check of representative FFPE DNA samples. (a). Good on-target coverage DNA sample QC on TapeStation. (b) Poor on-target coverage FFPE DNA sample qc on TapeStation. Figure 2 shows a three-step quality check (QC) of representative FFPE DNA samples showing good and poor coverage on TapeStation, respectively. Step 1: QC after amplification with DNA primer pool, Step 2: QC after index adapter ligation to the amplified DNA sample, Step 3: Final library after purification with magnetic beads. The good coverage samples (a) had DIN: 5.9, DNA concentration: 110 ng/µL, library concentration: 170 nmol, average library size (bp): 230, coverage: 804×. The poor coverage sample (b) had DIN: 2.3, DNA concentration: 2.5 ng/µL, library concentration: 2.12 nmol, average library size (bp): 253, coverage: 3.5×.
Figure 3
Figure 3
Graphical representation of parameters in FFPE DNA samples according to NGS coverage. (a): DIN, (b): DNA concentration, (c): DNA library concentration (Left to right). Figure 3 shows a box plot of FFPE DNA sample coverage with respect to parameters such as DIN, DNA concentration, and library concentration. All the parameters show a significant difference between the poor coverage (below 250× and 10% VAF) and good coverage (above 250× and 10% VAF). * represents the extreme data points, ◦ represents the ouliers data points.
Figure 4
Figure 4
Graphical representation of FFPE RNA samples according to NGS coverage. (a): RIN, (b): RNA input for cDNA, (c): RNA library concentration, (d): DV 100, (e): DV 200 (Left to Right). The figure describes a box plot of FFPE RNA samples coverage with respect to parameters such as RIN, RNA input for cDNA, RNA library concentration, DV 100, and DV 200. Only RNA library concentration (nanomol) was found to be significantly different between poor coverage (below 250×) and good coverage (above 250×). * represents the extreme data points, ◦ represents the ouliers data points.
Figure 5
Figure 5
Graphical representation of overall distribution value (dv) in FFPE RNA samples. (a): DV100 (Overall) (b): DV 200 (Overall) (c): Correlation between DV100 and DV200 (Left to Right). (a,b) describe the box plot of DV 100 and DV200 for RNA samples in the study. (c): The correlation between DV100 and DV200 for RNA samples in the study. ◦ represents the ouliers data points.
Figure 6
Figure 6
ROC analysis of FFPE samples. (a) DNA, (b) RNA.
Figure 7
Figure 7
Decision tree for FFPE DNA. This figure describes the decision tree based on the pre-analytical and post-analytical parameters observed in 144 DNA samples. DIN, DNA concentration, and library concentration are found to be the predictive parameters while implementing targeted NGS in diagnostic settings. The first QC checkpoint is at the preanalytical phase consisting of DIN and DNA concentration. The second QC is at the library concentration of DNA samples. Implementing both QC checks can predict the outcome of FFPE DNA-based NGS for a targeted panel in a diagnostics setting.

References

    1. Lawrence M.S., Stojanov P., Mermel C.H., Robinson J.T., Garraway L.A., Golub T.R., Meyerson M., Gabriel S.B., Lander E.S., Getz G. Discovery and saturation analysis of cancer genes across 21 tumour types. Nature. 2014;505:495–501. doi: 10.1038/nature12912. - DOI - PMC - PubMed
    1. Vogelstein B., Papadopoulos N., Velculescu V.E., Zhou S., Diaz L.A.J., Kinzler K.W. Cancer genome landscapes. Science. 2013;339:1546–1558. doi: 10.1126/science.1235122. - DOI - PMC - PubMed
    1. Hovelson D.H., McDaniel A.S., Cani A.K., Johnson B., Rhodes K., Williams P.D., Bandla S., Bien G., Choppa P., Hyland F., et al. Development and validation of a scalable next-generation sequencing system for assessing relevant somatic variants in solid tumors. Neoplasia. 2015;17:385–399. doi: 10.1016/j.neo.2015.03.004. - DOI - PMC - PubMed
    1. Morash M., Mitchell H., Beltran H., Elemento O., Pathak J. The Role of Next-Generation Sequencing in Precision Medicine: A Review of Outcomes in Oncology. J. Pers. Med. 2018;8:30. doi: 10.3390/jpm8030030. - DOI - PMC - PubMed
    1. Berrino E., Annaratone L., Miglio U., Maldi E., Piccinelli C., Peano E., Balmativola D., Cassoni P., Pisacane A., Sarotto I., et al. Cold Formalin Fixation Guarantees DNA Integrity in Formalin Fixed Paraffin Embedded Tissues: Premises for a Better Quality of Diagnostic and Experimental Pathology with a Specific Impact on Breast Cancer. Front. Oncol. 2020;10:173. doi: 10.3389/fonc.2020.00173. - DOI - PMC - PubMed

LinkOut - more resources