. 2022 Apr 26;13(5):766.
doi: 10.3390/genes13050766.

Contradictory Phylogenetic Signals in the Laurasiatheria Anomaly Zone

Affiliations

Contradictory Phylogenetic Signals in the Laurasiatheria Anomaly Zone

Liliya Doronina et al. Genes (Basel). .

Abstract

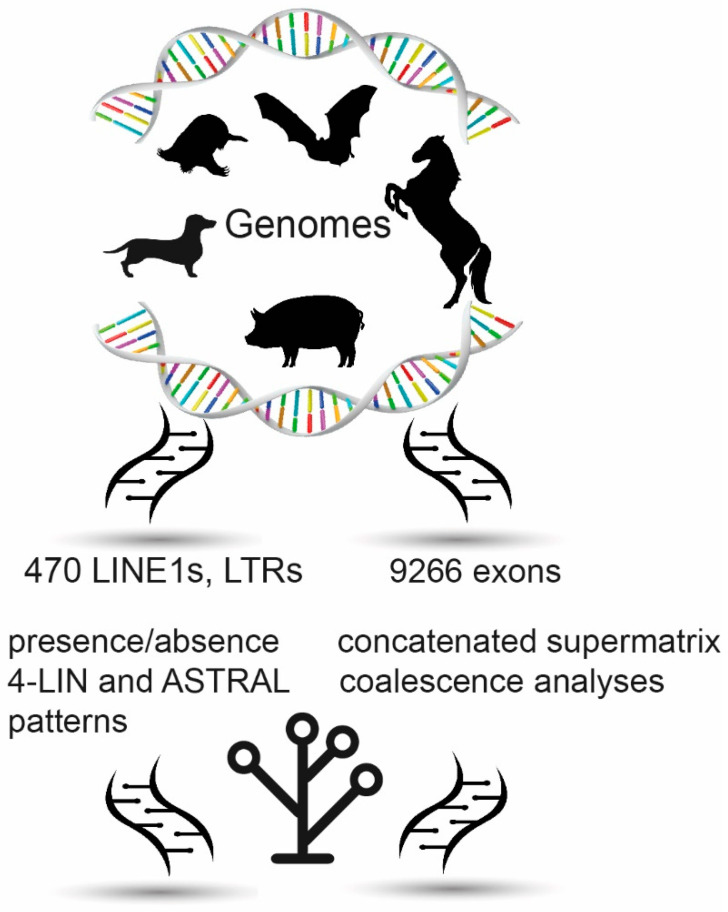
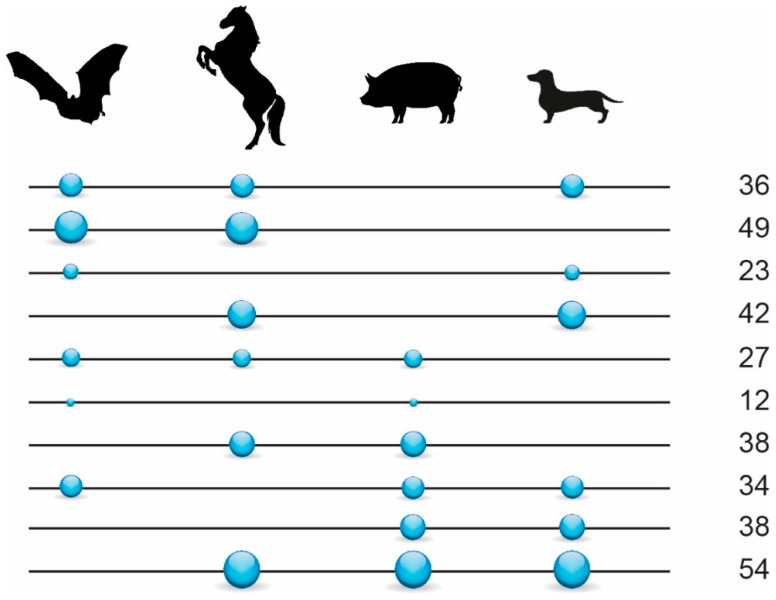
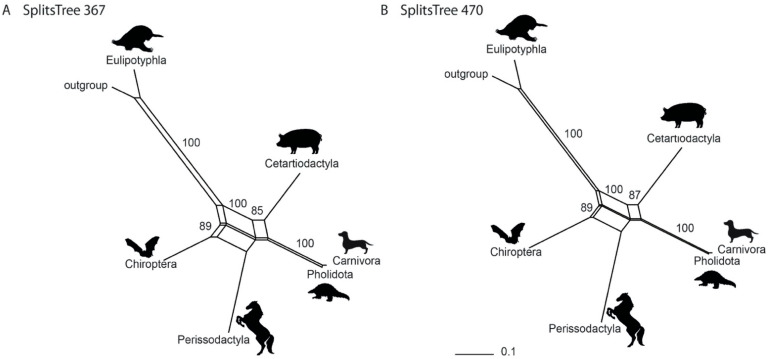
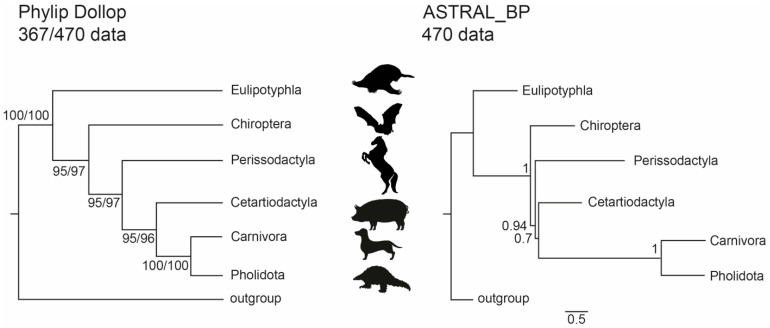
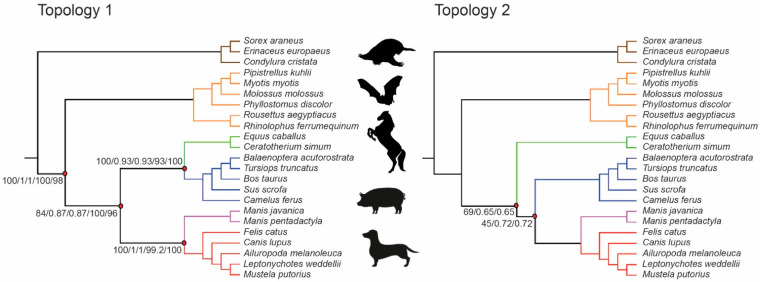
Relationships among laurasiatherian clades represent one of the most highly disputed topics in mammalian phylogeny. In this study, we attempt to disentangle laurasiatherian interordinal relationships using two independent genome-level approaches: (1) quantifying retrotransposon presence/absence patterns, and (2) comparisons of exon datasets at the levels of nucleotides and amino acids. The two approaches revealed contradictory phylogenetic signals, possibly due to a high level of ancestral incomplete lineage sorting. The positions of Eulipotyphla and Chiroptera as the first and second earliest divergences were consistent across the approaches. However, the phylogenetic relationships of Perissodactyla, Cetartiodactyla, and Ferae, were contradictory. While retrotransposon insertion analyses suggest a clade with Cetartiodactyla and Ferae, the exon dataset favoured Cetartiodactyla and Perissodactyla. Future analyses of hitherto unsampled laurasiatherian lineages and synergistic analyses of retrotransposon insertions, exon and conserved intron/intergenic sequences might unravel the conflicting patterns of relationships in this major mammalian clade.

Keywords: Laurasiatheria; Scrotifera; anomaly zone; exon coalescence; exon concatenation; retrophylogenomics.


Conflict of interest statement

The authors declare no conflict of interest.

Figures

Figure 1
Figure 1
Schematic representation of the applied phylogenetic approaches. Retrotransposon analyses of 470 diagnostic LINE1 and LTR presence/absence patterns (left) and exon sequence for concatenated and coalescence analyses (right).
Figure 2
Figure 2
Retrotransposon presence/absence markers in Scrotifera. Values on the right represent the total number of informative retrotransposon insertions found for the respective interordinal affiliations as indicated by the circles (e.g., 36 shared retrotransposons for Chiroptera, Perissodactyla, and Carnivora). Circles on lines represent the presence states of retrotransposons, and the lines without circles represent the absence states. The size of the circles reflects the relative number of diagnostic markers. We used only 353 markers diagnostic for Scrotifera (from 470 in total) for the 4-LIN analysis (represented in the figure).
Figure 3
Figure 3
Phylogenetic networks from neighbor-net analyses (SplitsTree4). The datasets of (A) 367 and (B) 470 retrotransposon markers were analysed. Numbers represent bootstrap values. Branch lengths are indicated below the trees.
Figure 4
Figure 4
Species tree for Laurasiatheria based on retrotransposon presence/absence data. The tree on the left is the most parsimonious tree with Dollo parsimony (261 and 360 steps for 367- and 470-marker datasets, respectively) and was obtained with the Dollop program in Phylip. The tree on the right was obtained with the coalescence method ASTRAL_BP. Numbers on the left are bootstrap support values; numbers on the right are local posterior probabilities. Dual bootstraps on the left show results for the new 367 TE dataset and the 470 TE dataset after adding non-overlapping data from Doronina et al. [36]. The branch lengths for the ASTRAL_BP tree, in coalescent units, are indicated by the scale bar.
Figure 5
Figure 5
Two laurasiatherian topologies with the highest support revealed by exon data analyses. Support scores for internal edges are displayed only for those edges where at least one dataset provides support < 100% (Topology 1: DNA concatenated ML, DNA coalescence polytomies not collapsed ASTRAL, DNA concatenated SVDquartets, amino acids concatenated ML; Topology 2: DNA (min 500 bp length) concatenated ML, DNA (min 500 bp length) coalescence polytomies not collapsed ASTRAL).

References

    1. Degnan J.H., Rosenberg N.A. Discordance of species trees with their most likely gene trees. PLoS Genet. 2006;2:e68. doi: 10.1371/journal.pgen.0020068. - DOI - PMC - PubMed
    1. Kuritzin A., Kischka T., Schmitz J., Churakov G. Incomplete lineage sorting and hybridization statistics for large-scale retroposon insertion data. PLoS Comput. Biol. 2016;12:e1004812. doi: 10.1371/journal.pcbi.1004812. - DOI - PMC - PubMed
    1. Doronina L., Churakov G., Shi J., Brosius J., Baertsch R., Clawson H., Schmitz J. Exploring massive incomplete lineage sorting in arctoids (Laurasiatheria, Carnivora) Mol. Biol. Evol. 2015;32:3194–3204. doi: 10.1093/molbev/msv188. - DOI - PubMed
    1. Doronina L., Feigin C.Y., Schmitz J. Reunion of Australasian possums by shared SINE insertions. Syst. Biol. 2022:syac025. doi: 10.1093/sysbio/syac025. - DOI - PMC - PubMed
    1. Feigin C.Y., Newton A.H., Doronina L., Schmitz J., Hipsley C.A., Mitchell K.J., Gower G., Llamas B., Soubrier J., Heider T.N., et al. Genome of the Tasmanian tiger provides insights into the evolution and demography of an extinct marsupial carnivore. Nat. Ecol. Evol. 2018;2:182–192. doi: 10.1038/s41559-017-0417-y. - DOI - PubMed

Publication types