. 2022 May 23;19(10):6304.
doi: 10.3390/ijerph19106304.

Long-Term Characteristics of Severe COVID-19: Respiratory Function, Functional Capacity, and Quality of Life

Affiliations

Long-Term Characteristics of Severe COVID-19: Respiratory Function, Functional Capacity, and Quality of Life

Ukbe Sirayder et al. Int J Environ Res Public Health. .

Abstract

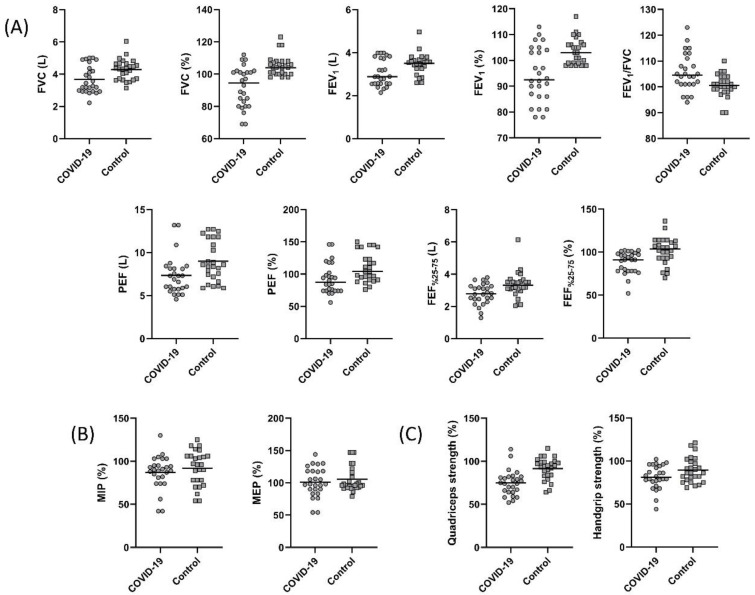
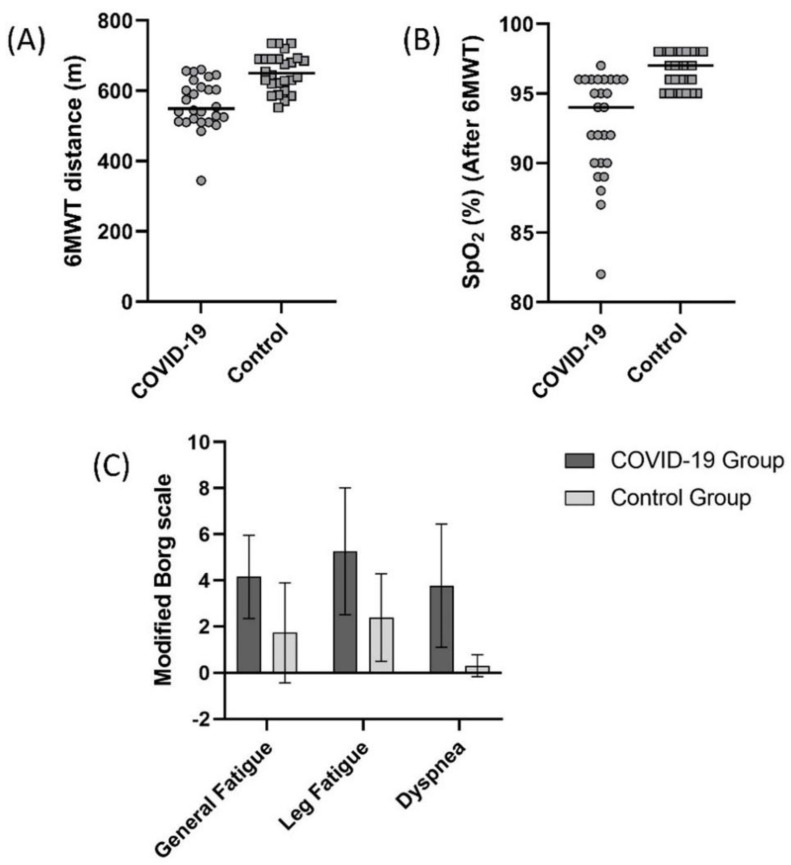
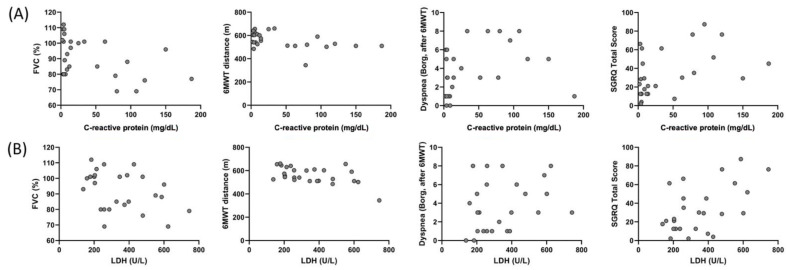
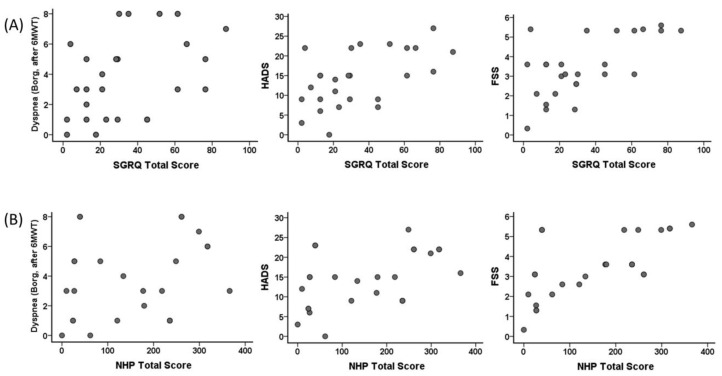
Recovery from pneumonia takes around 3−6 months in individuals with severe COVID-19. In order to detect the isolated damage caused by COVID-19, the 6-month period must pass after the recoveries. However, to our knowledge, no published study analyzes a comprehensive evaluation of individuals with severe COVID-19 after 6 months. We aimed to evaluate long-term consequences of severe COVID patients by comparing respiratory function, functional capacity, quality of life, fatigue, and balance 6 months after the intensive care unit (ICU) discharge with healthy individuals. Method: 26 post-COVID adult patients and 26 healthy individuals (control group) were included in this study. Physical characteristics of both groups and patients’ ICU data, including APACHE II scores, were recorded. Lung function, respiratory, and peripheral muscle strength were measured. The lower limit of normal (LLN) cutoff points for forced vital capacity (FVC) and forced expiratory volume in one second (FEV1) were calculated. A 6-minute walk test (6MWT) was used to assess functional capacity. Time Up and Go test (TUG) with a stadiometer was performed for balance evaluation. Quality of life was evaluated using Nottingham Health Profile (NHP) and St George Respiratory Questionnaire (SGRQ). Results: Percent predicted FVC and FEV1, 6MWT distance, change in oxygen saturation (SpO2) during 6MWT, were lower and NHP, SGRQ, FSS scores and TUG findings were higher in the COVID group than the control group (p < 0.05). The FVC of nine individuals and the FEV1 value of seven individuals in the COVID-19 group were below the LLN values. A moderate correlation was found between ICU length of stay and APACHE II scores with FVC, FEV1, 6MWT distance, and change in SpO2 values in the COVID-19 patients (p < 0.05). Conclusion: Respiratory function, functional capacity, quality of life, and fatigue levels of the individuals with severe COVID-19 infection are impaired at 6 months after ICU discharge. Impaired lung function might be associated with severe inflammation, which starts during the acute infection process and the fibrous tissue during the healing process, impairing lung compliance and diffusion capacity. Infiltration of coronavirus and inflammatory cytokines into the cerebrum and muscle might have increased fatigue and decreased functional capacity. Overall, our study suggests that severe COVID patients need post-discharge care even after 6 months of recovery.

Keywords: fatigue; fibrosis; functional capacity; lung function; post-COVID-19; quality of life.


Conflict of interest statement

The authors declare no conflict of interest.

Figures

Figure 1
Figure 1
Comparison of (A) forced vital capacity (FVC) (p = 0.005), percent predicted FVC (p < 0.001), forced expiratory volume in one second (FEV1) (p = 0.04), percent predicted FEV1 (p = 0.001), FEV1/FVC (p = 0.255), peak expiratory flow (PEF) (p = 0.01), percent predicted PEF (p = 0.007), forced expiratory volume from 25 to 75% (FEF25–75%) (p = 0.01), percent predicted FEF25–75% (p = 0.001), (B) percent predicted maximum inspiratory pressure (MIP) (p = 0.38), percent predicted maximum expiratory pressure (MEP) (p = 0.46), (C) percent predicted quadriceps strength (p < 0.001), and percent predicted handgrip strength (p = 0.048) between the COVID-19 and control groups.
Figure 2
Figure 2
Comparison of (A) 6 minute walk test (6MWT) distance (p < 0.001), (B) oxygen saturation (SpO2) after 6MWT (p < 0.001), (C) general fatigue (Borg) (p < 0.001), leg fatigue (Borg) (p < 0.001), and dyspnea (Borg) (p < 0.001) scores between the COVID-19 and control groups.
Figure 3
Figure 3
Comparison of (A) sway area (eyes open (stable ground), p = 0.049; eyes closed (stable ground), p = 0.009; eyes open (unstable ground), p = 0.038; eyes closed (unstable ground), p = 0.010), (B) trace length (eyes open (stable ground), p = 0.11; eyes closed (stable ground), p = 0.01; eyes open (unstable ground), p = 0.11; eyes closed (unstable ground), p = 0.01), (C) velocity (eyes open (stable ground), p = 0.14; eyes closed (stable ground), p = 0.003; eyes open (unstable ground), p = 0.01; eyes closed (unstable ground), p = 0.01), (D) lateral sway (eyes open (stable ground), p = 0.18; eyes closed (stable ground), p = 0.02; eyes open (unstable ground), p = 0.003; eyes closed (unstable ground), p = 0.01), (E) anterior-posterior sway eyes open (stable ground), p = 0.02; eyes closed (stable ground), p = 0.002; eyes open (unstable ground), p = 0.39; eyes closed (unstable ground), p = 0.004) scores between the COVID-19 and control groups.
Figure 4
Figure 4
Correlation of the C-reactive protein with (A) FVC (%) (r = −0.392, p = 0.048), 6MWT distance (r = −0.460, p = 0.01), dyspnea (Borg, after 6MWT) (r = 0.417, p = 0.03), and SGRQ total score (r = 0.465, p = 0.01), and correlation of LDH with (B) FVC (%) (r = −0.406, p = 0.04), 6MWT distance (r = −0.516, p = 0.007), dyspnea (Borg, after 6MWT) (r = 0.321, p = 0.11), and SGRQ total score (r = 0.442, p = 0.02) in the COVID-19 group.
Figure 5
Figure 5
Correlation of the St. George Respiratory Questionnaire (SGRQ) total score with (A) dyspnea (Borg, after 6MWT) (r = 0.448, p = 0.02), Hospital Anxiety and Depression Scale (HADS) (r = 0.543, p = 0.004), and Fatigue Severity Scale (FSS) (r = 0.528, p = 0.006), and correlation of Nottingham Health Profile (NHP) total score with (B) dyspnea (Borg, after 6MWT) (r = 0.358, p = 0.07), HADS (r = 0.536, p = 0.005), and FSS (r = 0.723, p < 0.001) in the COVID-19 group.

References

    1. Gattinoni L., Coppola S., Cressoni M., Busana M., Rossi S., Chiumello D. COVID-19 Does Not Lead to a ‘Typical’ Acute Respiratory Distress Syndrome. Am. J. Respir. Crit. Care Med. 2020;201:1299–1300. doi: 10.1164/rccm.202003-0817LE. - DOI - PMC - PubMed
    1. Dara N., Hosseini A., Sayyari A.A., Gaman M.A., Fatahi S. Gastrointestinal Manifestations and Dynamics of Liver Enzymes in Children and Adolescents with COVID-19 Infection: A Systematic Review and Meta-Analysis. Iran. J. Pediatr. 2020;30:1–9. doi: 10.5812/ijp.106935. - DOI
    1. Yin S., Huang M., Li D., Tang N. Difference of Coagulation Features between Severe Pneumonia Induced by SARS-CoV2 and Non-SARS-CoV2. J. Thromb. Thrombolysis. 2021;51:1107–1110. doi: 10.1007/s11239-020-02105-8. - DOI - PMC - PubMed
    1. Guan W., Ni Z., Hu Y., Liang W., Ou C., He J., Liu L., Shan H., Lei C., Hui D.S.C. Clinical Characteristics of Coronavirus Disease 2019 in China. N. Engl. J. Med. 2020;382:1708–1720. doi: 10.1056/NEJMoa2002032. - DOI - PMC - PubMed
    1. Fara A., Mitrev Z., Rosalia R.A., Assas B.M. Cytokine Storm and COVID-19: A Chronicle of pro-Inflammatory Cytokines. Open. Biol. 2020;10:200160. doi: 10.1098/rsob.200160. - DOI - PMC - PubMed