. 2022 May 10;23(10):5332.
doi: 10.3390/ijms23105332.

Decreased Tissue Omega-6/Omega-3 Fatty Acid Ratio Prevents Chemotherapy-Induced Gastrointestinal Toxicity Associated with Alterations of Gut Microbiome

Affiliations

Decreased Tissue Omega-6/Omega-3 Fatty Acid Ratio Prevents Chemotherapy-Induced Gastrointestinal Toxicity Associated with Alterations of Gut Microbiome

Kanakaraju Kaliannan et al. Int J Mol Sci. .

Abstract

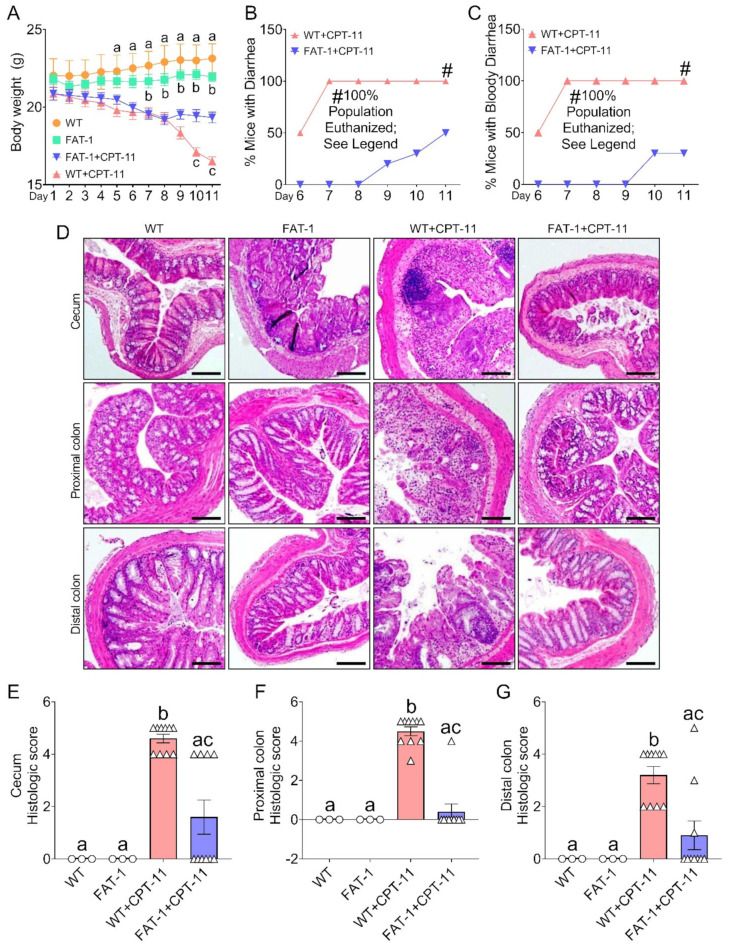
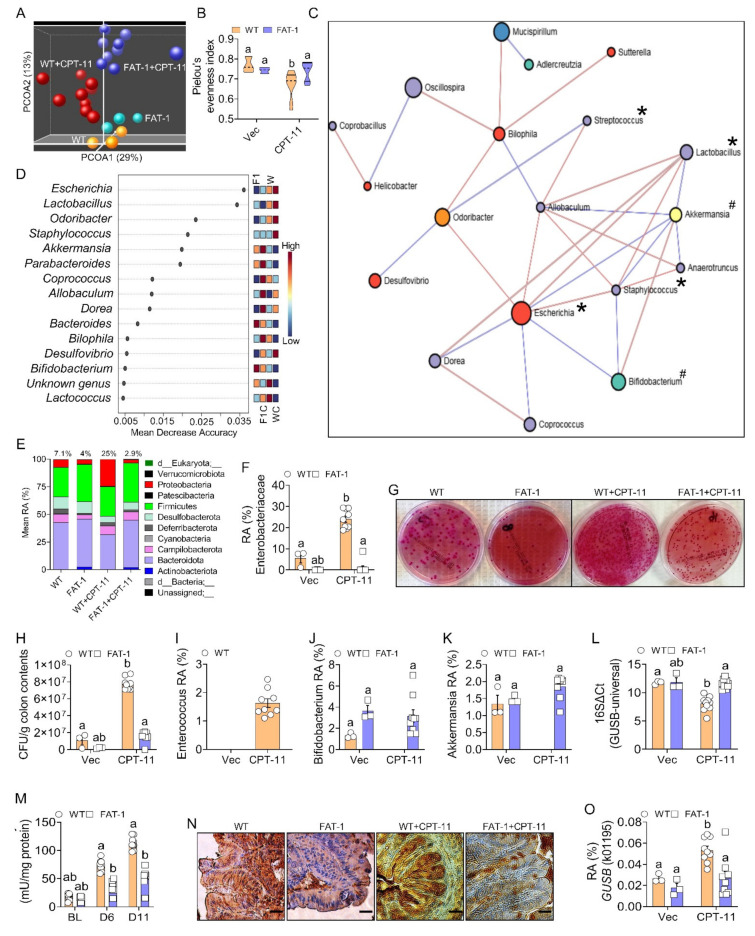
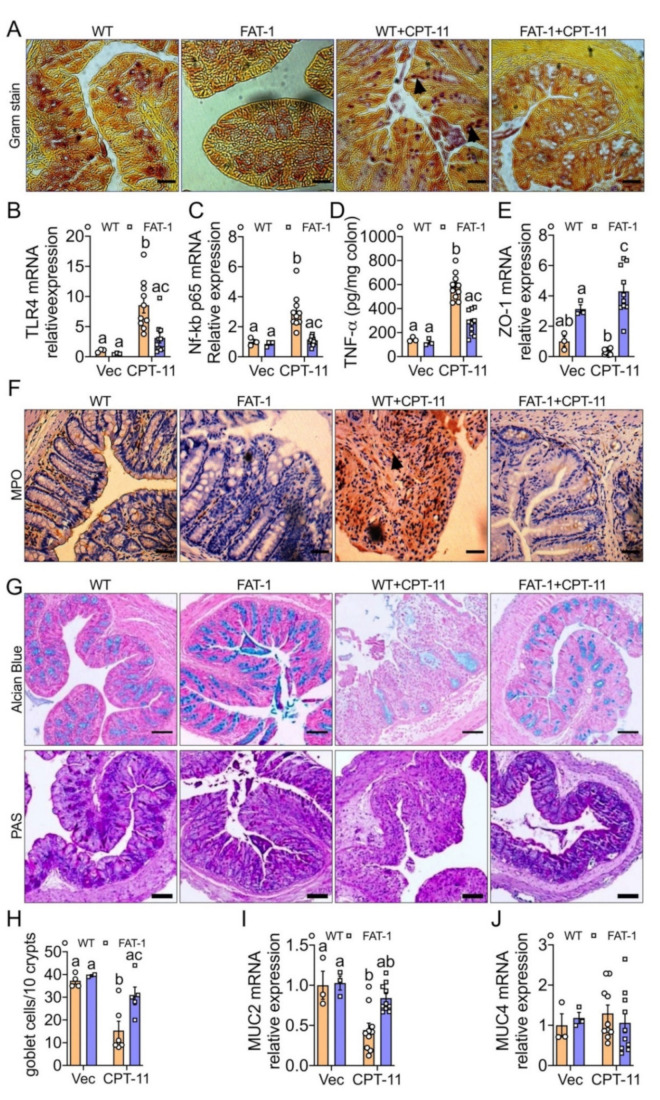
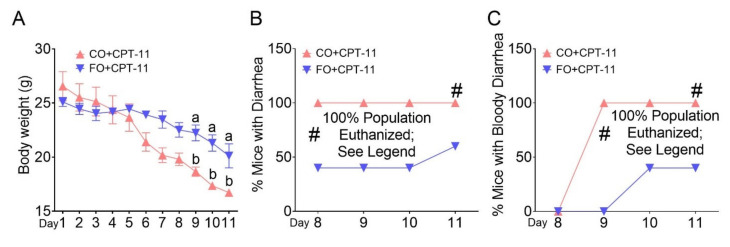
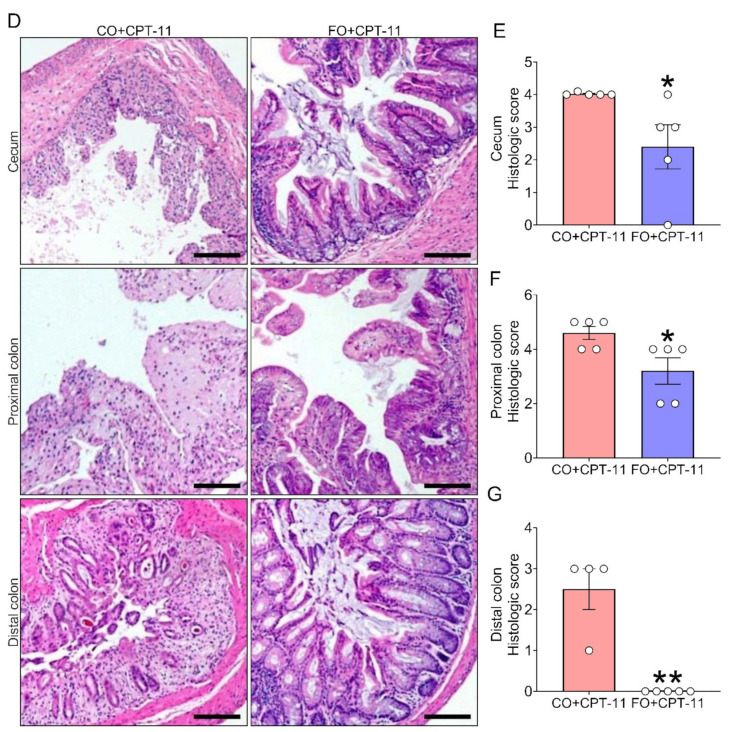
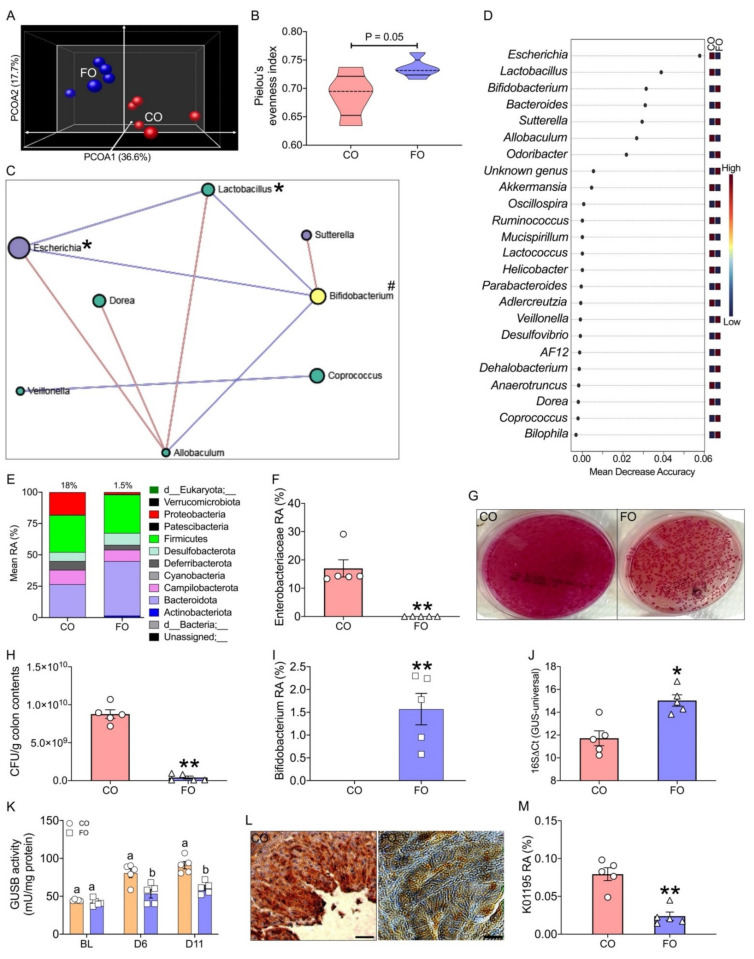
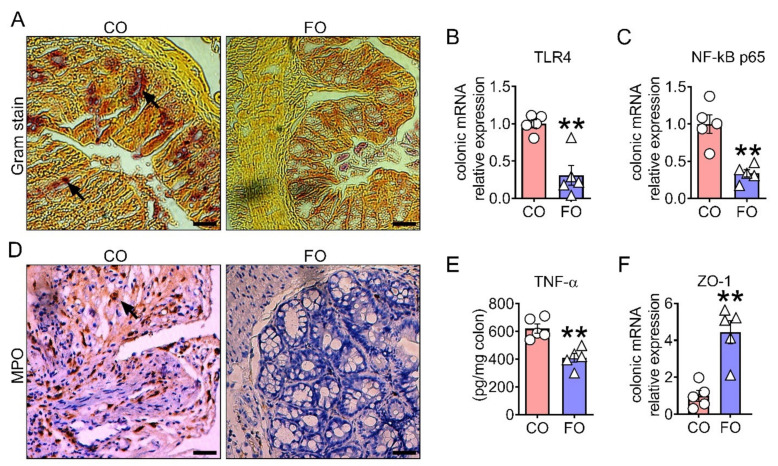
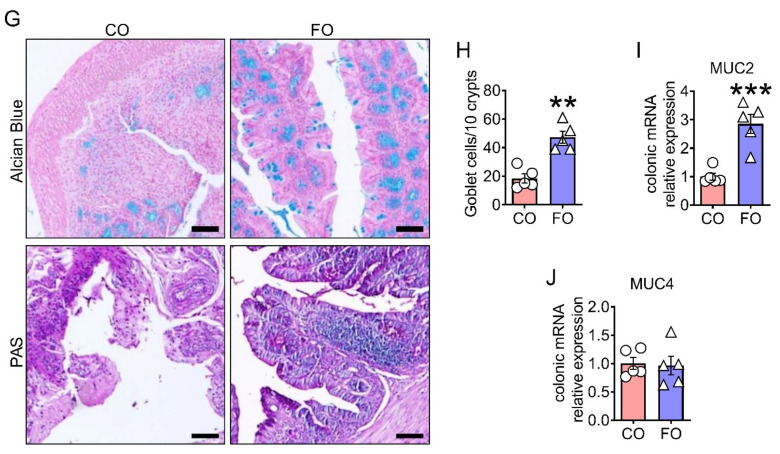
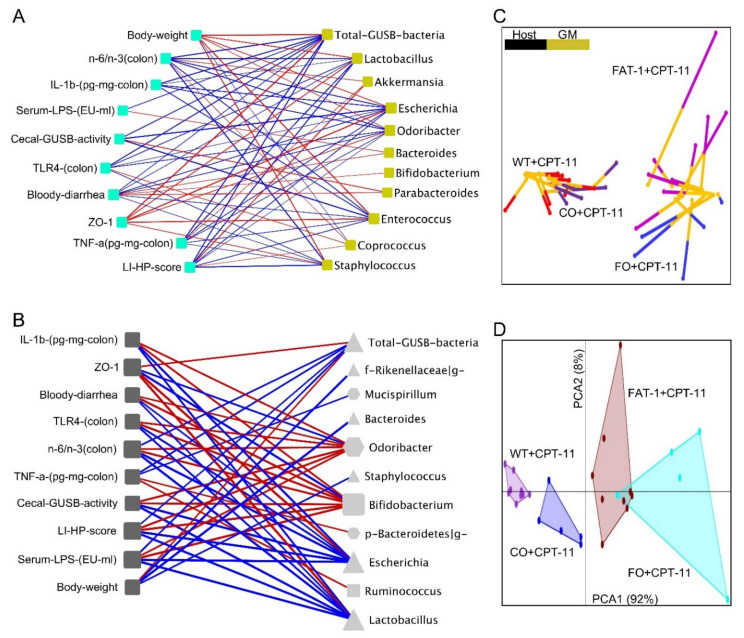
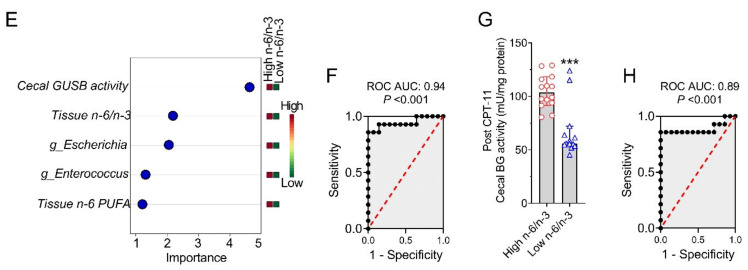
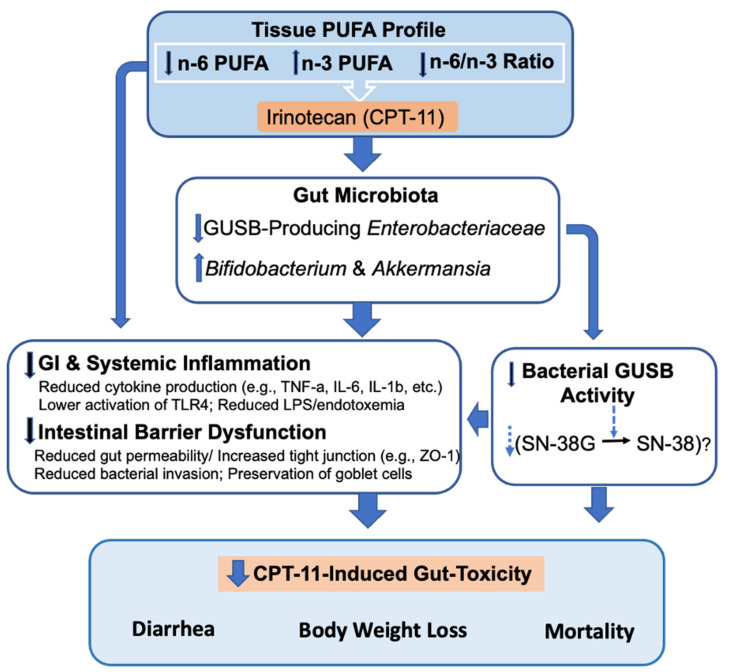
Gastrointestinal toxicity (GIT) is a debilitating side effect of Irinotecan (CPT-11) and limits its clinical utility. Gut dysbiosis has been shown to mediate this side effect of CPT-11 by increasing gut bacterial β-glucuronidase (GUSB) activity and impairing the intestinal mucosal barrier (IMB). We have recently shown the opposing effects of omega-6 (n-6) and omega-3 (n-3) polyunsaturated fatty acids (PUFA) on the gut microbiome. We hypothesized that elevated levels of tissue n-3 PUFA with a decreased n-6/n-3 PUFA ratio would reduce CPT-11-induced GIT and associated changes in the gut microbiome. Using a unique transgenic mouse (FAT-1) model combined with dietary supplementation experiments, we demonstrate that an elevated tissue n-3 PUFA status with a decreased n-6/n-3 PUFA ratio significantly reduces CPT-11-induced weight loss, bloody diarrhea, gut pathological changes, and mortality. Gut microbiome analysis by 16S rRNA gene sequencing and QIIME2 revealed that improvements in GIT were associated with the reduction in the CPT-11-induced increase in both GUSB-producing bacteria (e.g., Enterobacteriaceae) and GUSB enzyme activity, decrease in IMB-maintaining bacteria (e.g., Bifidobacterium), IMB dysfunction and systemic endotoxemia. These results uncover a host-microbiome interaction approach to the management of drug-induced gut toxicity. The prevention of CPT-11-induced gut microbiome changes by decreasing the tissue n-6/n-3 PUFA ratio could be a novel strategy to prevent chemotherapy-induced GIT.

Keywords: CPT-11; FAT-1 transgenic mouse; GUSB; beta-glucuronidase; chemotherapy-induced gut-toxicity; gut microbiome; irinotecan; omega-3 fatty acids; omega-6/omega-3 PUFA ratio.


Conflict of interest statement

The authors declare no potential conflict of interest.

Figures

Figure 1
Figure 1
Decreased tissue n-6/n-3 ratio reduces CPT-11-induced gastrointestinal toxicities. Male, five-week-old wild type (WT) and FAT-1 transgenic mice fed an identical corn oil diet were arranged into four groups. Mice from WT+CPT-11 and FAT-1+CPT-11 groups and WT and FAT-1 control groups were subjected to nine consecutive days of treatment with intraperitoneal injections (i.p.,) of 50 mg/kg CPT-11 and vehicle for CPT-11, respectively. Please refer to Figure S1A for experimental design. (A) Body weight was monitored every day. (B,C) CPT-11 produced diarrhea and bloody diarrhea starting after six days and peaking at seven days in the WT+CPT-11 group. In contrast, the incidence of diarrhea and bloody diarrhea were reduced in the FAT-1+CPT-11 group. The vehicle alone caused no bloody diarrhea in the control of WT and FAT-1 groups. By days 8 to 11, mice in the WT+CPT-11 group began to suffer from severe lethargy and lack of movement; by day 11, all mice in that group were euthanized. (D) Intestinal tissue was sectioned into the cecum and proximal and distal colon, and the morphology of the intestines was photographed after H&E staining. FAT-1+CPT-11 group showed a healthy glandular structure, but the WT+CPT-11 group showed highly disrupted tissues. (EG) Histopathological scores for cecum and proximal and distal colonic inflammatory infiltration and epithelial damage. Data are shown as mean ± standard error of the mean. Panel (A) data were analyzed by repeated-measures two-way ANOVA followed by Tukey’s multiple comparisons test and p < 0.05 for a (WT vs. WT+CPT-11), b (FAT-1 vs. FAT-1+CPT-11), and c (WT+CPT-11 vs. FAT-1+CPT-1). Panel (B,C) data were analyzed by regular two-way ANOVA followed by Sidak’s multiple comparisons test and p < 0.05 at all-time points. Data with different superscript letters are significantly different (p < 0.05) according to ordinary two-way (EG) followed by Tukey’s multiple comparisons test. Scale bar for images: 1500 μm.
Figure 2
Figure 2
Decreased tissue n-6/n-3 ratio prevents CPT-11-induced alterations in the gut microbiome. (A) Principal coordinates analysis (PCOA) plot showing the results of Bray–Curtis distance-based analysis of beta diversity metrics. (B) Violin plot with lines at the median (dashed lines) and quartiles (complete lines) showing the differences in the Pielou’s evenness index. (C) Microbe–microbe interactions network [SparCC correlation analysis (WT+CPT-11 vs. FAT-1+CPT-11)]. Each node (*, GUSB-producing taxa; #, healthy gut making taxa) represents a taxon (colored based on the phylum level and sized based on the number of connections to that taxon). Two taxa are connected by an edge (co-occurrences: red; anti-occurrences: blue; p-value < 0.05 and correlation threshold 0.3; size reflects the magnitude). (D) Random Forests classification of taxa (genus level) in the vehicle (W and F1) or CPT-11 (WC and F1C) treated groups. (E) Phyla detected in the control and CPT-11 treated WT and FAT-1 mice. The numbers above each group show the relative abundance (RA) of the Proteobacteria phylum. (FK) RA of differentially abundant (ANCOM test by QIIME2) bacterial groups such as Enterobacteriaceae (F) with representative colonic luminal contents MacConkey agar culture plate photos (G) showing the difference (H) in the growth of Escherichia Coli (pink colonies), Enterococcus (I), Bifidobacterium (J) and Akkermansia (K). (L) RA of beta-glucuronidase (GUSB)-producing bacteria measured using qPCR. (M) The difference in GUSB activity was measured at baseline (BL) and days (d) 6 using stool samples and at days 11 using cecal contents. (N) Immunohistochemical staining-based GUSB gene expression patterns in the proximal colon. (O) RA of GUSB (K01195) gene predicted using PICRUSt2. Data are shown as mean ± standard error of the mean. Data with different superscript letters are significantly different (p < 0.05) according to the Kruskal–Wallis test (B) or Mann–Whitney test, or ordinary two-way (M) ANOVA followed by Sidak’s multiple comparisons test. Scale bar for images in (J) panel: 2000 μm.
Figure 3
Figure 3
Decreased n-6/n-3 ratio prevents CPT-11-induced intestinal mucosal barrier dysfunction. (A) Gram staining was performed on paraffin sections of proximal colonic tissue sections and evaluated by microscopy for the presence of Gram-negative (pink) bacteria (arrowheads). (BF) The markers of colonic mucosal inflammation [toll-like receptor 4 (TLR 4), NF-kB-p65 and TNF-α], barrier integrity [Zonulin 1 (ZO-1] and inflammatory cells infiltration were analyzed by real-time polymerase chain reaction (PCR), Bio-Plex immunoassays, and Myeloperoxidase (MPO) immunohistochemistry assays to quantify the levels of messenger RNA (mRNA) (B,C,E), cytokine (D) and infiltrated neutrophils (arrowhead) (F), respectively. (G,H) Representative pictures showed the differences in colonic Alcian Blue (acid mucins by blue color) and PAS (mixture of acid and neutral mucins by purple color) stained goblet cells and scattered dot-plot showing the numbers of Alcian blue-stained goblet cell counts. (I,J) Differences in the Mucin2 (MUC2) and Mucin4 (MUC4) relative gene expression. Data are shown as mean ± standard error of the mean. According to ordinary two-way ANOVA, data with different superscript letters are significantly different (p < 0.05), followed by Tukey’s multiple comparisons tests. The scale bar for images in (A,F,G) panels is 3000 μm and 1000 μm.
Figure 4
Figure 4
Dietary n-3 PUFA supplementation reduces CPT-11-induced gastrointestinal toxicities. Male, five-week-old wild type (WT) mice were divided into two groups (n = 5 per group) and were fed omega-6 [10% corn oil (CO)] and omega-3 [5% CO+5% fish oil (FO)] PUFA supplemented diets for two months. These mice were then subjected to nine consecutive days of treatment with intraperitoneal injections (i.p.,) 50 mg/kg CPT-11. (A) Bodyweight was monitored every day. (B) CPT-11 produced diarrhea starting as well as peaking after eight days in the CO+CPT-11 group. (C) CPT-11 produced bloody diarrhea starting after eight days and peaking at nine days in the CO+CPT-11 group, whereas the incidence of diarrhea and bloody diarrhea were reduced in the FO+CPT-11 group. By days 9 to 11, mice in the CO+CPT-11 group began to suffer from severe lethargy and lack of movement; by day 11, all mice in that group were euthanized. (D) Large intestinal tissue was sectioned into the ice, cecum, proximal and distal colon, and the intestines’ morphology was photographed after H&E staining. FO+CPT-11 group showed a healthy glandular structure, but the CO+CPT-11 group showed highly disrupted tissues. (EG) Histopathological scores for cecum and proximal and distal colonic inflammatory infiltration and epithelial damage. Data are shown as mean ± standard error of the mean. Data with different superscript letters are significantly different (p < 0.05) according to repeated measures, two-way ANOVA followed by Sidak’s multiple comparisons test (A). Regular two-way ANOVA followed by Sidak’s multiple comparisons test, p < 0.05 at all-time points (B,C). Nonparametric Mann–Whitney test (EG). * p < 0.05, ** p < 0.01, Scale bar for images: 1500 μm.
Figure 4
Figure 4
Dietary n-3 PUFA supplementation reduces CPT-11-induced gastrointestinal toxicities. Male, five-week-old wild type (WT) mice were divided into two groups (n = 5 per group) and were fed omega-6 [10% corn oil (CO)] and omega-3 [5% CO+5% fish oil (FO)] PUFA supplemented diets for two months. These mice were then subjected to nine consecutive days of treatment with intraperitoneal injections (i.p.,) 50 mg/kg CPT-11. (A) Bodyweight was monitored every day. (B) CPT-11 produced diarrhea starting as well as peaking after eight days in the CO+CPT-11 group. (C) CPT-11 produced bloody diarrhea starting after eight days and peaking at nine days in the CO+CPT-11 group, whereas the incidence of diarrhea and bloody diarrhea were reduced in the FO+CPT-11 group. By days 9 to 11, mice in the CO+CPT-11 group began to suffer from severe lethargy and lack of movement; by day 11, all mice in that group were euthanized. (D) Large intestinal tissue was sectioned into the ice, cecum, proximal and distal colon, and the intestines’ morphology was photographed after H&E staining. FO+CPT-11 group showed a healthy glandular structure, but the CO+CPT-11 group showed highly disrupted tissues. (EG) Histopathological scores for cecum and proximal and distal colonic inflammatory infiltration and epithelial damage. Data are shown as mean ± standard error of the mean. Data with different superscript letters are significantly different (p < 0.05) according to repeated measures, two-way ANOVA followed by Sidak’s multiple comparisons test (A). Regular two-way ANOVA followed by Sidak’s multiple comparisons test, p < 0.05 at all-time points (B,C). Nonparametric Mann–Whitney test (EG). * p < 0.05, ** p < 0.01, Scale bar for images: 1500 μm.
Figure 5
Figure 5
Dietary n-3 PUFA supplementation reduces CPT-11-induced alterations in the gut microbiome. (A) Principal coordinates analysis (PCOA) plot showing the results of Bray–Curtis distance-based analysis of beta diversity metrics. (B) Violin plot with lines at the median (dashed lines) and quartiles (complete lines) showing the differences in the Pielou’s evenness index (α-diversity). (C) Microbe–microbe interactions network [SparCC correlation analysis (CO+CPT-11 vs. FO+CPT-11)]. Each node (*, GUSB-producing taxa; #, healthy gut making taxa) represents a taxon (colored based on the phylum level and sized based on the number of connections to that taxon). Two taxa are connected by an edge (co-occurrences: red; anti-occurrences: blue; p-value < 0.05 and correlation threshold 0.3; size reflects the magnitude). (D) Random Forests classification of taxa (genus level) of CPT-11 treated CO and FO groups. (E) Composition summary showing the phyla detected in the CPT-11 treated CO and FO groups. The numbers above each bar show the relative abundance (RA) of the Proteobacteria phylum. (FI) RA of differentially abundant bacterial groups such as Enterobacteriaceae (F) with representative colonic luminal contents MacConkey agar culture plate photos (G) showing the difference (H) in the growth of Escherichia Coli and Bifidobacterium (I), which is not detectable in CO group. (J) qPCR results showing the RA of beta-glucuronidase (GUSB)-producing bacteria. (K) The difference in GUSB activity was measured at baseline (BL) and days (d) 6 using stool samples and at days 11 using cecal contents. (L) Representative pictures are showing GUSB expression measured at proximal colon using the immunohistochemical technique. (M) RA of GUSB (K01195) gene predicted using PICRUSt2. Data are shown as mean ± standard error of the mean. Data with different superscript letters are significantly different (p < 0.05) according to the nonparametric Mann–Whitney test (* p < 0.05, ** p < 0.01) or ordinary two-way (K) ANOVA followed by Sidak’s multiple comparisons tests. Scale bar for images in (J) panel: 2000 μm.
Figure 6
Figure 6
Dietary n-3 PUFA supplementation reduces CPT-11-induced intestinal mucosal barrier dysfunction. (A) Gram staining was performed on proximal colonic tissue sections and evaluated by microscopy for the presence of Gram-negative (pink) bacteria (arrowheads). (BF) The markers of colonic mucosal inflammation [toll-like receptor 4 (TLR 4), NF-kB-p65 and TNF-α], barrier integrity [Zonulin 1 (ZO-1] and infiltration of inflammatory cells were analyzed by real-time polymerase chain reaction (PCR), Bio-Plex immunoassays and Myeloperoxidase (MPO) immunohistochemistry assays to quantify the levels of messenger RNA (mRNA) (B,C,E), cytokine (D) and infiltrated neutrophils (E), respectively. (G,H) Representative pictures showed the differences in colonic Alcian Blue (acid mucins by blue color) and PAS (mixture of acid and neutral mucins by purple color) stained goblet cells and scattered dot-plot showing the numbers of Alcian blue-stained goblet cell counts. (I,J) Differences in the Mucin2 (MUC2) and Mucin4 (MUC4) relative gene expression. Data are shown as mean ± standard error of the mean. ** p < 0.01, *** p < 0.001, Student’s t-test or nonparametric Mann–Whitney test. The scale bar for images in (A,D,G) panels are 3000 μm and 1000 μm, respectively.
Figure 6
Figure 6
Dietary n-3 PUFA supplementation reduces CPT-11-induced intestinal mucosal barrier dysfunction. (A) Gram staining was performed on proximal colonic tissue sections and evaluated by microscopy for the presence of Gram-negative (pink) bacteria (arrowheads). (BF) The markers of colonic mucosal inflammation [toll-like receptor 4 (TLR 4), NF-kB-p65 and TNF-α], barrier integrity [Zonulin 1 (ZO-1] and infiltration of inflammatory cells were analyzed by real-time polymerase chain reaction (PCR), Bio-Plex immunoassays and Myeloperoxidase (MPO) immunohistochemistry assays to quantify the levels of messenger RNA (mRNA) (B,C,E), cytokine (D) and infiltrated neutrophils (E), respectively. (G,H) Representative pictures showed the differences in colonic Alcian Blue (acid mucins by blue color) and PAS (mixture of acid and neutral mucins by purple color) stained goblet cells and scattered dot-plot showing the numbers of Alcian blue-stained goblet cell counts. (I,J) Differences in the Mucin2 (MUC2) and Mucin4 (MUC4) relative gene expression. Data are shown as mean ± standard error of the mean. ** p < 0.01, *** p < 0.001, Student’s t-test or nonparametric Mann–Whitney test. The scale bar for images in (A,D,G) panels are 3000 μm and 1000 μm, respectively.
Figure 7
Figure 7
Decreased tissue n-6/n-3 ratio reduces CPT-11-induced imbalances in the host–gut microbiome interactions. (A,B) Host–microbiota interaction network built from Spearman’s nonparametric rank correlation coefficient (p < 0.05) between host parameters and entire microbial parameters (genus-level) of WT+CPT-11 vs. FAT-1+CPT-1 (A) and CO+CPT-11 vs. FO+CPT-11 (B) comparisons. Nodes (filled squares) in panel A represent host parameters (cyan) and microbes (olive). Nodes in panel B represent host parameters (filled squares colored black) and microbes (different shapes indicate different phylum and colored light black). Lines (edges) represent statistically significant correlations (p < 0.05) and are colored blue for positive and red for negative correlations. Edge size reflects the magnitude of the correlation. (C) Multiple Factor Analysis superimposing the host and gut microbiome (genus-level) data associated with a high tissue n-6/n-3 ratio (WT+CPT-11/CO+CPT-11 samples) and a low tissue n-6/n-3 PUFA ratio (FAT-1+CPT-11/FO+CPT-11 samples). Each line connects the host and microbial data from one sample. One end of each connecting line for an observation indicates the host (differently colored to indicate the groups), and another end (dark yellow) indicates the gut microbiota (GM). (D) Principal component analysis (PCA) of the host and gut microbiome (genus-level) data associated with a high n-6/n-3 ratio and a low n-6/n-3 PUFA ratio. (E,F) Biomarker analysis using multivariate [Random Forests (RF) classification with PLS-DA feature ranking method] receiver operator characteristic curve (ROC) based exploratory analysis performed on the combined host and microbial parameters. (G) Post-CPT-11 cecal contents beta-glucuronidase (GUSB) activity measurements were associated with a high n-6/n-3 ratio and a low n-6/n-3 PUFA ratio. (H) ROC curve generated with classical univariate ROC curve analysis showing the sensitivity and specificity for cecal contents GUSB activity. Data are shown as mean ± standard error of the mean. *** p < 0.001, nonparametric Mann–Whitney test.
Figure 7
Figure 7
Decreased tissue n-6/n-3 ratio reduces CPT-11-induced imbalances in the host–gut microbiome interactions. (A,B) Host–microbiota interaction network built from Spearman’s nonparametric rank correlation coefficient (p < 0.05) between host parameters and entire microbial parameters (genus-level) of WT+CPT-11 vs. FAT-1+CPT-1 (A) and CO+CPT-11 vs. FO+CPT-11 (B) comparisons. Nodes (filled squares) in panel A represent host parameters (cyan) and microbes (olive). Nodes in panel B represent host parameters (filled squares colored black) and microbes (different shapes indicate different phylum and colored light black). Lines (edges) represent statistically significant correlations (p < 0.05) and are colored blue for positive and red for negative correlations. Edge size reflects the magnitude of the correlation. (C) Multiple Factor Analysis superimposing the host and gut microbiome (genus-level) data associated with a high tissue n-6/n-3 ratio (WT+CPT-11/CO+CPT-11 samples) and a low tissue n-6/n-3 PUFA ratio (FAT-1+CPT-11/FO+CPT-11 samples). Each line connects the host and microbial data from one sample. One end of each connecting line for an observation indicates the host (differently colored to indicate the groups), and another end (dark yellow) indicates the gut microbiota (GM). (D) Principal component analysis (PCA) of the host and gut microbiome (genus-level) data associated with a high n-6/n-3 ratio and a low n-6/n-3 PUFA ratio. (E,F) Biomarker analysis using multivariate [Random Forests (RF) classification with PLS-DA feature ranking method] receiver operator characteristic curve (ROC) based exploratory analysis performed on the combined host and microbial parameters. (G) Post-CPT-11 cecal contents beta-glucuronidase (GUSB) activity measurements were associated with a high n-6/n-3 ratio and a low n-6/n-3 PUFA ratio. (H) ROC curve generated with classical univariate ROC curve analysis showing the sensitivity and specificity for cecal contents GUSB activity. Data are shown as mean ± standard error of the mean. *** p < 0.001, nonparametric Mann–Whitney test.
Figure 8
Figure 8
Proposed mechanisms for the preventive effects of the decreased tissue n-6/n-3 ratio on the CPT-11-induced gut toxicities. Diagram illustrating that elevated tissue omega-3 PUFA status with a reduced tissue n-6/n-3 PUFA ratio alters gut microbiome composition and functions, exerts anti-inflammatory and mucosal protective effects, and additionally, reduces the abundance of GUSB-producing bacteria, GUSB activity and potentially the conversion of inactive SN-38G to toxic SN-38. These alterations together with other gut-microbiota-independent mechanisms reduce mucosal injuries, mucosal inflammation, goblet cell dysfunction, impairment in the gut barrier, and systemic endotoxemia, resulting in the prevention of CPT-11-induced gut toxicities (bodyweight loss, late-onset diarrhea, and bloody diarrhea, and death).

References

    1. Stein A., Voigt W., Jordan K. Chemotherapy-induced diarrhea: Pathophysiology, frequency and guideline-based management. Ther. Adv. Med. Oncol. 2010;2:51–63. doi: 10.1177/1758834009355164. - DOI - PMC - PubMed
    1. Swami U., Goel S., Mani S. Therapeutic targeting of CPT-11 induced diarrhea: A case for prophylaxis. Curr. Drug Targets. 2013;14:777–797. doi: 10.2174/1389450111314070007. - DOI - PMC - PubMed
    1. Rivory L.P., Bowles M.R., Robert J., Pond S.M. Conversion of irinotecan (CPT-11) to its active metabolite, 7-ethyl-10-hydroxycamptothecin (SN-38), by human liver carboxylesterase. Biochem. Pharmacol. 1996;52:1103–1111. doi: 10.1016/0006-2952(96)00457-1. - DOI - PubMed
    1. Jinno H., Tanaka-Kagawa T., Hanioka N., Saeki M., Ishida S., Nishimura T., Ando M., Saito Y., Ozawa S., Sawada J. Glucuronidation of 7-ethyl-10-hydroxycamptothecin (SN-38), an active metabolite of irinotecan (CPT-11), by human UGT1A1 variants, G71R, P229Q, and Y486D. Drug Metab. Dispos. 2003;31:108–113. doi: 10.1124/dmd.31.1.108. - DOI - PubMed
    1. Mathijssen R.H., van Alphen R.J., Verweij J., Loos W.J., Nooter K., Stoter G., Sparreboom A. Clinical pharmacokinetics and metabolism of irinotecan (CPT-11) Clin. Cancer Res. 2001;7:2182–2194. - PubMed

MeSH terms

LinkOut - more resources