. 2022 May 11;23(10):5347.
doi: 10.3390/ijms23105347.

Acute Colon Inflammation Triggers Primary Motor Cortex Glial Activation, Neuroinflammation, Neuronal Hyperexcitability, and Motor Coordination Deficits

Affiliations

Acute Colon Inflammation Triggers Primary Motor Cortex Glial Activation, Neuroinflammation, Neuronal Hyperexcitability, and Motor Coordination Deficits

Livia Carrascal et al. Int J Mol Sci. .

Abstract

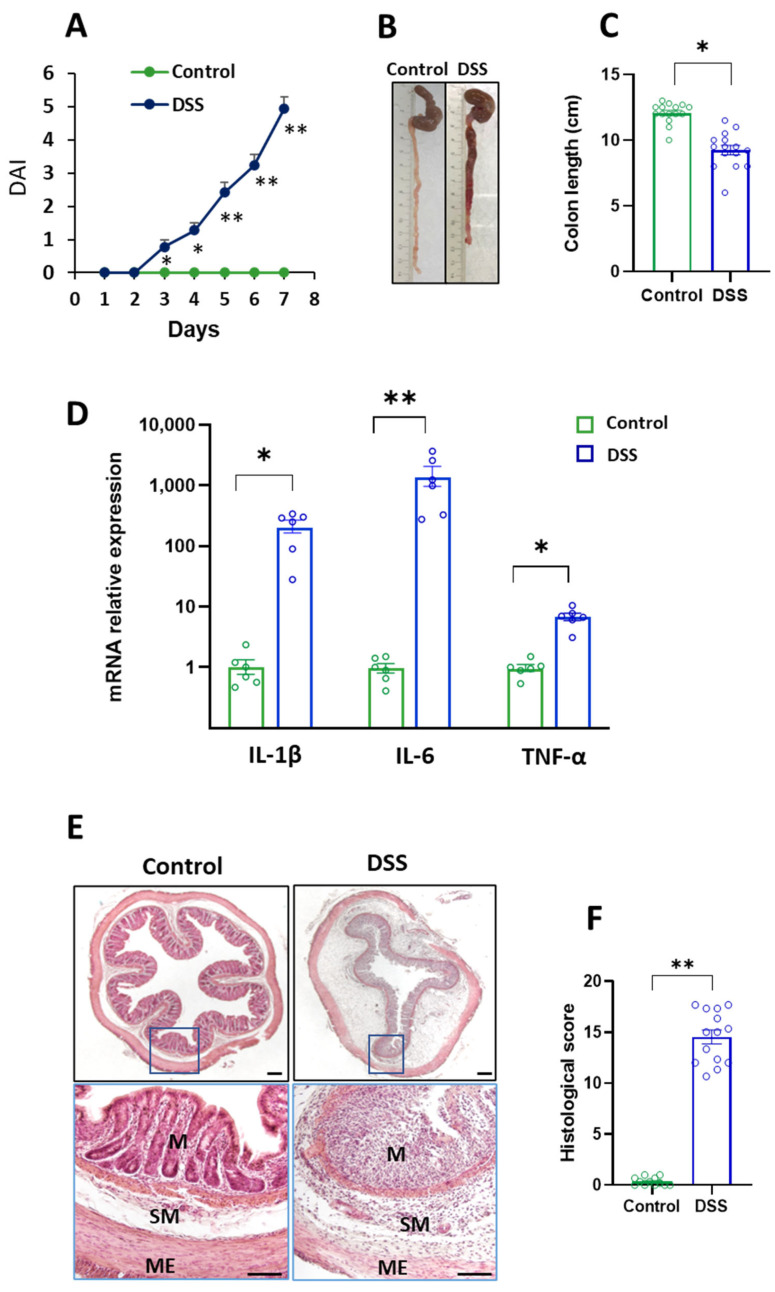
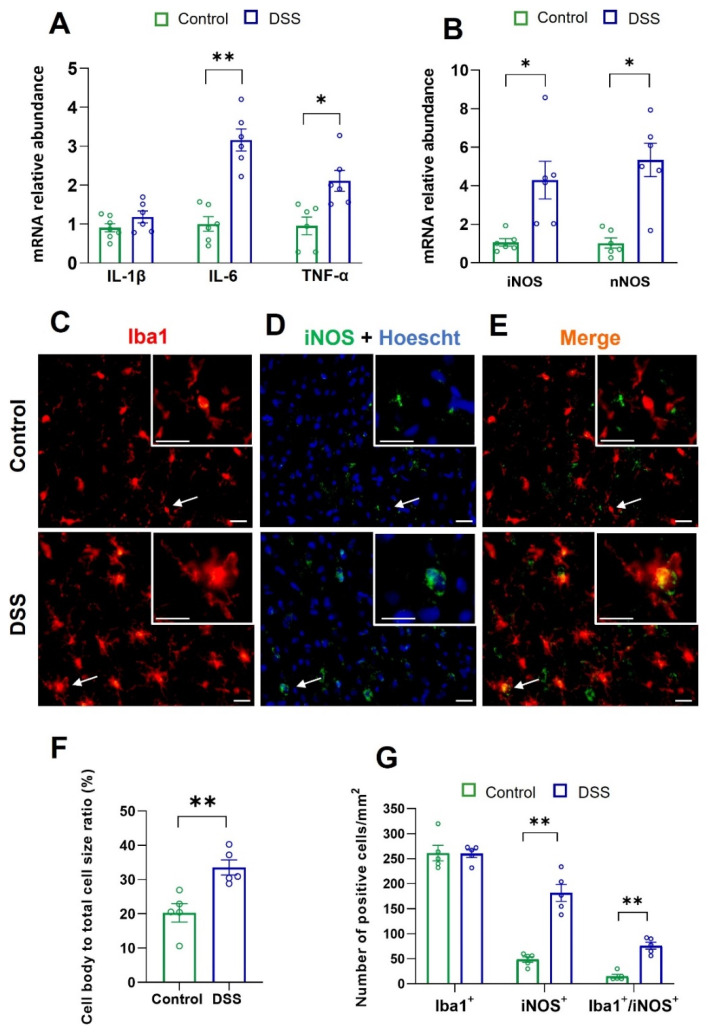
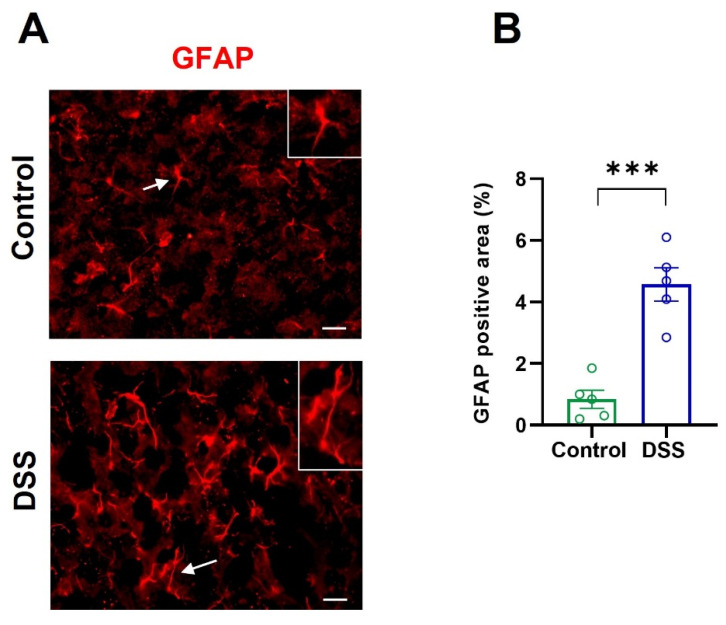
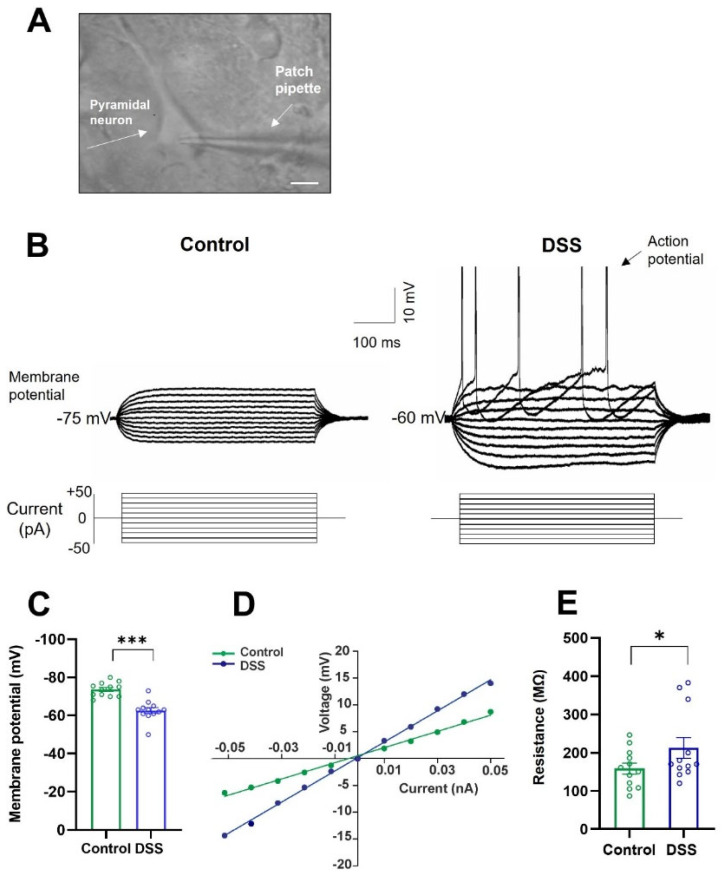
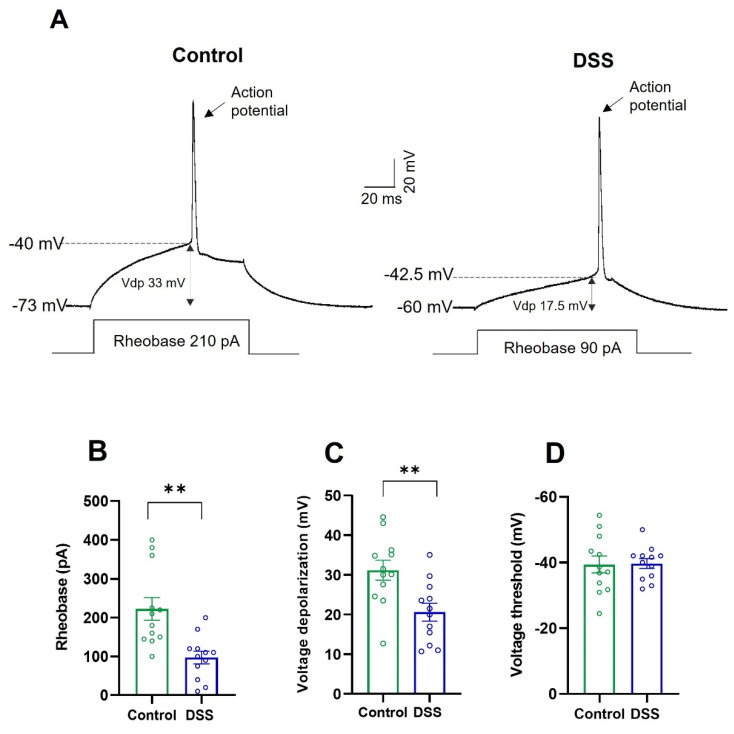
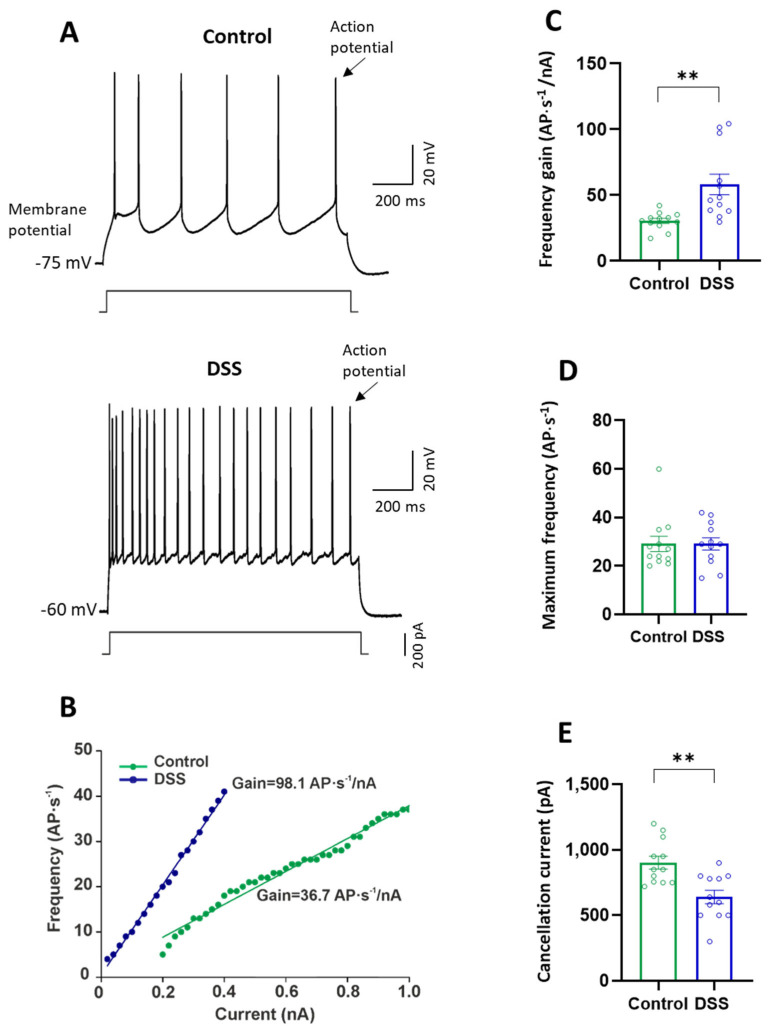
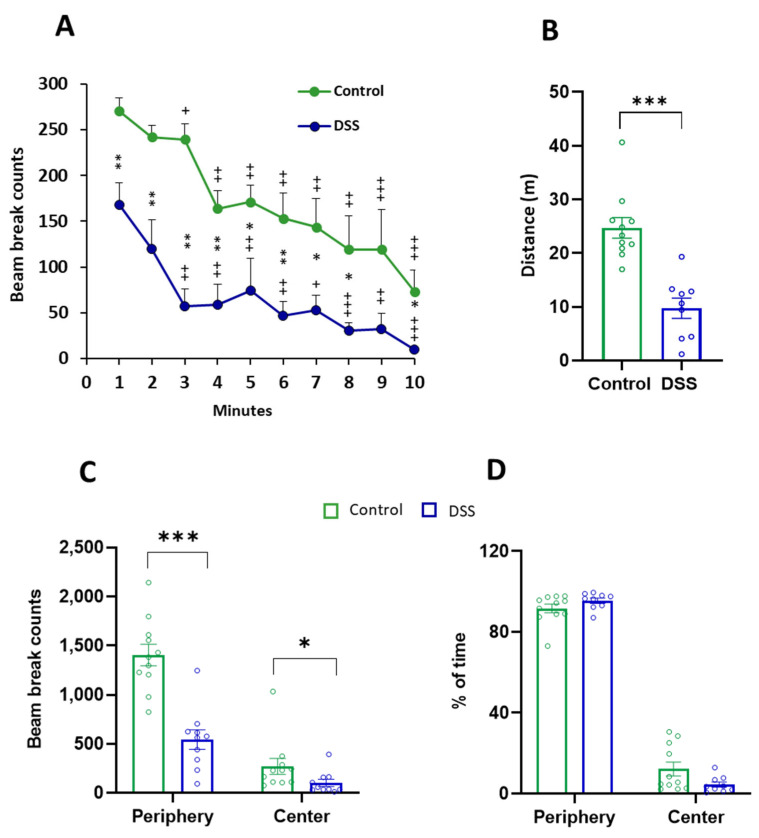
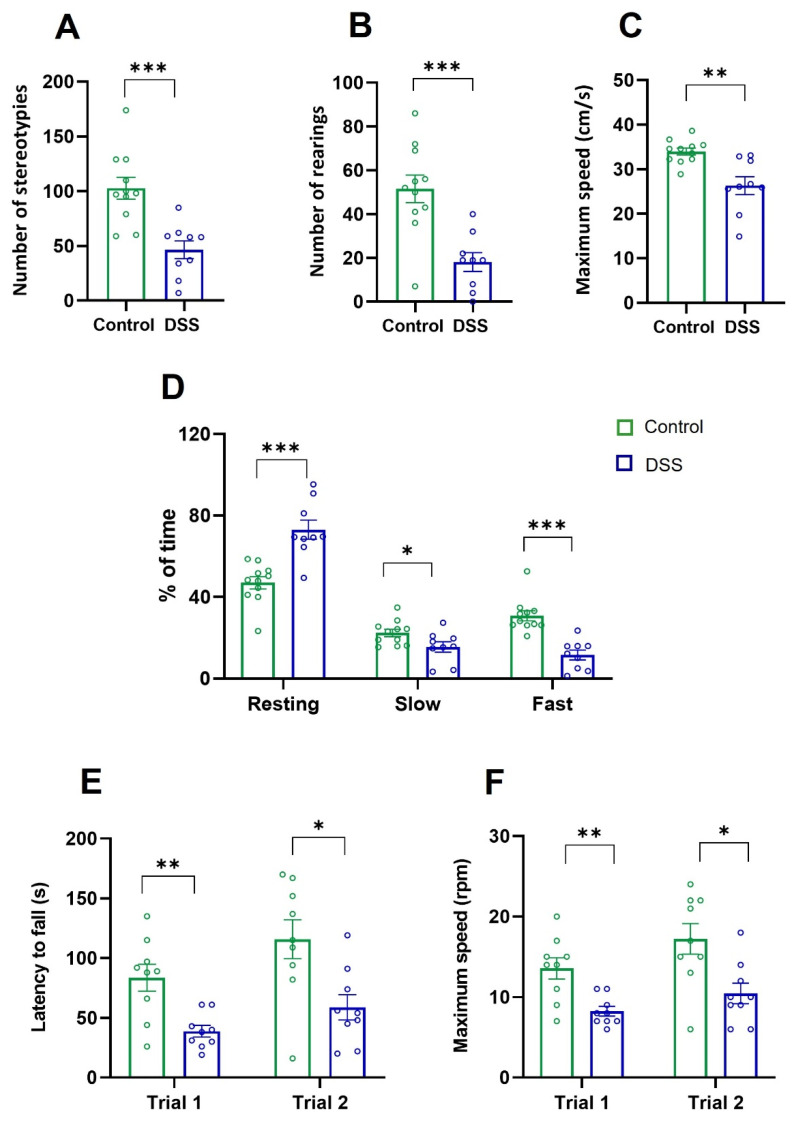
Neuroinflammation underlies neurodegenerative diseases. Herein, we test whether acute colon inflammation activates microglia and astrocytes, induces neuroinflammation, disturbs neuron intrinsic electrical properties in the primary motor cortex, and alters motor behaviors. We used a rat model of acute colon inflammation induced by dextran sulfate sodium. Inflammatory mediators and microglial activation were assessed in the primary motor cortex by PCR and immunofluorescence assays. Electrophysiological properties of the motor cortex neurons were determined by whole-cell patch-clamp recordings. Motor behaviors were examined using open-field and rotarod tests. We show that the primary motor cortex of rats with acute colon inflammation exhibited microglial and astrocyte activation and increased mRNA abundance of interleukin-6, tumor necrosis factor-alpha, and both inducible and neuronal nitric oxide synthases. These changes were accompanied by a reduction in resting membrane potential and rheobase and increased input resistance and action potential frequency, indicating motor neuron hyperexcitability. In addition, locomotion and motor coordination were impaired. In conclusion, acute colon inflammation induces motor cortex microglial and astrocyte activation and inflammation, which led to neurons' hyperexcitability and reduced motor coordination performance. The described disturbances resembled some of the early features found in amyotrophic lateral sclerosis patients and animal models, suggesting that colon inflammation might be a risk factor for developing this disease.

Keywords: colon inflammation; hyperexcitability; microglial and astrocyte activation; motor coordination; motor neurons; neurodegeneration; neuroinflammation.


Conflict of interest statement

The authors declare no conflict of interest.

Figures

Figure 1
Figure 1
Evaluation of the DSS-induced acute colitis in rats. Control (untreated) and DSS-treated rats received either water or water containing 3% dextran sulphate sodium (DSS) for 7 days, respectively. (A) Disease activity index (DAI) assessed daily. (B) Representative macroscopic appearance of cecum and colon. (C) Colon length. (D) mRNA relative expression of pro-inflammatory cytokines in the distal colon. (E) Representative hematoxylin/eosin-stained sections of histological analysis. (F) Score of distal colon damage. M: mucosa, SM: submucosa, ME: muscularis externa. Scale bar represents 200 μm. Data are means ± SEM (n = 8–15 animals per group). Student’s t-test: * p < 0.05 and ** p < 0.01, DSS-treated rats vs. controls.
Figure 2
Figure 2
Neuroinflammation and microglial activation in the motor cortex of control and DSS-treated rats. mRNA relative expression of (A) pro-inflammatory cytokines and (B) iNOS and nNOS in the primary motor cortex (n = 6–8 animals per group). Immunolocalization of (C) Iba1 (red) and (D) iNOS (green) performed in brain sections containing the primary motor cortex. Nuclei were visualized with Hoechst (blue). (E) Colocalization of Iba1-iNOS (yellow-orange color). The cells pointed to by arrows are shown in higher magnification. Scale bar represents 20 µm. (F) Quantification of microglia cell body size (pixels) expressed as the cell body to cell size ratio (percentage) in the primary motor cortex. (G) Quantification of the number of either Iba1, iNOS, or Iba1-iNOS positive cells. For (F,G), the number of animals was 5 for each group and the number of cells analyzed in each animal was 200 (n = 5 animals per group). Data are means ± SEM. Student’s t-test: * p < 0.05 and ** p < 0.01, DSS-treated rats vs. controls.
Figure 3
Figure 3
Astrocyte activation in the motor cortex of control and DSS-treated rats. (A) Immunofluorescence of GFAP was performed in brain sections containing primary motor cortex. The cells pointed to by arrows are shown in higher magnification. Scale bar represents 20 µm. (B) Quantification of GFAP immunostaining area expressed as percentage of the analyzed area in the primary motor cortex. The number of animals was 5 for each group and the number of measurements in each animal was 30–50 (n = 5 animals per group). Data are means ± SEM. Student’s t-test: *** p < 0.001, DSS-treated rats vs. controls.
Figure 4
Figure 4
Membrane input resistance and resting membrane potential of pyramidal neurons from the motor cortex of control and DSS-treated rats. (A) Representative pyramidal neuron from the motor cortex, patch-clamped. Scale bar represents 20 µm. (B) Membrane voltage responses to depolarizing and hyperpolarizing current steps (500 ms, 10 pA) in a representative pyramidal neuron of control and DSS-treated rats. (C) Resting membrane potential (mV). (D) Relationship between values of current and voltage represented in (B). (E) Membrane input resistance (MΩ). Data are means ± SEM. The number of animals was 4 for each experimental condition and the number of neurons recorded from each animal was 2–4 (n = 12 cells recorded in total for each group). Student’s t-test: * p < 0.05 and *** p < 0.001, DSS-treated rats vs. controls.
Figure 5
Figure 5
Rheobase and depolarization voltage of pyramidal neurons from the motor cortex of control and DSS-treated rats. (A) Membrane voltage responses to rheobase (minimum current required to evoke action potential) in a representative pyramidal neuron of control and DSS-treated rats. Vdp: Depolarization voltage. (B) Rheobase (pA). (C) Depolarization voltage (mV). (D) Voltage threshold (mV). Data are means ± SEM. The number of animals was 4 for each experimental condition and the number of neurons recorded from each animal was 2–4 (n = 12 cells recorded in total for each group). Student’s t-test: ** p < 0.01, DSS-treated rats vs. controls.
Figure 6
Figure 6
Firing properties of pyramidal neurons from the motor cortex of control and DSS-treated rats. (A) Membrane potential responses to long-lasting depolarizing current pulses (200 pA) in a representative neuron from control and DSS-treated rats. (B) Relationship between current intensity and frequency of action potentials (AP) represented in (A). (C) Frequency gain (AP·s−1/nA). (D) Maximum frequency (AP·s−1). (E) Cancellation current (pA). Data are means ± SEM. The number of animals was 4 for each experimental condition and the number of neurons recorded from each animal was 2–4 (n = 12 cells recorded in total for each group). Student’s t-test: ** p <0.01, DSS-treated rats vs. controls.
Figure 7
Figure 7
Horizontal motor activity in control and DSS-treated rats. Activity was measured in a 10 min period. (A) Horizontal activity per minute measured by the number of infrared beams broken by the rat (beam break counts). Friedman test showed that both groups were affected by the time factor (Control p < 0.0001; DSS-treated rats p < 0.0001). The Wilcoxon test was used for comparisons between different minutes in the same group: + p < 0.05, ++ p < 0.01, +++ p < 0.001, first minute vs. last minutes. (B) Total horizontal activity as distance travelled (m). (C) Locomotion in the center and in the periphery of the arena as beam break counts. (D) Percentage of time spent within the center and within the periphery of the arena. Data are means ± SEM (n = 10 animals per group). Student’s t-test or Mann–Whitney U test for comparisons between independent groups: * p < 0.05, ** p < 0.01, *** p < 0.001, DSS-treated rats vs. controls.
Figure 8
Figure 8
Vertical motor activity, locomotion speed, and rotarod test in control and DSS-treated rats. (A) Stereotyped movements. (B) Total vertical activity as number of rearings. (C) Maximum speed expressed as cm/s. (D) Percentage of time spent resting or performing either slow or fast movements. (E,F) Rotarod test: latency to fall (s) and maximum speed as rotations per minute (rpm). No significant intragroup differences were found between trials. Data are means ± SEM (n = 10 animals per group). Student’s t-test for comparisons between independent groups: * p < 0.05, ** p < 0.01, *** p < 0.001, DSS-treated rats vs. controls.

References

    1. Glass C.K., Saijo K., Winner B., Marchetto M.C., Gage F.H. Mechanisms Underlying Inflammation in Neurodegeneration. Cell. 2010;140:918–934. doi: 10.1016/j.cell.2010.02.016. - DOI - PMC - PubMed
    1. Butovsky O., Weiner H.L. Microglial signatures and their role in health and disease. Nat. Rev. Neurosci. 2018;19:622–635. doi: 10.1038/s41583-018-0057-5. - DOI - PMC - PubMed
    1. Tricoire L., Vitalis T. Neuronal nitric oxide synthase expressing neurons: A journey from birth to neuronal circuits. Front. Neural Circuits. 2012;6:82. doi: 10.3389/fncir.2012.00082. - DOI - PMC - PubMed
    1. Kempuraj D., Thangavel R., Selvakumar G.P., Zaheer S., Ahmed M.E., Raikwar S.P., Zahoor H., Saeed D., Natteru P.A., Iyer S., et al. Brain and peripheral atypical inflammatory mediators potentiate neuroinflammation and neurodegeneration. Front. Cell. Neurosci. 2017;11:216. doi: 10.3389/fncel.2017.00216. - DOI - PMC - PubMed
    1. Neuendorf R., Harding A., Stello N., Hanes D., Wahbeh H. Depression and anxiety in patients with Inflammatory Bowel Disease: A systematic review. J. Psychosom. Res. 2016;87:70–80. doi: 10.1016/j.jpsychores.2016.06.001. - DOI - PubMed