. 2022 May 11;23(10):5367.
doi: 10.3390/ijms23105367.

Cannabidiol Enhances Microglial Beta-Amyloid Peptide Phagocytosis and Clearance via Vanilloid Family Type 2 Channel Activation

Affiliations

Cannabidiol Enhances Microglial Beta-Amyloid Peptide Phagocytosis and Clearance via Vanilloid Family Type 2 Channel Activation

Shaobin Yang et al. Int J Mol Sci. .

Abstract

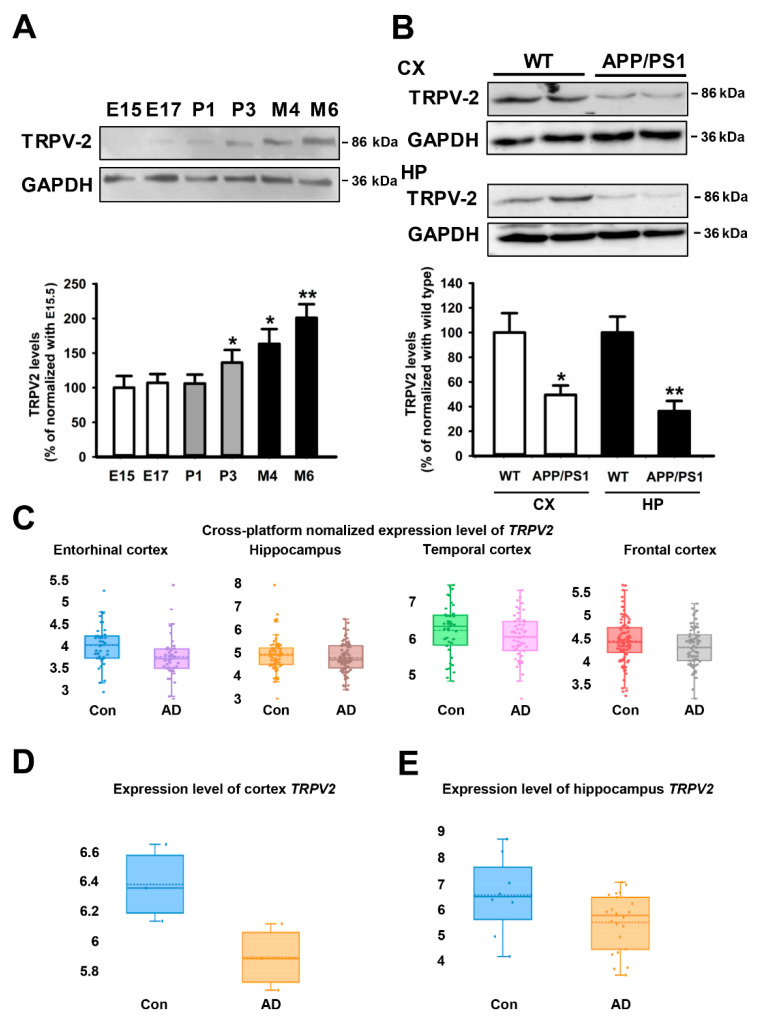
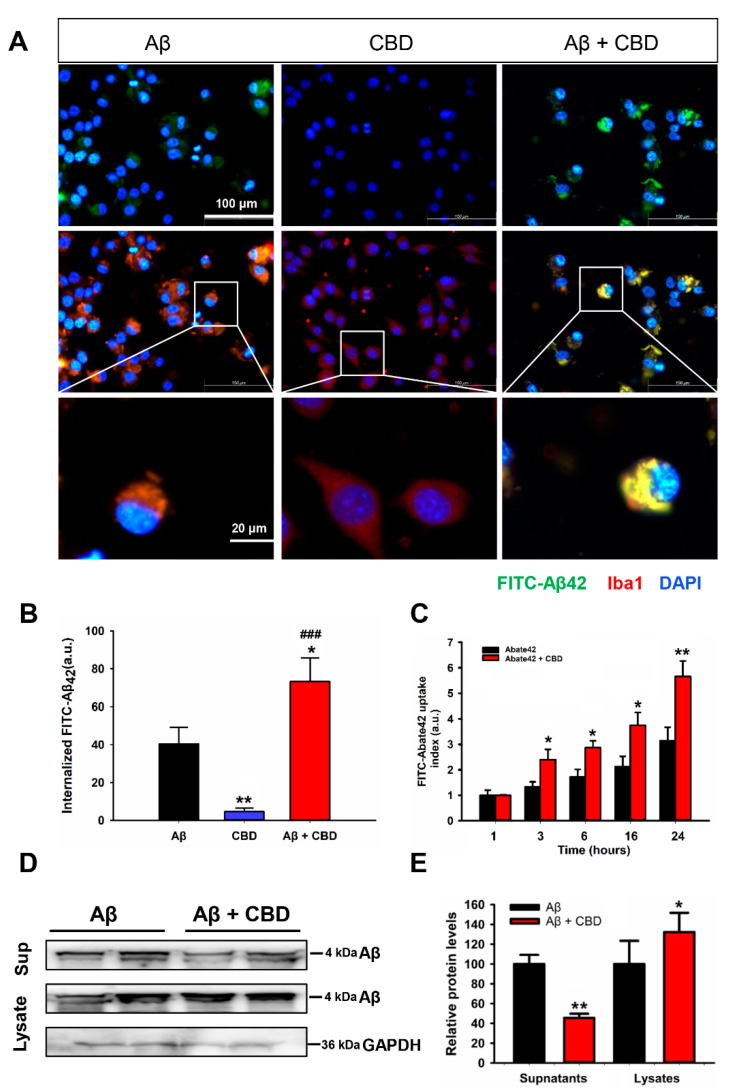
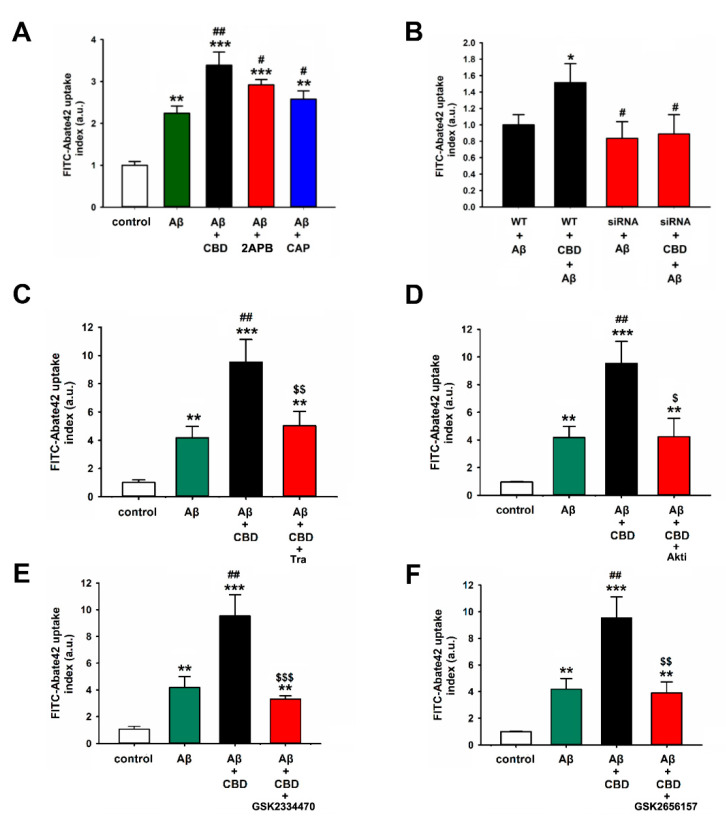
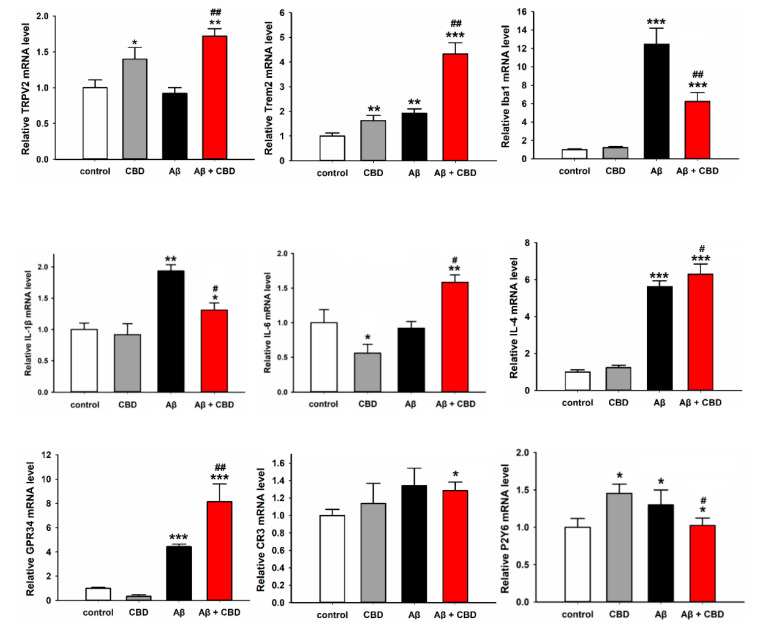
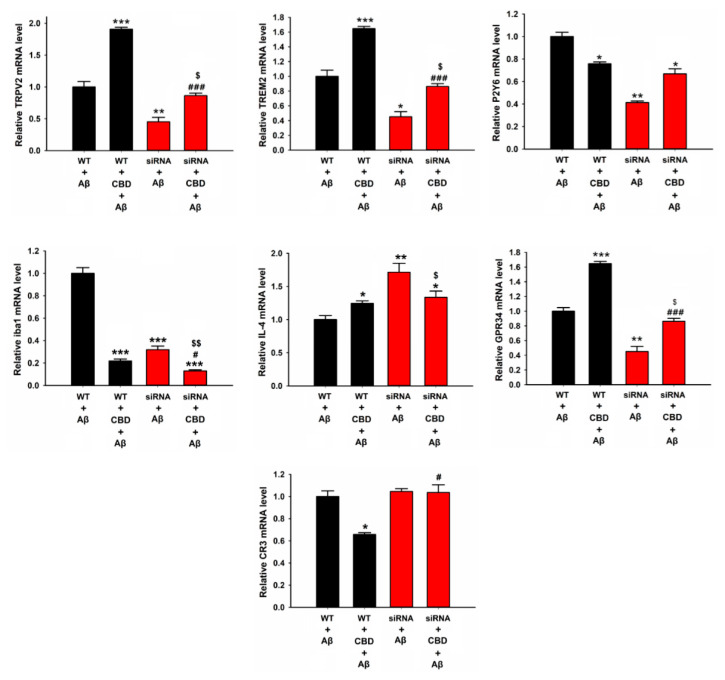
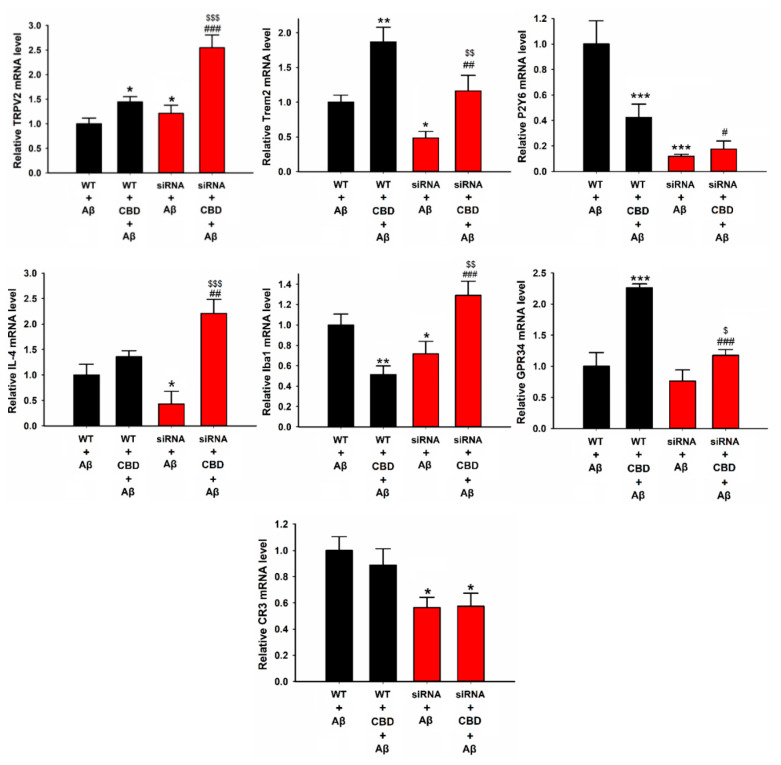
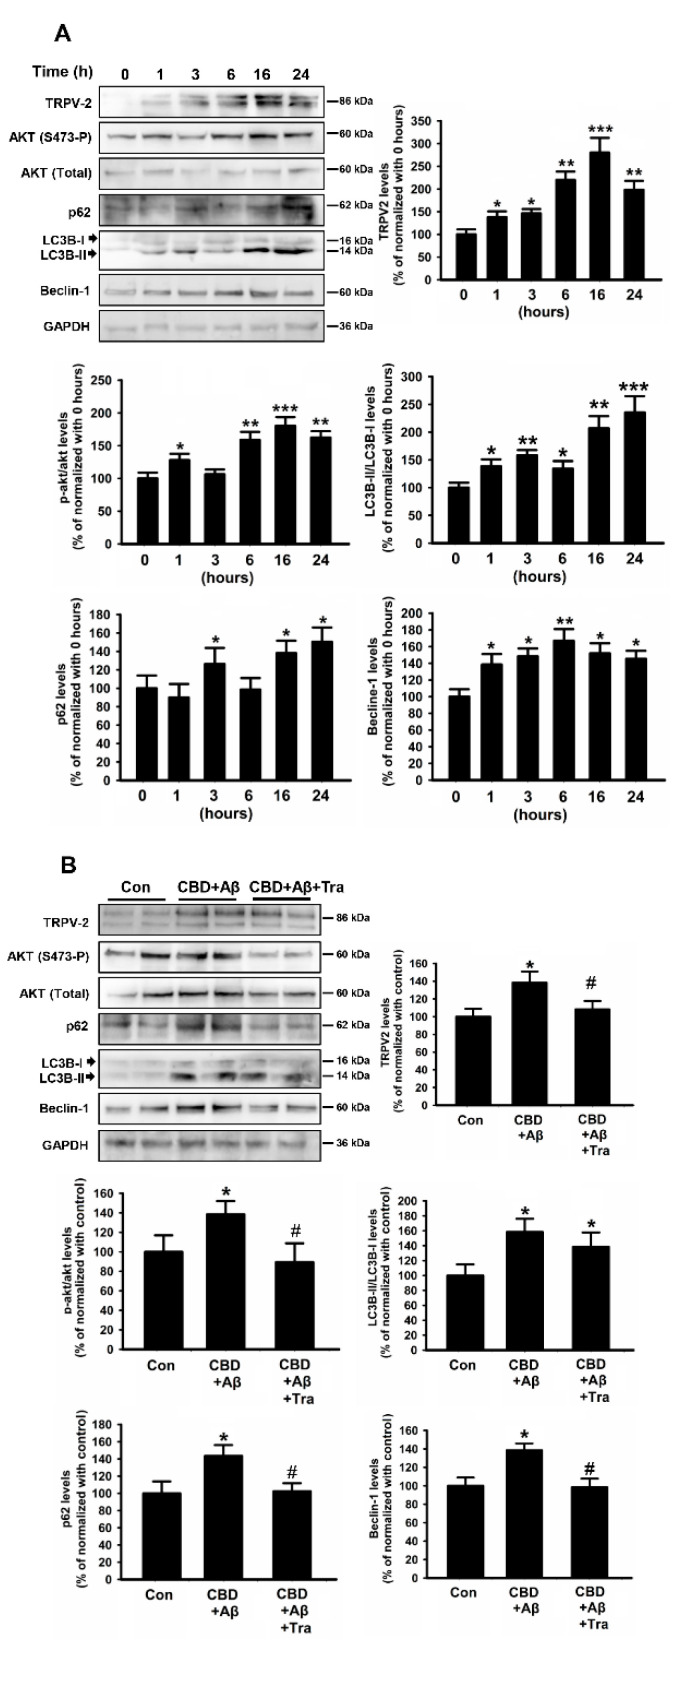
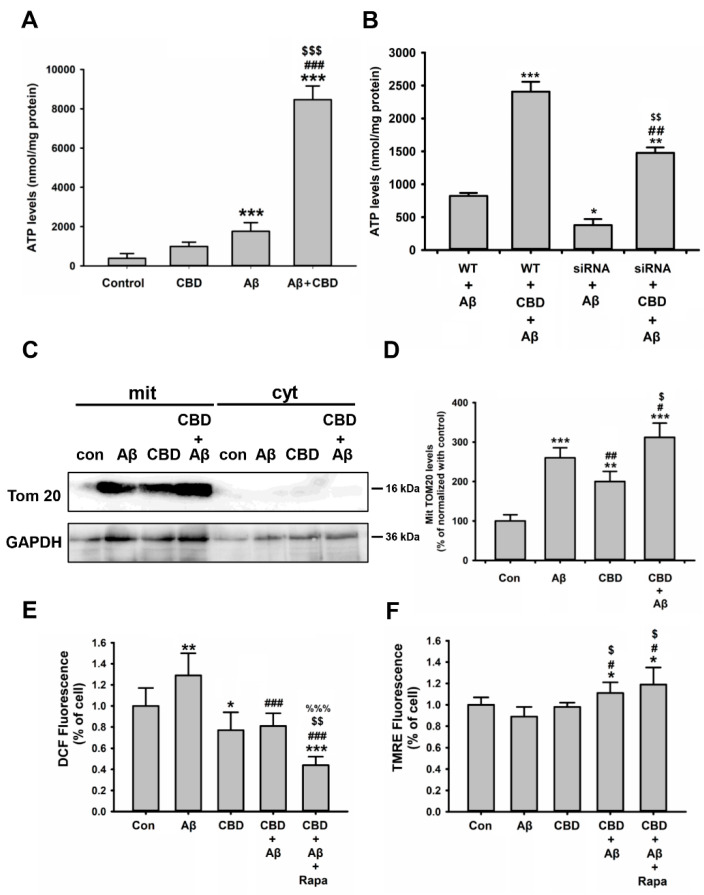
Alzheimer's disease (AD) is associated with the accumulation and aggregation of amyloid in the brain. The cation channel TRPV2 may mediate the pathological changes in mild cognitive impairment. A high-affinity agonist of TRPV2 named cannabidiol is one of the candidate drugs for AD. However, the molecular mechanism of cannabidiol via TRPV2 in AD remains unknown. The present study investigated whether cannabidiol enhances the phagocytosis and clearance of microglial Aβ via the TRPV2 channel. We used a human dataset, mouse primary neuron and microglia cultures, and AD model mice to evaluate TRPV2 expression and the ability of microglial amyloid-β phagocytosis in vivo and in vitro. The results revealed that TRPV2 expression was reduced in the cortex and hippocampus of AD model mice and AD patients. Cannabidiol enhanced microglial amyloid-β phagocytosis through TRPV2 activation, which increased the mRNA expression of the phagocytosis-related receptors, but knockdown of TRPV2 or Trem2 rescued the expression. TRPV2-mediated effects were also dependent on PDK1/Akt signaling, a pathway in which autophagy was indispensable. Furthermore, cannabidiol treatment successfully attenuated neuroinflammation while simultaneously improving mitochondrial function and ATP production via TRPV2 activation. Therefore, TRPV2 is proposed as a potential therapeutic target in AD, while CBD is a promising drug candidate for AD.

Keywords: Aβ1-42; TRPV2; autophagy; cannabidiol; phagocytosis.


Conflict of interest statement

The authors declare no conflict of interest.

Figures

Figure 1
Figure 1
TRPV2 levels were decreased in both AD patients and APP/PS1 mice. (A) The TRPV2 levels were measured in the brain whole-protein extracts from mice at the indicated age (E is embryos, P is days and M is months). The data are represented as the mean ± SEM (n = 4 mice/group). * p < 0.05, and ** p < 0.01 are compared to the E15.5 by the Tukey’s test. (B) Cortex and hippocampus protein extracts were obtained at 6 months of age from wild-type (WT) and two transgenic AD mice models (APP/PS1) who were subjected to the TRPV2 antibody. The data are represented as the mean ± SEM for four different mice per genotype. * p < 0.05, and ** p < 0.01 compared to controls as obtained by the Student’s t-test. (C) Transcriptional expression levels of TRPV2 in entorhinal, temporal, and frontal cortex and hippocampus tissues of the patients with AD in the cross-platform database (entorhinal cortex: GSE26927, GSE26972, GSE48350, GSE5281; hippocampus: GSE28146, GSE29378, GSE36980, GSE48350, GSE5281; temporal cortex: GSE29652, GSE36980, GSE37263, GSE5281; frontal cortex: GSE12685, GSE36980, GSE48350, GSE5281, GSE53890, GSE66333; control, n = 19; AD patient, n = 19). (D) Transcriptional downregulation of TRPV2 in the entorhinal cortex of the tissue samples from patients with AD in the GSE26972 database (control, n = 19; AD patient, n = 19). (E) Transcriptional downregulation of TRPV2 in the hippocampus of the tissue samples from patients with AD in the GSE28146 database (control, n = 19; AD patient, n = 19).
Figure 2
Figure 2
CBD enhanced microglial Aβ phagocytosis via the TRPV2 channels. (A) Primary microglia cells were plated at a density of 5 × 10⁴ in poly-D-lysine-coated wells of 24-well plates containing 10% FBS DMEM medium. After 24 h of treatment with CBD (5 μM), FITC-Aβ42 (1 μg/mL) was added to the medium. Immunofluorescence analysis of the microglial phagocytosis of FITC-Aβ42 was performed after allowing uptake for 4 h in microglia cells. (B) Quantification of the internalized FITC-Aβ42 using ImageJ software (n = 36 to 42 per group). a.u., arbitrary units from 3/4 individual mice. (C) FITC-Aβ42 uptake index in the presence or absence of CBD after uptake for the indicated time in microglia cells, calculated based on the phagocytosis assay. (D) Microglial Aβ42 uptake was analyzed using Western blotting after 4 h of incubation with Aβ42 oligomer in the presence or absence of CBD. (E) Quantification of the protein levels using Image J software (n = 4 per group). * p < 0.05 and ** p < 0.01 are compared with the Aβ by the Student’s t-test; ### p < 0.001 between Aβ and CBD + Aβ by Student’s t-test. The scale bars = 20 μm.
Figure 3
Figure 3
The TRPV2-mediated phagocytosis in microglia cells was attenuated by inhibiting PDK, Akt, or PERK. FITC-Aβ42 uptake index in BV2 microglia cells was analyzed using the phagocytosis assay. (A) The presence of CBD (5 μM), 2APB (250 μM), and CAP (capsaicin: 2 μM) after 24 h (n = 6). ** p < 0.01 and *** p < 0.001 are compared with the control by Tukey’s test, and # p < 0.05 and ## p < 0.01 are compared with Aβ by Tukey’s test. (B) BV2 microglia with knocked-down TRPV2 treated with or without CBD after 24 h (n = 4). * p < 0.05 is between Aβ and CBD + Aβ by Student’s t-test; # p < 0.05 is between Aβ and CBD + Aβ upon siRNA by Student’s t-test. (CF) BV2 microglia preadded with Tra (tranilast, 75 μM), akti (Akt inhibitor, 10 μM), PDK1 inhibitor (GSK2334470, 1 μM), and PERK inhibitor (GSK2656157, 1 μM) and treated with or without CBD after 24 h (n = 5). ** p < 0.01 and *** p < 0.001 are compared with the control by Tukey’s test; ## p < 0.01 is between Aβ and CBD + Aβ by Student’s t-test; $ p < 0.05, $$ p < 0.01, and $$$ p < 0.001 are between CBD + Aβ and CBD + Aβ upon inhibitors by Student’s t-test.
Figure 4
Figure 4
Relative mRNA levels of microglial phagocytic receptors and inflammation factors in the microglia cells treated with or without CBD (5 μM). Primary microglial cells were treated with or without CBD after 12 h, and the mRNA levels were determined through qPCR. The data are represented as the mean ± SEM (n = 6). * p < 0.05, ** p < 0.01, and *** p < 0.001 are compared with the control by Tukey’s test; # p < 0.05 and ## p < 0.01 are between Aβ and CBD + Aβ by Student’s t-test.
Figure 5
Figure 5
Relative mRNA levels of microglial phagocytic receptors and inflammation factors in microglia cells after knockdown of TRPV2. BV2 microglia were treated with or without CBD (5 μM) after 12 h, and mRNA levels were determined by qPCR. The data are represented as the mean ± SEM (n = 4). * p < 0.05, ** p < 0.01, and *** p < 0.001 are compared with wild type treated with Aβ by Tukey’s test; # p < 0.05 and ### p < 0.001 mean CBD + Aβ with or without siRNA by Student’s t-test. $ p < 0.05 and $$ p < 0.01 mean CBD knockdown of TRPV2 with or without CBD by Student’s t-test.
Figure 6
Figure 6
Relative mRNA levels of microglial phagocytic receptors and inflammation factors in microglia cells after knockdown of Trem2. BV2 microglia were treated with or without CBD (5 μM) after 12 h, and mRNA levels were determined by qPCR. The data are represented as the mean ± SEM (n = 4). * p < 0.05, ** p < 0.01, and *** p < 0.001 are compared with wild type treated with Aβ (1 μg/mL) by Tukey’s test; # p < 0.05, ## p < 0.01, and ### p < 0.001 mean CBD + Aβ with or without siRNA by Student’s t-test. $ p < 0.05, $$ p < 0.01, and $$$ p < 0.001 mean CBD knockdown of Trem2 with or without CBD by Student’s t-test.
Figure 7
Figure 7
CBD induced autophagy in microglial cells via TRPV2 by promoting the upregulation of Akt. (A) BV2 microglia cells incubated with Aβ42 were analyzed using Western blot in the presence of CBD (5 μM) for the indicated time. (B) BV2 microglial cells were pretreated with Tra (tranilast 75 μM) for 1 h and then treated with CBD for 24 h. Band densitometry quantification of TRPV2. The autophagy flux expression was normalized to GAPDH. The phosphorylation of Akt was normalized to the total Akt level (n = 4 per group). * p < 0.05, ** p < 0.01, and *** p < 0.001 are compared with the control by Tukey’s test. # p < 0.05 mean CBD + Aβ with or without siRNA by Student’s t-test.
Figure 8
Figure 8
CBD improved energy metabolism via mitochondrial functions in microglia cells. (A) Total ATP production in BV2 microglia under different conditions as indicated. Aβ (1 μg/mL) and/or CBD (5 μM) were added to the cells for 24 h prior to measurement (n = 6 from three independent experiments). The data are represented as the mean ± SEM. * p < 0.05 and *** p < 0.001 are compared with the controls by Tukey’s test; ### p < 0.001 means CBD + Aβ and CBD by Student’s t-test; $$ p < 0.01 and $$$ p < 0.001 is CBD with or without Aβ by Student’s t-test. (B) Total ATP production in WT and TRPV2 knockdown microglia cells treated with or without CBD for 24 h (n = 6 from three independent experiments). * p < 0.05, ** p < 0.01, and *** p < 0.001 compared with the controls by Tukey’s test; ## p < 0.01 is between Aβ and CBD + Aβ by Student’s t-test; $$ p < 0.01 is between Aβ and CBD + Aβ upon siRNA by Student’s t-test. (C) BV2 microglial cells were analyzed for Tom 20 expression in mit (mitochondria) and cyt (cytoplasm) by performing immunoblot analysis under different conditions as indicated using the mitochondrial extraction kit. (D) Band densitometry quantification of TRPV2 was normalized to GAPDH (n = 4 per group). ** p < 0.01 and *** p < 0.001 are compared with control by Tukey’s test; # p < 0.05 and ## p < 0.01 are compared with Aβ by Tukey’s test; $ p < 0.05 is between Aβ and CBD + Aβ by Student’s t-test. (E) ROS production and (F) MMP of BV2 microglial cells under different conditions as indicated. After 1 h of treatment with Rapa (rapamycin, 10 μM), Aβ and/or CBD were added to the cells for 24 h prior to measurement (n = 12 from three independent experiments). The fluorescence intensities of DCF and TMRE were quantified and expressed as a percentage relative to the controls. The data are represented as the mean ± SEM. * p < 0.05, ** p < 0.01, and *** p < 0.001 are compared with the controls by Tukey’s test; ### p < 0.001 are compared with Aβ by Tukey’s test; $$ p < 0.01 is CBD with or without Aβ and Rapa by Student’s t-test; %%% p < 0.001 is Aβ with or without CBD and Rapa by Student’s t-test.

Similar articles

Cited by

References

    1. Graeber M.B., Kosel S., Egensperger R., Banati R.B., Muller U., Bise K., Hoff P., Moller H.J., Fujisawa K., Mehraein P. Rediscovery of the case described by Alois Alzheimer in 1911: Historical, histological and molecular genetic analysis. Neurogenetics. 1997;1:73–80. doi: 10.1007/s100480050011. - DOI - PubMed
    1. Verkhratsky A., Zorec R., Rodriguez J.J., Parpura V. Astroglia dynamics in ageing and Alzheimer’s disease. Curr. Opin. Pharmacol. 2016;26:74–79. doi: 10.1016/j.coph.2015.09.011. - DOI - PubMed
    1. GBD 2019 Dementia Forecasting Collaborators Estimation of the global prevalence of dementia in 2019 and forecasted prevalence in 2050: An analysis for the Global Burden of Disease Study 2019. Lancet Public Health. 2022;7:105–125. doi: 10.1016/S2468-2667(21)00249-8. - DOI - PMC - PubMed
    1. Querfurth H.W., LaFerla F.M. Alzheimer‘s disease. N. Engl. J. Med. 2010;362:329–344. doi: 10.1056/NEJMra0909142. - DOI - PubMed
    1. Scheltens P., Blennow K., Breteler M.M.B., Strooper B., Frisoni G.B., Salloway S., Filer W.M.V. Alzheimer‘s disease. Lancet. 2016;388:505–517. doi: 10.1016/S0140-6736(15)01124-1. - DOI - PubMed

MeSH terms