. 2022 Apr 30;12(5):494.
doi: 10.3390/membranes12050494.

Understanding the Dynamics of the Transient and Permanent Opening Events of the Mitochondrial Permeability Transition Pore with a Novel Stochastic Model

Affiliations

Understanding the Dynamics of the Transient and Permanent Opening Events of the Mitochondrial Permeability Transition Pore with a Novel Stochastic Model

Keertana Yalamanchili et al. Membranes (Basel). .

Abstract

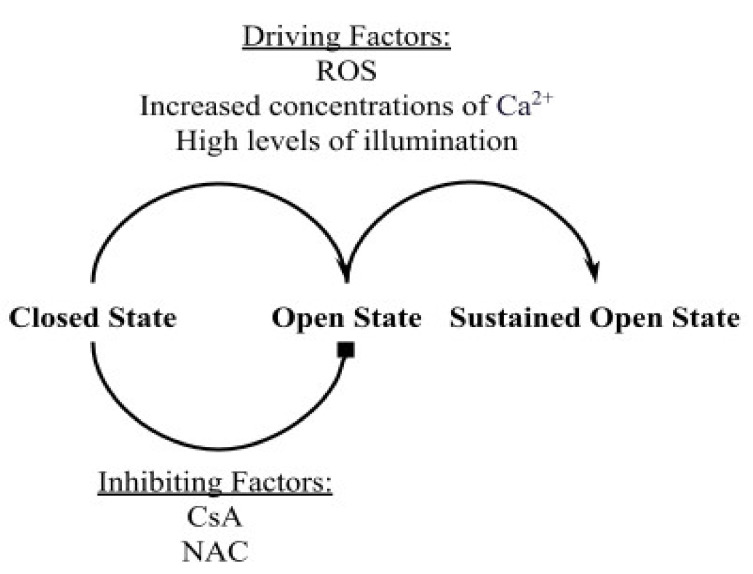
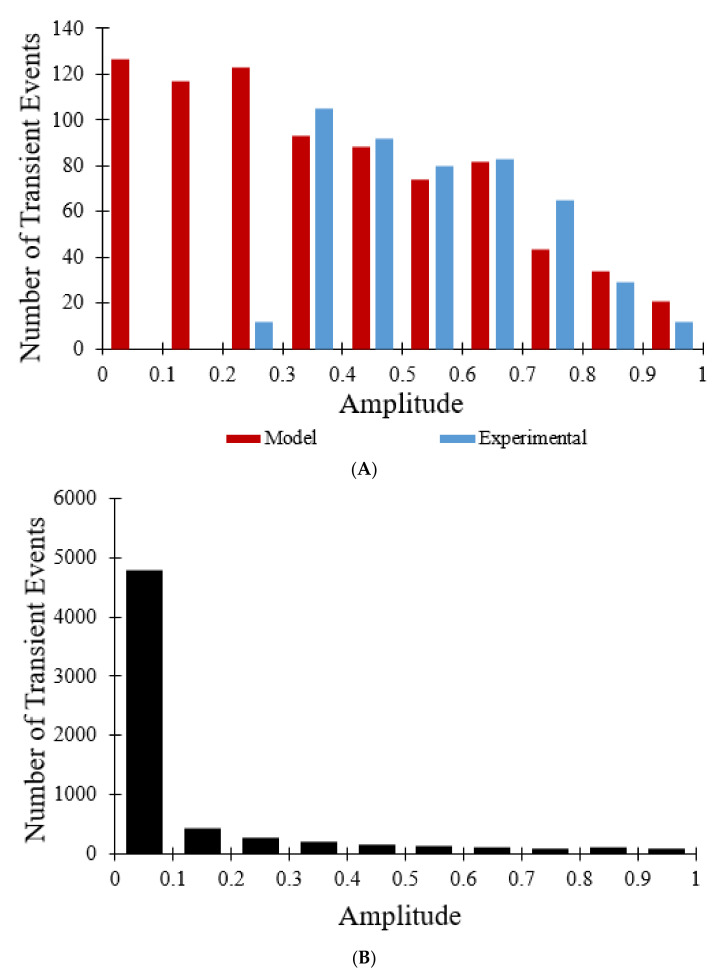
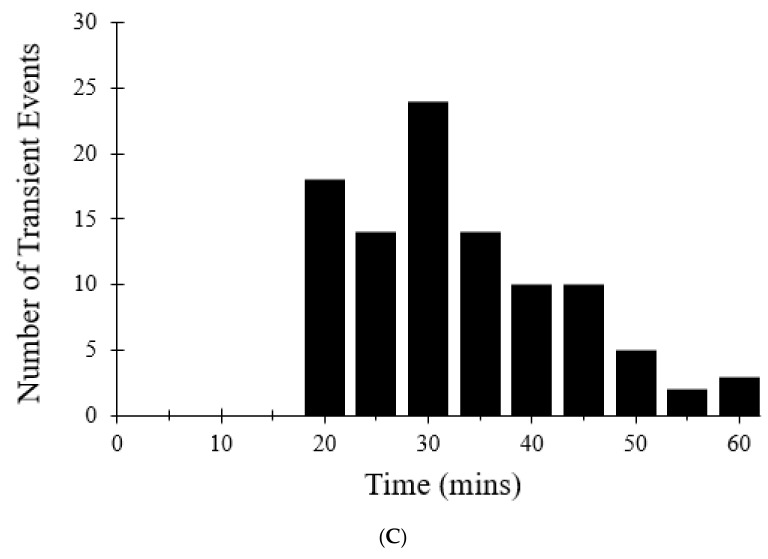
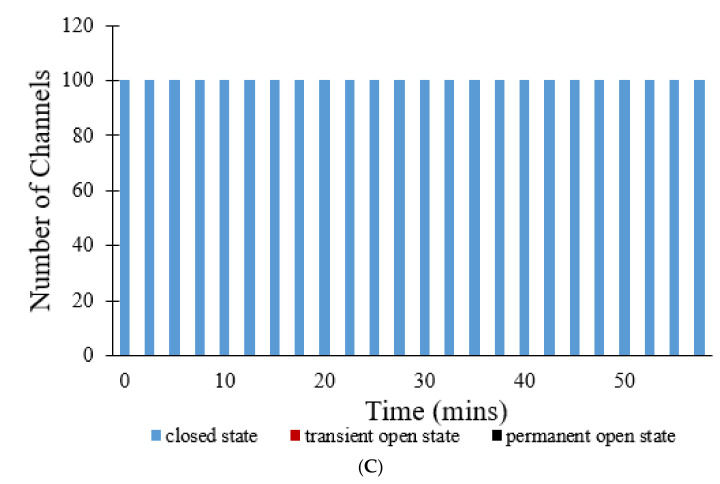
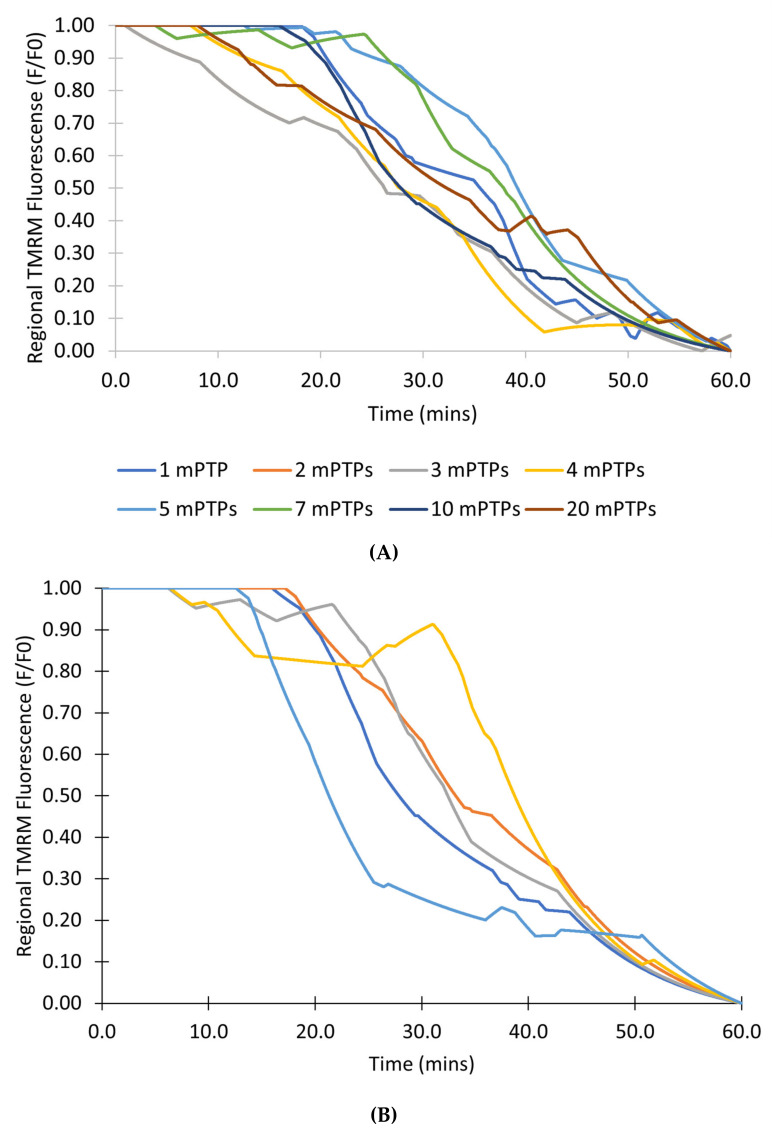
The mitochondrial permeability transition pore (mPTP) is a non-selective pore in the inner mitochondrial membrane (IMM) which causes depolarization when it opens under conditions of oxidative stress and high concentrations of Ca2+. In this study, a stochastic computational model was developed to better understand the dynamics of mPTP opening and closing associated with elevated reactive oxygen species (ROS) in cardiomyocytes. The data modeled are from "photon stress" experiments in which the fluorescent dye TMRM (tetramethylrhodamine methyl ester) is both the source of ROS (induced by laser light) and sensor of the electrical potential difference across the IMM. Monte Carlo methods were applied to describe opening and closing of the pore along with the Hill Equation to account for the effect of ROS levels on the transition probabilities. The amplitude distribution of transient mPTP opening events, the number of transient mPTP opening events per minute in a cell, the time it takes for recovery after transient depolarizations in the mitochondria, and the change in TMRM fluorescence during the transition from transient to permanent mPTP opening events were analyzed. The model suggests that mPTP transient open times have an exponential distribution that are reflected in TMRM fluorescence. A second multiple pore model in which individual channels have no permanent open state suggests that 5-10 mPTP per mitochondria would be needed for sustained mitochondrial depolarization at elevated ROS with at least 1 mPTP in the transient open state.

Keywords: Monte Carlo method; TMRM; computational model; depolarization; heart; mPTP; mitochondria; reactive oxygen species (ROS).


Conflict of interest statement

The authors declare no conflict of interest.

Figures

Figure 1
Figure 1
A schematic drawing showing the different elements driving and inhibiting the opening of the mitochondrial permeability transition pore (mPTP). Cyclosporin A (CsA) inhibits pore opening by reducing its sensitivity to driving factors. N-acetyl cysteine (NAC) is a reactive oxygen species (ROS) scavenger that reduces the number of opening events by lowering cellular ROS levels.
Figure 2
Figure 2
Calcium dependence of mPTP opening based on the assumption that the normalized rate of mPTP opening is linearly proportional to the rate of experimentally measured volume change (blue) [9]. Model fit to data (red).
Figure 3
Figure 3
Schematic diagram showing the tiling of the number line for the Markov Chain Monte Carlo Simulation.
Figure 4
Figure 4
Average change in TMRM fluorescence (F/F0) over time for transient opening events. Experimental TMRM fluorescence for 478 transient opening events (blue) [7]. Model fit to data with 500 transient opening events (red). Mitochondrial membrane potential during an average transient opening event (gray—right axis) was assumed to exactly follow the timing and duration of an average transient opening event.
Figure 5
Figure 5
Amplitude distribution for transient opening events. (A) Experimental distribution of amplitudes of 478 transient opening events (blue) [7]. Model distribution of amplitudes of 800 transient opening events with a 10 s sampling rate fit to data (red). (B) Model distribution of amplitudes of 6334 transient opening events with a sampling rate less than 0.1 s.
Figure 6
Figure 6
Frequency of transient openings per cell. Number of experimental transient depolarizations per cell per minute at times indicated (blue) [7]. Number of modeled transient depolarizations per cell per minute fit to data (red). Change in ROS concentration during time course of modeling (black). The event frequency at each time point was based on 50 total events.
Figure 7
Figure 7
Frequency of transient openings per cell with the addition of CsA. Number of experimental events per cell per minute at times indicated (blue) [7]. Number of modeled events per minute per cell fit to data (red) with the addition of 10 mM CsA. The change in ROS concentration during time course of modeling (black). The event frequency at each time point was based on 50 total events.
Figure 8
Figure 8
Frequency of transient openings per cell with the addition of NAC. Number of experimental events per cell per minute at times indicated (blue) [7]. Number of modeled events per minute per cell fit to data (red) with the addition of 10 mM NAC. ROS concentration during time course of modeling is essentially flat (black). The event frequency at each time point was based on 50 total events.
Figure 9
Figure 9
Transition from transient to permanent opening events under increased intensity of laser irradiation (photon stress). (A) Simulated regional TMRM fluorescence over time during transition from transient to permanent opening events. ROS levels were increased to replicate the effects of increased photooxidation on ROS production. Data was collected from 6 regions of interest inside the cell. Mitochondrial membrane potential during the transition from transient to permanent opening events with increased photon stress. (B) Regional experimental TMRM fluorescence over time during transition from transient to permanent opening events [7]. (C) Number of transient opening events per cell per minute with increased photon stress. A simulation of 100 pores was used to collect data.
Figure 9
Figure 9
Transition from transient to permanent opening events under increased intensity of laser irradiation (photon stress). (A) Simulated regional TMRM fluorescence over time during transition from transient to permanent opening events. ROS levels were increased to replicate the effects of increased photooxidation on ROS production. Data was collected from 6 regions of interest inside the cell. Mitochondrial membrane potential during the transition from transient to permanent opening events with increased photon stress. (B) Regional experimental TMRM fluorescence over time during transition from transient to permanent opening events [7]. (C) Number of transient opening events per cell per minute with increased photon stress. A simulation of 100 pores was used to collect data.
Figure 10
Figure 10
Transition from transient to permanent opening events under increased photon stress for CsA, NAC, and control groups. (A) Simulated regional TMRM fluorescence over time during transition from transient to permanent opening events in the CsA, NAC, and control groups. (B) Average experimental TMRM fluorescence over time during transition from transient to permanent opening events in the CsA, NAC, and control groups [7]. (C) Number of simulated transient and permanent opening events per cell per minute with increased photon stress in the CsA, NAC, and control groups. A total of 100 pores were simulated to produce the data in all cases.
Figure 10
Figure 10
Transition from transient to permanent opening events under increased photon stress for CsA, NAC, and control groups. (A) Simulated regional TMRM fluorescence over time during transition from transient to permanent opening events in the CsA, NAC, and control groups. (B) Average experimental TMRM fluorescence over time during transition from transient to permanent opening events in the CsA, NAC, and control groups [7]. (C) Number of simulated transient and permanent opening events per cell per minute with increased photon stress in the CsA, NAC, and control groups. A total of 100 pores were simulated to produce the data in all cases.
Figure 11
Figure 11
Transition between closed state, open state, and permanent open state for CsA, NAC, and control groups for simulations involving 100 mPTPs. (A) Number of pores in each of three different states (closed, transient open, and permanent open) over time. (B) Number of pores in each of three different states (closed, transient open, and permanent open) over time with the addition of CsA. (C) Number of pores in each of three different states (closed, transient open, and permanent open) over time with the addition of NAC.
Figure 11
Figure 11
Transition between closed state, open state, and permanent open state for CsA, NAC, and control groups for simulations involving 100 mPTPs. (A) Number of pores in each of three different states (closed, transient open, and permanent open) over time. (B) Number of pores in each of three different states (closed, transient open, and permanent open) over time with the addition of CsA. (C) Number of pores in each of three different states (closed, transient open, and permanent open) over time with the addition of NAC.
Figure 12
Figure 12
Simulation in the mPTP model with only transient states. (A) Simulations showing the average TMRM fluorescence from 100 mitochondria with 1, 2, 3, 4, 5, 7, 10, and 20 pores each. (B) Five simulations showing the average TMRM fluorescence from 5 mitochondria with 10 pores each.
Figure 13
Figure 13
Simulation of a mitochondrion mPTP with only transient states. (A) Number of pores in the transient open state in a mitochondrion with 10 pores. (B) Number of open pores in the transient open state in a mitochondrion with 1 pore.

References

    1. Tham Y.K., Bernardo B.C., Ooi J.Y., Weeks K.L., McMullen J.R. Pathophysiology of cardiac hypertrophy and heart failure: Signaling pathways and novel therapeutic targets. Arch. Toxicol. 2015;89:1401–1438. doi: 10.1007/s00204-015-1477-x. - DOI - PubMed
    1. Pizzino G., Irrera N., Cucinotta M., Pallio G., Mannino F., Arcoraci V., Squadrito F., Altavilla D., Bitto A. Oxidative Stress: Harms and Benefits for Human Health. Oxidative Med. Cell. Longev. 2017;2017:8416763. doi: 10.1155/2017/8416763. - DOI - PMC - PubMed
    1. Li Y., Sun J., Wu R., Bai J., Hou Y., Zeng Y., Zhang Y., Wang X., Wang Z., Meng X. Mitochondrial MPTP: A Novel Target of Ethnomedicine for Stroke Treatment by Apoptosis Inhibition. Front. Pharmacol. 2020;11:352. doi: 10.3389/fphar.2020.00352. - DOI - PMC - PubMed
    1. Luis-García E.R., Becerril C., Salgado-Aguayo A., Aparicio-Trejo O.E., Romero Y., Flores-Soto E., Mendoza-Milla C., Montaño M., Chagoya V., Pedraza-Chaverri J., et al. Mitochondrial Dysfunction and Alterations in Mitochondrial Permeability Transition Pore (mPTP) Contribute to Apoptosis Resistance in Idiopathic Pulmonary Fibrosis Fibroblasts. Int. J. Mol. Sci. 2021;22:7870. doi: 10.3390/ijms22157870. - DOI - PMC - PubMed
    1. Kwong J.Q., Molkentin J.D. Physiological and pathological roles of the mitochondrial permeability transition pore in the heart. Cell Metab. 2015;21:206–214. doi: 10.1016/j.cmet.2014.12.001. - DOI - PMC - PubMed

LinkOut - more resources