. 2022 Apr 26;12(5):392.
doi: 10.3390/metabo12050392.

Metabolomics Reveals 5-Aminolevulinic Acid Improved the Ability of Tea Leaves (Camellia sinensis L.) against Cold Stress

Affiliations

Metabolomics Reveals 5-Aminolevulinic Acid Improved the Ability of Tea Leaves (Camellia sinensis L.) against Cold Stress

Fei Yan et al. Metabolites. .

Abstract

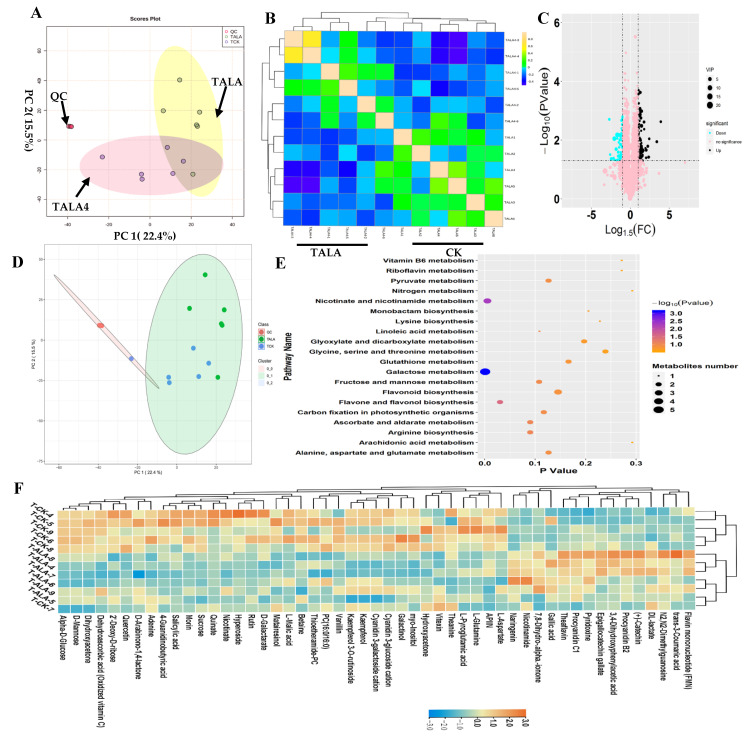
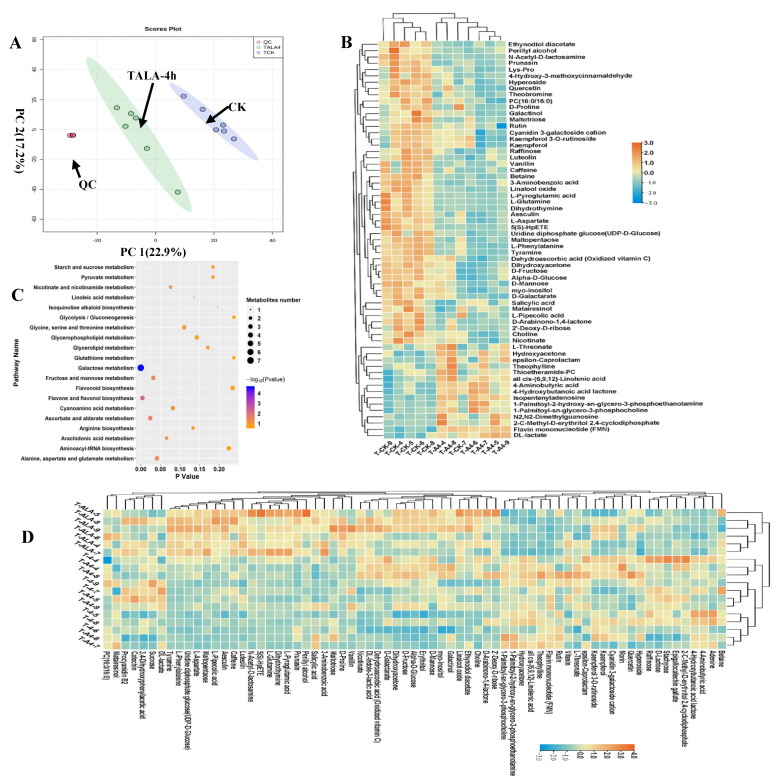
Tea is an important woody crop whose cultivation is severely limited by cold stress. Although 5-aminolevulinic acid (ALA) is known to be effective in alleviating abiotic stresses in plants, knowledge of the detailed metabolic response of tea plants to exogenous ALA-induced cold resistance is still limited-a lack which restricts our ability to protect tea plants from cold stress. In the present study, we performed an in-depth metabolomics analysis to elucidate the metabolic responses of tea plants to cold stress and explore the role of ALA in improving tea plants' cold-resistance capability. Metabolic profiles showed that cold stress altered various metabolisms in tea plants, especially galactose composition and flavonoid contents. Furthermore, exogenous ALA application altered a series of metabolisms associated with cold stress. Importantly, increases in metabolites, including catechin, 3,4-dihydroxyphenylacetic acid and procyanidin B2, involved in the mechanisms of ALA improved tea plants' cold resistance. Overall, our study deciphered detailed metabolic responses of tea plants to cold stress and elucidated the mechanisms of ALA in enhancing cold resistance through rebuilding compositions of soluble carbohydrates and flavonoids. Therefore, we have provided a basis for exogenous usage of ALA to protect tea plants from cold stress.

Keywords: abiotic stress; secondary metabolites; soluble carbohydrates.


Conflict of interest statement

The authors declare no conflict of interest.

Figures

Figure 1
Figure 1
Overview of metabolic patterns of tea following cold stress. (A) Results of the PCA analysis on the standardized data matrix. The score plot (left) shows the projection of the samples in the PC1 and PC2 planes. The loading plot shows the distribution of samples from the T4h and control groups, shown in green and blue, respectively. (B) Correlation analysis between samples from T4h and control groups. The scale represents the correlation value between two samples. (C) Volcano plot showing the differential metabolites in T4h vs. CK (fold changed ≥ 2, p-value ≤ 0.05, VIP > 1.0). The vertical coordinate represents the p-value of the Student’s t-test (−log 10 p-value). The increased and decreased metabolites are shown in black and blue, respectively. The metabolites labeled pink are not significant. The plot size represents the VIP value of the PLSDA model. (D) SOM PCA plot distribution exhibiting two metabolic patterns among all samples. The ellipse represents the 95% confidence interval. (E) Scatter plot of the most enriched Kyoto Encyclopedia of Genes and Genomes (KEGG) pathways of differential metabolites. (F) Heatmap showing the relative levels of differential metabolites with VIP values > 1.0. The upregulated and downregulated metabolites are shown in red and blue, respectively. The scale represents the normalized peak areas of metabolites.
Figure 2
Figure 2
Landscape of metabolic patterns of tea following ALA treatment. (A) PCA analysis of metabolic profiles from TALA and control groups. The TALA and control groups’ samples are green and blue in the loading plot, respectively. (B) Correlation analysis between samples from TALA and the control. (C) Volcano plot showing the differential metabolites in TALA vs. CK comparison. The vertical coordinate represents the p-value of the Student’s t-test (−log 10 p-value). The VIP value of each metabolite from the PLSDA analysis is represented by the plot size. (D) SOM PCA plot distribution exhibiting similar metabolic patterns among all samples. The samples with a similar metabolic pattern were labeled by a 95% confidence interval ellipse. (E) Scatter plot of the most enriched Kyoto Encyclopedia of Genes and Genomes (KEGG) pathways of differential metabolites with VIP values > 1.0. (F) Heatmap showing the relative levels of differential metabolites associated with ALA treatment. The upregulated and downregulated metabolites are shown in red and blue, respectively. The scale represents the normalized peak areas of metabolites.
Figure 3
Figure 3
Overlapping of ALA- and cold-induced metabolic alterations. (A) Venn diagram of all significantly differential metabolites in T4h vs. CK and TALA vs. CK comparisons. Counts in blue and red denote metabolites from T4h vs. CK and TALA vs. CK, respectively. The shaded area denotes the differential metabolites shared by both comparisons. (B) Heatmap displaying the ALA-induced alterations in relative levels of metabolites associated with cold stress. The overlapping area represents the common pathways shared by both comparisons. (C) Venn diagram showing the overlapping enriched pathways in the T4h vs. CK and TALA vs. CK comparisons. (D) Topological correlation network of metabolites associated with ALA treatment and cold stress.
Figure 4
Figure 4
Metabolic alterations in ALA-treated tea tissue under cold stress. (A) PCA score plots for principal components 1 and 2 show high cohesion within groups and good separation among TALA-4h and CK groups. The sampling groups are color-coded as follows: green = TALA-4h; blue = CK; red = QC. (B) Heatmap visualization of relative levels of differential metabolites in the TALA-4h vs. CK comparison. The normalized value of peak areas of metabolites was used to represent the relative metabolite content and complete linkage hierarchical clustering. Each sample is visualized in a single column and each metabolite is represented by a single row. The up- and downregulated metabolites are shown in red and blue, respectively. (C) Enrichment of the differential metabolites from the TALA-4h vs. CK comparison with respect to distinct KEGG pathways. Differential metabolites were mapped to distinct metabolic pathways. Enrichment p-values were computed from a hypergeometric distribution. A p-value cutoff of 0.05 was selected as the threshold. The plot sizes represent the number of metabolites in each pathway term. (D) Relative levels of cold-related metabolites in ALA-treated tissues after cold stress challenge. The scale represents the normalized peak area values for each metabolite in the samples.
Figure 5
Figure 5
Possible pathways for cold stress tolerance in tea improved by ALA.

Similar articles

Cited by

References

    1. Ding C.Q., Zeng J.M., Li N.N., Yang Y.J., Wang X.C., Wang L., Hao X.Y. Effects of low temperature and freezing injury on physiological characteristics and countermeasures of tea tree. China Tea. 2020;42:13–16.
    1. Vyas D., Kumar S. Purification and partial characterization of a low temperature responsive Mn-SOD from tea (Camellia sinensis (L.) O. Kuntze) Biochem. Biophys. Res. Commun. 2005;329:831–838. doi: 10.1016/j.bbrc.2005.02.051. - DOI - PubMed
    1. Fang Y., Mu Z.Z., Yu L.J., Sun L., Liu C.L., Liu C.L. Tea tree varieties and high efficiency tea garden cultivation technology in Shandong. For. Sci. Technol. Dev. 2005;19:62–64.
    1. Zheng C., Zhao L., Wang Y., Shen J.Z., Zhang Y.F., Jia S.S., Li Y.S., Ding Z.T. Integrated RNA-Seq and sRNA-Seq analysis identifies chilling and freezing responsive key molecular players and pathways in tea plant (Camellia sinensis) PLoS ONE. 2015;10:e0125031. doi: 10.1371/journal.pone.0125031. - DOI - PMC - PubMed
    1. Shi H., Wang Y., Zhou K.F. Changes of active oxygen metabolism and osmotic regulation substance content in Tea leaves under low temperature Stress. Shandong Agric. Sci. 2012;44:22–25.

LinkOut - more resources